Mount Vernon, IL (Illinois) Houses and Residents
| Mount Vernon: | $93,442 |
| Illinois: | $251,600 |
Total population: 15,177 (All urban)
Houses: 7,298 (6,223 occupied: 3,412 owner occupied, 2,892 renter occupied)
| % of renters here: | 46% |
| State: | 33% |
Housing density: 633 houses/condos per square mile
Median price asked for vacant for-sale houses and condos in 2022: $83,492.
Median contract rent in 2022: $660 (lower quartile is $517, upper quartile is $792)
Median rent asked for vacant for-rent units in 2022: $543
Median gross rent in Mount Vernon, IL in 2022: $865
Housing units in Mount Vernon with a mortgage: 1,624 (164 second mortgage, 0 home equity loan, 153 both second mortgage and home equity loan)
Houses without a mortgage: 38
Median household income for houses/condos with a mortgage: $71,477
Median household income for apartments without a mortgage: $59,023
Median monthly housing costs: $804
Compare current foreclosures in Mount Vernon, IL:
| Photo | Address | Area | Beds / Baths | Price | Details |
|---|---|---|---|---|---|

|
#1
North Illinois Highway 37
Mount Vernon, IL 62864
|
1,376 sq. feet
|
1 baths 3 beds |
show details | |

|
#2
Oakland Ave
Mount Vernon, IL 62864
|
1,311 sq. feet
|
1 baths 2 beds |
show details | |

|
#3
E Adams Ct
Mount Vernon, IL 62864
|
1,388 sq. feet
|
2 baths 3 beds |
show details | |

|
#4
N Cherryville Ln
Mount Vernon, IL 62864
|
- sq. feet
|
2 baths 3 beds |
show details | |

|
#5
E Nolan Rd
Mount Vernon, IL 62864
|
- sq. feet
|
- baths - beds |
show details | |

|
#6
Northbrook Dr
Mount Vernon, IL 62864
|
- sq. feet
|
- baths - beds |
show details | |

|
#7
Fairfield Rd
Mount Vernon, IL 62864
|
- sq. feet
|
- baths - beds |
show details | |

|
#8
Westmont St Apt 2
Mount Vernon, IL 62864
|
- sq. feet
|
- baths - beds |
show details | |

|
#9
Cumberland Pike Apt B
Mount Vernon, IL 62864
|
- sq. feet
|
- baths - beds |
show details | |

|
#10
Rose Ln Apt 4
Mount Vernon, IL 62864
|
- sq. feet
|
- baths - beds |
show details |
| Photo | Address | Area | Beds / Baths | Price | Details |
|---|---|---|---|---|---|

|
#11
N 9th St Apt 4
Mount Vernon, IL 62864
|
- sq. feet
|
- baths - beds |
show details | |

|
#12
Colonial Dr
Mount Vernon, IL 62864
|
- sq. feet
|
- baths - beds |
show details | |

|
#13
E Richview Rd
Mount Vernon, IL 62864
|
- sq. feet
|
- baths - beds |
show details | |

|
#14
S 15th St
Mount Vernon, IL 62864
|
- sq. feet
|
- baths - beds |
show details | |

|
#15
Frontage Rd
Mount Vernon, IL 62864
|
- sq. feet
|
- baths - beds |
show details | |

|
#16
E Webb Rd
Mount Vernon, IL 62864
|
- sq. feet
|
- baths - beds |
show details | |

|
#17
Salem Rd
Mount Vernon, IL 62864
|
- sq. feet
|
- baths - beds |
show details | |

|
#18
N 6th St
Mount Vernon, IL 62864
|
- sq. feet
|
- baths - beds |
show details | |

|
#19
Bishop Ct
Mount Vernon, IL 62864
|
- sq. feet
|
- baths - beds |
show details | |

|
#20
N Woods Pl
Mount Vernon, IL 62864
|
- sq. feet
|
- baths - beds |
show details |
| Photo | Address | Area | Beds / Baths | Price | Details |
|---|---|---|---|---|---|

|
#21
Park Ave
Mount Vernon, IL 62864
|
- sq. feet
|
- baths - beds |
show details | |

|
#22
N Il Highway 37
Mount Vernon, IL 62864
|
- sq. feet
|
- baths - beds |
show details | |

|
#23
N Spring Garden Ln
Mount Vernon, IL 62864
|
- sq. feet
|
- baths - beds |
show details | |

|
#24
Paula Dr
Mount Vernon, IL 62864
|
- sq. feet
|
- baths - beds |
show details | |

|
#25
Brownsville Rd
Mount Vernon, IL 62864
|
- sq. feet
|
- baths - beds |
show details | |

|
#26
Harrison St
Mount Vernon, IL 62864
|
- sq. feet
|
- baths - beds |
show details | |

|
#27
Dodds St
Mount Vernon, IL 62864
|
- sq. feet
|
- baths - beds |
show details | |

|
#28
Nora Ln
Mount Vernon, IL 62864
|
- sq. feet
|
- baths - beds |
show details | |

|
#29
N Puckett Ln
Mount Vernon, IL 62864
|
- sq. feet
|
- baths - beds |
show details | |

|
#30
Homestead Dr
Mount Vernon, IL 62864
|
- sq. feet
|
- baths - beds |
show details |
| Photo | Address | Area | Beds / Baths | Price | Details |
|---|---|---|---|---|---|

|
#31
E Meadows Dr
Mount Vernon, IL 62864
|
- sq. feet
|
- baths - beds |
show details | |

|
#32
Lime Ave
Mount Vernon, IL 62864
|
- sq. feet
|
- baths - beds |
show details | |

|
#33
Apple Ave
Mount Vernon, IL 62864
|
- sq. feet
|
- baths - beds |
show details | |

|
#34
Isabella Ave
Mount Vernon, IL 62864
|
- sq. feet
|
- baths - beds |
show details | |

|
#35
Centralia Rd
Mount Vernon, IL 62864
|
- sq. feet
|
- baths - beds |
show details | |

|
Check over 1 million property listings on Foreclosure.com!
|
browse all offers | |||


 | Mount Vernon - rental homes (3 replies) |
| Looking into Metropolis in downstate IL (12 replies) |
| Why is the Chicago "Blaccent" More Southern than Boston/NYC/Philly's? (311 replies) |
| Housing Market hitting bottom still!!!????????? (104 replies) |
| Moving from Tampa, FL to Mt. Vernon (18 replies) |
| How are Chicagoland and downstate IL connected? (73 replies) |

Median year apartment built: 1971
Household type by relationship:
Households: 14,537- Male householders: 2,709 (963 living alone), Female householders: 3,400 (1,131 living alone)
2,112 spouses (2,112 opposite-sex spouses), 539 unmarried partners, (520 opposite-sex unmarried partners), 4,238 children (3,973 natural, 75 adopted, 189 stepchildren), 287 grandchildren, 87 brothers or sisters, 112 parents, 163 foster children, 125 other relatives, 314 non-relatives
- In group quarters: 444
Size of family households: 1,875 2-persons, 791 3-persons, 574 4-persons, 254 5-persons, 176 6-persons, 70 7-or-more-persons.
Size of nonfamily households: 2,206 1-person, 265 2-persons, 53 3-persons, 48 4-persons.
1,435 married couples with children.
1,531 single-parent households (359 men, 1,172 women).
96.3% of residents of Mount Vernon speak English at home.
1.5% of residents speak Spanish at home (57% speak English very well, 28% speak English well, 8% speak English not well, 6% don't speak English at all).
0.5% of residents speak other Indo-European language at home (99% speak English very well, 1% speak English well).
1.0% of residents speak Asian or Pacific Island language at home (50% speak English very well, 38% speak English well, 12% speak English not well).
0.4% of residents speak other language at home (87% speak English very well, 13% speak English well).
Foreign born population: 307 (2.1%)
(80.5% of them are naturalized citizens)
| Here: | 6.3 |
| State: | 6.4 |
| Here: | 4.4 |
| State: | 4.1 |

- Bedrooms in owner-occupied houses and condos in Mount Vernon, Illinois
- 0no bedroom
- 271 bedroom
- 8812 bedrooms
- 1,6723 bedrooms
- 5534 bedrooms
- 2795+ bedrooms

- Bedrooms in renter-occupied apartments in Mount Vernon, Illinois
- 120no bedroom
- 5001 bedroom
- 1,4352 bedrooms
- 6003 bedrooms
- 2314 bedrooms
- 65+ bedrooms

- Cars and other vehicles available in Mount Vernon in owner-occupied houses/condos
- 78no vehicle
- 1,1161 vehicle
- 1,4102 vehicles
- 6363 vehicles
- 1084 vehicles
- 635+ vehicles

- Cars and other vehicles available in Mount Vernon in renter-occupied apartments
- 397no vehicle
- 1,7221 vehicle
- 5872 vehicles
- 1223 vehicles
- 344 vehicles
- 315+ vehicles

- Rooms in owner-occupied houses in Mount Vernon, Illinois
- 01 room
- 132 rooms
- 463 rooms
- 3254 rooms
- 5945 rooms
- 9356 rooms
- 5317 rooms
- 3608 rooms
- 6089+ rooms

- Rooms in renter-occupied apartments in Mount Vernon, Illinois
- 1141 room
- 962 rooms
- 5903 rooms
- 6234 rooms
- 7935 rooms
- 2936 rooms
- 2207 rooms
- 648 rooms
- 1009+ rooms


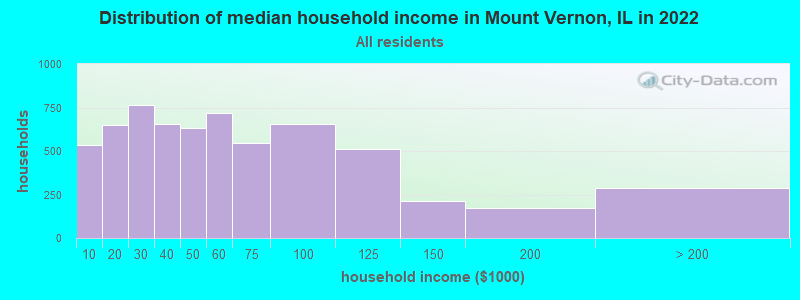
Mount Vernon, IL household income distribution

- 537Less than $10,000
- 650$10,000 to $19,999
- 766$20,000 to $29,999
- 658$30,000 to $39,999
- 634$40,000 to $49,999
- 717$50,000 to $59,999
- 545$60,000 to $74,999
- 656$75,000 to $99,999
- 513$100,000 to $124,999
- 213$125,000 to $149,999
- 170$150,000 to $199,999
- 289$200,000 or more
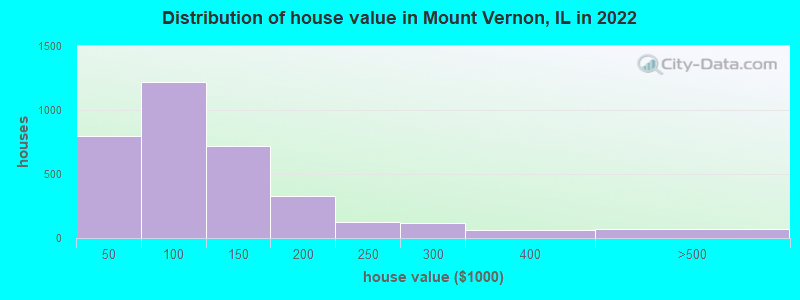
Home value of owner - occupied houses in 2022 in Mount Vernon, IL
-
- 66Less than $10,000
- 119$10,000 to $14,999
- 44$15,000 to $19,999
- 121$20,000 to $24,999
- 64$25,000 to $29,999
- 110$30,000 to $34,999
- 138$35,000 to $39,999
- 128$40,000 to $49,999
- 186$50,000 to $59,999
- 245$60,000 to $69,999
- 162$70,000 to $79,999
- 374$80,000 to $89,999
- 120$90,000 to $99,999
- 409$100,000 to $124,999
- 306$125,000 to $149,999
- 165$150,000 to $174,999
- 162$175,000 to $199,999
- 125$200,000 to $249,999
- 115$250,000 to $299,999
- 63$300,000 to $399,999
- 50$400,000 to $499,999
- 14$500,000 to $749,999
- 8$1,000,000 to $1,499,999
Rent paid by renters in 2022 in Mount Vernon, IL
-
- 38Less than $100
- 3$100 to $149
- 197$150 to $199
- 35$200 to $249
- 35$250 to $299
- 93$300 to $349
- 51$350 to $399
- 69$400 to $449
- 60$450 to $499
- 302$500 to $549
- 208$550 to $599
- 182$600 to $649
- 303$650 to $699
- 301$700 to $749
- 238$750 to $799
- 335$800 to $899
- 107$900 to $999
- 65$1,000 to $1,249
- 70$1,250 to $1,499
- 32$1,500 to $1,999
- 20$3,000 to $3,499
- 46$3,500 or more
- 105No cash rent


Percentage of workers working in this county: 88.9%
Number of people working at home: 261 (4.1% of all workers)
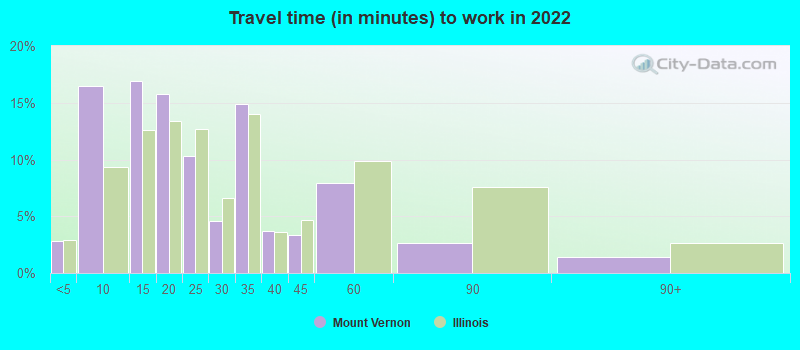
Travel time to work (commute)
- Less than 5 minutes: 342
- 5 to 9 minutes: 2,017
- 10 to 14 minutes: 1,639
- 15 to 19 minutes: 1,052
- 20 to 24 minutes: 326
- 25 to 29 minutes: 82
- 30 to 34 minutes: 225
- 35 to 39 minutes: 41
- 40 to 44 minutes: 60
- 45 to 59 minutes: 152
- 60 to 89 minutes: 97
- 90 or more minutes: 32

Means of transportation to work:
- Drove a car alone: 11,925 (82.6%)
- Carpooled: 1,593 (11.0%)
- Bus: 34 (0.2%)
- Taxi: 185 (1.3%)
- Bicycle: 4 (0.0%)
- Walked: 95 (0.7%)
- Worked at home: 261 (1.8%)

- Unemployment by race in 2022
- Unemployment rate for White non-Hispanic residents
- 4.0%Males
- 4.4%Females
- Unemployment rate for Black residents
- 25.0%Males
- 15.2%Females
- Unemployment rate for American Indian and Alaska Native residents
- 100.0%Males
- Unemployment rate for other race residents
- 100.0%Females
- Unemployment rate for two or more race residents
- 8.4%Males
- 3.9%Females
- Unemployment rate for Hispanic or Latino residents
- 0.3%Males
- 13.8%Females

- Year of entry for the foreign-born population in Mount Vernon, Illinois
- 412010 or later
- 662000 to 2009
- 781990 to 1999
- 241980 to 1989
- 111970 to 1979
- 49Before 1970

First ancestries reported:
- English: 1,057 (18.3%)
- German: 655 (11.4%)
- American: 617 (10.7%)
- Irish: 438 (7.6%)
- European: 127 (2.2%)
- Scottish: 121 (2.1%)
- Swedish: 95 (1.6%)
- Italian: 94 (1.6%)
- Polish: 55 (1.0%)
- Haitian: 51 (0.9%)
- French: 38 (0.7%)
- Dutch: 33 (0.6%)
- Norwegian: 27 (0.5%)
- Scandinavian: 24 (0.4%)
- Scotch-Irish: 21 (0.4%)
- Canadian: 13 (0.2%)
- Lebanese: 11 (0.2%)
- Czech: 11 (0.2%)
- African: 11 (0.2%)
- Northern European: 10 (0.2%)
- Belgian: 7 (0.1%)
- Lithuanian: 7 (0.1%)
- Welsh: 7 (0.1%)
- British: 6 (0.1%)
- Bahamian: 5 (0.09%)
- Egyptian: 3 (0.05%)
Most common places of birth for foreign-born residents (%):
| Mount Vernon: | 27.7% (85) |
| Illinois: | 5.2% (93,003) |
| Mount Vernon: | 22.5% (69) |
| Illinois: | 34.7% (626,958) |
| Mount Vernon: | 15.0% (46) |
| Illinois: | 0.1% (980) |
| Mount Vernon: | 8.1% (25) |
| Illinois: | 9.2% (166,409) |
| Mount Vernon: | 8.1% (25) |
| Illinois: | 2.2% (40,393) |
| Mount Vernon: | 6.8% (21) |
| Illinois: | 0.5% (8,235) |
| Mount Vernon: | 6.5% (20) |
| Illinois: | 1.3% (22,793) |
| Mount Vernon: | 3.6% (11) |
| Illinois: | 0.8% (14,165) |
| Mount Vernon: | 2.6% (8) |
| Illinois: | 1.2% (22,269) |
Place of birth for U.S.-born residents:
- This state: 10,989
- Other state: 3,080
- Northeast: 235
- Midwest: 1,534
- South: 1,117
- West: 174
82.0% of Mount Vernon residents lived in the same house 1 years ago.
Out of people who lived in different houses, 37.9% lived in this county.
Out of people who lived in different counties, 63.7% lived in Illinois.
| Mount Vernon: | 82.0% |
| State average: | 88.3% |
Education attainment for males 25 years and older:
- No schooling: 21
- Nursery to 4th grade: 10
- 5th and 6th grade: 0
- 7th and 8th grade: 54
- 9th grade: 30
- 10th grade: 83
- 11th grade: 122
- 12th grade, no diploma: 77
- High school graduate (or equivalency): 1,516
- Less than 1 year of college: 472
- Some college more than 1 year, no degree: 579
- Associate degree: 630
- Bachelor's degree: 645
- Master's degree: 233
- Professional school degree: 97
- Doctorate degree: 55

Education attainment for females 25 years and older:
- No schooling: 18
- Nursery to 4th grade: 4
- 5th and 6th grade: 12
- 7th and 8th grade: 53
- 9th grade: 46
- 10th grade: 62
- 11th grade: 82
- 12th grade, no diploma: 42
- High school graduate (or equivalency): 1,600
- Less than 1 year of college: 715
- Some college more than 1 year, no degree: 896
- Associate degree: 752
- Bachelor's degree: 637
- Master's degree: 275
- Professional school degree: 38
- Doctorate degree: 9


Housing units in structures:
- One, detached: 5,096
- One, attached: 86
- Two: 172
- 3 or 4: 347
- 5 to 9: 436
- 10 to 19: 409
- 20 to 49: 178
- 50 or more: 166
- Mobile homes: 403
Median worth of mobile homes: $25,225
Housing units lacking complete kitchen facilities in 2022: 8.3%
House/condo owner moved in on average 14 years ago
Renter moved in on average 2 years ago

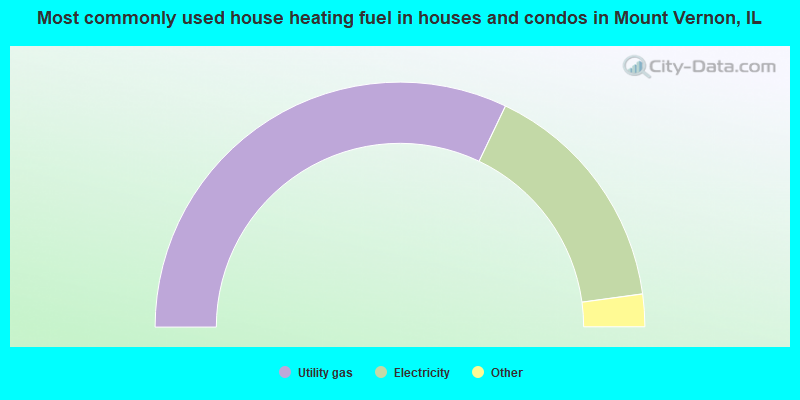
- 64.2%Utility gas
- 31.5%Electricity
- 2.4%Bottled, tank, or LP gas
- 1.2%Wood
- 0.7%No fuel used
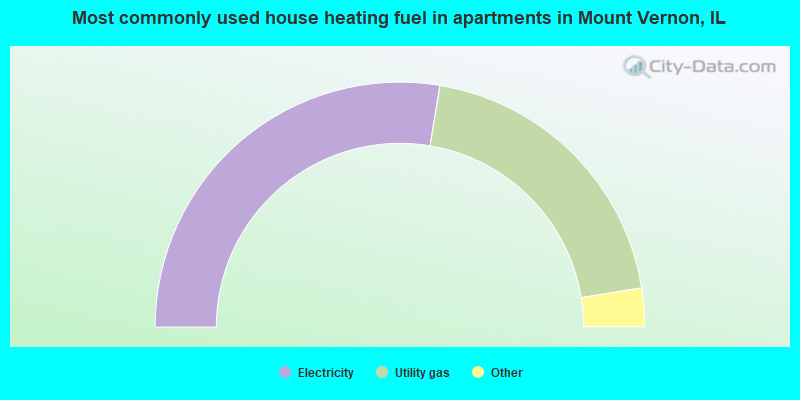
- 55.3%Electricity
- 39.7%Utility gas
- 2.3%Bottled, tank, or LP gas
- 1.8%Other fuel
- 1.0%No fuel used
Private vs. public school enrollment:
| Here: | 15.5% |
| Illinois: | 13.3% |
| Here: | 9.2% |
| Illinois: | 9.9% |
| Here: | 14.4% |
| Illinois: | 27.4% |


