Races in Mount Vernon, Illinois (IL) Detailed Stats
Data:
Races - White alone (%)
Races - White alone (% change since 2000)
Races - Black alone (%)
Races - Black alone (% change since 2000)
Races - American Indian alone (%)
Races - American Indian alone (% change since 2000)
Races - Asian alone (%)
Races - Asian alone (% change since 2000)
Races - Hispanic (%)
Races - Hispanic (% change since 2000)
Races - Native Hawaiian and Other Pacific Islander alone (%)
Races - Native Hawaiian and Other Pacific Islander alone (% change since 2000)
Races - Two or more races(%)
Races - Two or more races(% change since 2000)
Races - Other race alone (%)
Races - Other race alone (% change since 2000)
Racial diversity
Place of birth - Born in state of residence (%)
Place of birth - Born in state of residence (%) - White
Place of birth - Born in state of residence (%) - Black or African American
Place of birth - Born in state of residence (%) - Asian
Place of birth - Born in state of residence (%) - Hispanic or Latino
Place of birth - Born in state of residence (%) - American Indian and Alaska Native
Place of birth - Born in state of residence (%) - Multirace
Place of birth - Born in state of residence (%) - Other Race
Place of birth - Born in other state (%)
Place of birth - Born in other state (%) - White
Place of birth - Born in other state (%) - Black or African American
Place of birth - Born in other state (%) - Asian
Place of birth - Born in other state (%) - Hispanic or Latino
Place of birth - Born in other state (%) - American Indian and Alaska Native
Place of birth - Born in other state (%) - Multirace
Place of birth - Born in other state (%) - Other Race
Place of birth - Native, outside of US (%)
Place of birth - Native, outside of US (%) - White
Place of birth - Native, outside of US (%) - Black or African American
Place of birth - Native, outside of US (%) - Asian
Place of birth - Native, outside of US (%) - Hispanic or Latino
Place of birth - Native, outside of US (%) - American Indian and Alaska Native
Place of birth - Native, outside of US (%) - Multirace
Place of birth - Native, outside of US (%) - Other Race
Place of birth - Foreign born (%)
Place of birth - Foreign born (%) - White
Place of birth - Foreign born (%) - Black or African American
Place of birth - Foreign born (%) - Asian
Place of birth - Foreign born (%) - Hispanic or Latino
Place of birth - Foreign born (%) - American Indian and Alaska Native
Place of birth - Foreign born (%) - Multirace
Place of birth - Foreign born (%) - Other Race
Residents speaking English at home (%)
Residents speaking English at home - Born in the United States (%)
Residents speaking English at home - Native, born elsewhere (%)
Residents speaking English at home - Foreign born (%)
Residents speaking Spanish at home (%)
Residents speaking Spanish at home - Born in the United States (%)
Residents speaking Spanish at home - Native, born elsewhere (%)
Residents speaking Spanish at home - Foreign born (%)
Residents speaking other language at home (%)
Residents speaking other language at home - Born in the United States (%)
Residents speaking other language at home - Native, born elsewhere (%)
Residents speaking other language at home - Foreign born (%)
Marital status - Never married (%)
Marital status - Now married (%)
Marital status - Separated (%)
Marital status - Widowed (%)
Marital status - Divorced (%)
Ancestries Reported - Arab (%)
Ancestries Reported - Czech (%)
Ancestries Reported - Danish (%)
Ancestries Reported - Dutch (%)
Ancestries Reported - English (%)
Ancestries Reported - French (%)
Ancestries Reported - French Canadian (%)
Ancestries Reported - German (%)
Ancestries Reported - Greek (%)
Ancestries Reported - Hungarian (%)
Ancestries Reported - Irish (%)
Ancestries Reported - Italian (%)
Ancestries Reported - Lithuanian (%)
Ancestries Reported - Norwegian (%)
Ancestries Reported - Polish (%)
Ancestries Reported - Portuguese (%)
Ancestries Reported - Russian (%)
Ancestries Reported - Scotch-Irish (%)
Ancestries Reported - Scottish (%)
Ancestries Reported - Slovak (%)
Ancestries Reported - Subsaharan African (%)
Ancestries Reported - Swedish (%)
Ancestries Reported - Swiss (%)
Ancestries Reported - Ukrainian (%)
Ancestries Reported - United States (%)
Ancestries Reported - Welsh (%)
Ancestries Reported - West Indian (%)
Ancestries Reported - Other (%)
Geographical mobility - Same house 1 year ago (%)
Geographical mobility - Same house 1 year ago (%) - White
Geographical mobility - Same house 1 year ago (%) - Black or African American
Geographical mobility - Same house 1 year ago (%) - Asian
Geographical mobility - Same house 1 year ago (%) - Hispanic or Latino
Geographical mobility - Same house 1 year ago (%) - American Indian and Alaska Native
Geographical mobility - Same house 1 year ago (%) - Multirace
Geographical mobility - Same house 1 year ago (%) - Other Race
Geographical mobility - Moved within same county (%)
Geographical mobility - Moved within same county (%) - White
Geographical mobility - Moved within same county (%) - Black or African American
Geographical mobility - Moved within same county (%) - Asian
Geographical mobility - Moved within same county (%) - Hispanic or Latino
Geographical mobility - Moved within same county (%) - American Indian and Alaska Native
Geographical mobility - Moved within same county (%) - Multirace
Geographical mobility - Moved within same county (%) - Other Race
Geographical mobility - Moved from different county within same state (%)
Geographical mobility - Moved from different county within same state (%) - White
Geographical mobility - Moved from different county within same state (%) - Black or African American
Geographical mobility - Moved from different county within same state (%) - Asian
Geographical mobility - Moved from different county within same state (%) - Hispanic or Latino
Geographical mobility - Moved from different county within same state (%) - American Indian and Alaska Native
Geographical mobility - Moved from different county within same state (%) - Multirace
Geographical mobility - Moved from different county within same state (%) - Other Race
Geographical mobility - Moved from different state (%)
Geographical mobility - Moved from different state (%) - White
Geographical mobility - Moved from different state (%) - Black or African American
Geographical mobility - Moved from different state (%) - Asian
Geographical mobility - Moved from different state (%) - Hispanic or Latino
Geographical mobility - Moved from different state (%) - American Indian and Alaska Native
Geographical mobility - Moved from different state (%) - Multirace
Geographical mobility - Moved from different state (%) - Other Race
Geographical mobility - Moved from abroad (%)
Geographical mobility - Moved from abroad (%) - White
Geographical mobility - Moved from abroad (%) - Black or African American
Geographical mobility - Moved from abroad (%) - Asian
Geographical mobility - Moved from abroad (%) - Hispanic or Latino
Geographical mobility - Moved from abroad (%) - American Indian and Alaska Native
Geographical mobility - Moved from abroad (%) - Multirace
Geographical mobility - Moved from abroad (%) - Other Race
Place of birth for the foreign-born population - Ireland (%)
Place of birth for the foreign-born population - Denmark (%)
Place of birth for the foreign-born population - Norway (%)
Place of birth for the foreign-born population - Sweden (%)
Place of birth for the foreign-born population - United Kingdom (%)
Place of birth for the foreign-born population - England (%)
Place of birth for the foreign-born population - Scotland (%)
Place of birth for the foreign-born population - Other Northern Europe (%)
Place of birth for the foreign-born population - Austria (%)
Place of birth for the foreign-born population - Belgium (%)
Place of birth for the foreign-born population - France (%)
Place of birth for the foreign-born population - Germany (%)
Place of birth for the foreign-born population - Netherlands (%)
Place of birth for the foreign-born population - Switzerland (%)
Place of birth for the foreign-born population - Other Western Europe (%)
Place of birth for the foreign-born population - Greece (%)
Place of birth for the foreign-born population - Italy (%)
Place of birth for the foreign-born population - Portugal (%)
Place of birth for the foreign-born population - Spain (%)
Place of birth for the foreign-born population - Other Southern Europe (%)
Place of birth for the foreign-born population - Albania (%)
Place of birth for the foreign-born population - Belarus (%)
Place of birth for the foreign-born population - Bosnia and Herzegovina (%)
Place of birth for the foreign-born population - Bulgaria (%)
Place of birth for the foreign-born population - Croatia (%)
Place of birth for the foreign-born population - Czechoslovakia (%)
Place of birth for the foreign-born population - Hungary (%)
Place of birth for the foreign-born population - Latvia (%)
Place of birth for the foreign-born population - Lithuania (%)
Place of birth for the foreign-born population - North Macedonia (Macedonia) (%)
Place of birth for the foreign-born population - Moldova (%)
Place of birth for the foreign-born population - Poland (%)
Place of birth for the foreign-born population - Romania (%)
Place of birth for the foreign-born population - Russia (%)
Place of birth for the foreign-born population - Serbia (%)
Place of birth for the foreign-born population - Ukraine (%)
Place of birth for the foreign-born population - Other Eastern Europe (%)
Place of birth for the foreign-born population - China (%)
Place of birth for the foreign-born population - Hong Kong (%)
Place of birth for the foreign-born population - Taiwan (%)
Place of birth for the foreign-born population - Japan (%)
Place of birth for the foreign-born population - Korea (%)
Place of birth for the foreign-born population - Other Eastern Asia (%)
Place of birth for the foreign-born population - Afghanistan (%)
Place of birth for the foreign-born population - Bangladesh (%)
Place of birth for the foreign-born population - India (%)
Place of birth for the foreign-born population - Iran (%)
Place of birth for the foreign-born population - Kazakhstan (%)
Place of birth for the foreign-born population - Nepal (%)
Place of birth for the foreign-born population - Pakistan (%)
Place of birth for the foreign-born population - Sri Lanka (%)
Place of birth for the foreign-born population - Uzbekistan (%)
Place of birth for the foreign-born population - Other South Central Asia (%)
Place of birth for the foreign-born population - Burma (%)
Place of birth for the foreign-born population - Cambodia (%)
Place of birth for the foreign-born population - Indonesia (%)
Place of birth for the foreign-born population - Laos (%)
Place of birth for the foreign-born population - Malaysia (%)
Place of birth for the foreign-born population - Philippines (%)
Place of birth for the foreign-born population - Singapore (%)
Place of birth for the foreign-born population - Thailand (%)
Place of birth for the foreign-born population - Vietnam (%)
Place of birth for the foreign-born population - Other South Eastern Asia (%)
Place of birth for the foreign-born population - Armenia (%)
Place of birth for the foreign-born population - Iraq (%)
Place of birth for the foreign-born population - Israel (%)
Place of birth for the foreign-born population - Jordan (%)
Place of birth for the foreign-born population - Kuwait (%)
Place of birth for the foreign-born population - Lebanon (%)
Place of birth for the foreign-born population - Saudi Arabia (%)
Place of birth for the foreign-born population - Syria (%)
Place of birth for the foreign-born population - Turkey (%)
Place of birth for the foreign-born population - Yemen (%)
Place of birth for the foreign-born population - Other Western Asia (%)
Place of birth for the foreign-born population - Eritrea (%)
Place of birth for the foreign-born population - Ethiopia (%)
Place of birth for the foreign-born population - Kenya (%)
Place of birth for the foreign-born population - Somalia (%)
Place of birth for the foreign-born population - Uganda (%)
Place of birth for the foreign-born population - Zimbabwe (%)
Place of birth for the foreign-born population - Other Eastern Africa (%)
Place of birth for the foreign-born population - Cameroon (%)
Place of birth for the foreign-born population - Congo (%)
Place of birth for the foreign-born population - Democratic Republic of Congo (Zaire) (%)
Place of birth for the foreign-born population - Other Middle Africa (%)
Place of birth for the foreign-born population - Egypt (%)
Place of birth for the foreign-born population - Morocco (%)
Place of birth for the foreign-born population - Sudan (%)
Place of birth for the foreign-born population - Other Northern Africa (%)
Place of birth for the foreign-born population - South Africa (%)
Place of birth for the foreign-born population - Other Southern Africa (%)
Place of birth for the foreign-born population - Cabo Verde (%)
Place of birth for the foreign-born population - Ghana (%)
Place of birth for the foreign-born population - Liberia (%)
Place of birth for the foreign-born population - Nigeria (%)
Place of birth for the foreign-born population - Senegal (%)
Place of birth for the foreign-born population - Sierra Leone (%)
Place of birth for the foreign-born population - Other Western Africa (%)
Place of birth for the foreign-born population - Australia (%)
Place of birth for the foreign-born population - New Zealand (%)
Place of birth for the foreign-born population - Fiji (%)
Place of birth for the foreign-born population - Micronesia (%)
Place of birth for the foreign-born population - Bahamas (%)
Place of birth for the foreign-born population - Barbados (%)
Place of birth for the foreign-born population - Cuba (%)
Place of birth for the foreign-born population - Dominica (%)
Place of birth for the foreign-born population - Dominican Republic (%)
Place of birth for the foreign-born population - Grenada (%)
Place of birth for the foreign-born population - Haiti (%)
Place of birth for the foreign-born population - Jamaica (%)
Place of birth for the foreign-born population - St. Vincent and the Grenadines (%)
Place of birth for the foreign-born population - Trinidad and Tobago (%)
Place of birth for the foreign-born population - West Indies (%)
Place of birth for the foreign-born population - Other Caribbean (%)
Place of birth for the foreign-born population - Belize (%)
Place of birth for the foreign-born population - Costa Rica (%)
Place of birth for the foreign-born population - El Salvador (%)
Place of birth for the foreign-born population - Guatemala (%)
Place of birth for the foreign-born population - Honduras (%)
Place of birth for the foreign-born population - Mexico (%)
Place of birth for the foreign-born population - Nicaragua (%)
Place of birth for the foreign-born population - Panama (%)
Place of birth for the foreign-born population - Other Central America (%)
Place of birth for the foreign-born population - Argentina (%)
Place of birth for the foreign-born population - Bolivia (%)
Place of birth for the foreign-born population - Brazil (%)
Place of birth for the foreign-born population - Chile (%)
Place of birth for the foreign-born population - Colombia (%)
Place of birth for the foreign-born population - Ecuador (%)
Place of birth for the foreign-born population - Guyana (%)
Place of birth for the foreign-born population - Peru (%)
Place of birth for the foreign-born population - Uruguay (%)
Place of birth for the foreign-born population - Venezuela (%)
Place of birth for the foreign-born population - Other South America (%)
Place of birth for the foreign-born population - Canada (%)
Place of birth for the foreign-born population - Other Northern America (%)
Place of birth for the foreign-born population - Other (%)
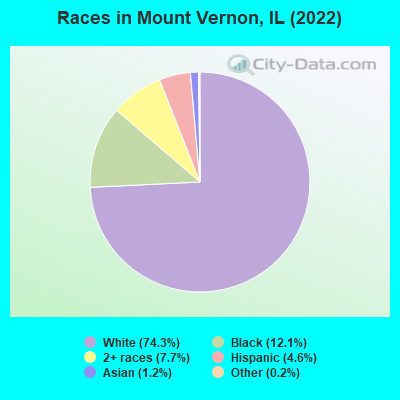
According to 2022 data, the most numerous races in Mount Vernon, IL are White alone (10,798 residents), Hispanic (668 residents), and Black alone (1,764 residents). 96.1% of Mount Vernon residents speak English at home. 2.1% of Mount Vernon, IL residents are foreign-born (1.1% born in Asia, 0.6% born in Latin America), which is 562.9% less than the foreign-born rate of 14.0% across the entire state of Illinois.
Race distribution in Mount Vernon
2000 2022
8,424,140 67.8% White alone 1,856,152 14.9% Black alone 1,530,262 12.3% Hispanic 419,916 3.4% Asian alone 153,996 1.2% Two or more races 13,479 0.1% Other race alone 18,232 0.1% American Indian alone 3,116 0.03% Native Hawaiian and Other
7,356,301 58.5% White alone 2,299,726 18.3% Hispanic 1,660,423 13.2% Black alone 747,296 5.9% Asian alone 458,599 3.6% Two or more races 45,386 0.4% Other race alone 10,405 0.08% American Indian alone 3,896 0.03% Native Hawaiian and Other
Income and house value in Mount Vernon Median household income in 2022 $47,872 White non-Hispanic householders$35,155 Black householders$79,597 Asian householders$30,962 Two or more races householders$73,339 Hispanic or Latino race householdersMedian 2022 house value $103,334 White Non-Hispanic householders$52,638 Black or African American householders$114,815 American Indian or Alaska Native householders $209,847 Asian householders$150,143 Native Hawaiian and other Pacific Islander householders$39,743 Some other race householders$203,135 Two or more races householders$62,353 Hispanic or Latino householders
Median age by race in Mount Vernon
43.9 Median age for White residents38.7 49.0 29.8 Median age for Black or African American residents29.4 34.5 -696,696,696.0 Median age for American Indian / Alaska Native residents-720,238,094.5 -688,956,432.9 45.1 Median age for Asian residents48.4 44.8 -593,236,714.4 Median age for Native Hawaiian / Pacific Islander residents-658,536,584.7 -576,015,108.0 46.0 Median age for Other race residents48.4 45.4 20.0 Median age for Two or more races residents20.2 17.3 43.8 Median age for White alone residents38.6 48.2 21.5 Median age for Hispanic or Latino residents19.4 33.0
Owner/renter occupied households by race in Mount Vernon
House owners and renters - White residents 2,898 58.3% Owner occupied2,071 41.7% Renter occupiedHouse owners and renters - Black or African American residents 210 32.8% Owner occupied431 67.2% Renter occupiedHouse owners and renters - Asian residents 16 27.0% Owner occupied43 73.0% Renter occupiedHouse owners and renters - Other race residents 14 53.3% Owner occupied12 46.7% Renter occupiedHouse owners and renters - Two or more races residents 211 51.5% Owner occupied198 48.5% Renter occupiedHouse owners and renters - White alone residents 2,922 57.3% Owner occupied2,178 42.7% Renter occupiedHouse owners and renters - Hispanic or Latino residents 74 70.2% Owner occupied31 29.8% Renter occupied
Language usage in Mount Vernon
English speakers - Total 96.1% of residents of Mount Vernon speak English at home.
1.5% of residents speak Spanish at home 113 56.8% Speak English very well86 43.2% Speak English less than very well2.0% of residents speak other language at home 186 69.1% Speak English very well83 30.9% Speak English less than very well
English speakers - Born in the United States 96.7% of residents of Mount Vernon speak English at home.
2.3% of residents speak Spanish at home 24 34.3% Speak English very well46 65.7% Speak English less than very well0.8% of residents speak other language at home 12 48.0% Speak English very well13 52.0% Speak English less than very well
English speakers - Native, born elsewhere 86.8% of residents of Mount Vernon speak English at home.
11.6% of residents speak Spanish at home 14 100.0% Speak English less than very well
English speakers - Foreign-born 21.1% of residents of Mount Vernon speak English at home.
21.1% of residents speak Spanish at home 48 73.8% Speak English very well17 26.2% Speak English less than very well56.2% of residents speak other language at home 114 65.9% Speak English very well59 34.1% Speak English less than very well
White (Caucasian) - Speak only English Native:
100.0% (10,085)Foreign-born:
62.8% (11)
White (Caucasian) - Speak another language Native:
1.0% (98)Foreign-born:
42.6% (7)
Black or African American - Speak only English Native:
99.7% (1,565)Foreign-born:
100.0% (5)
Asian - Speak only English Native:
69.8% (30)Foreign-born:
10.4% (17)
Asian - Speak another language Native:
29.7% (13)Foreign-born:
89.7% (145)
Other race - Speak only English Native:
94.0% (66)Foreign-born:
61.9% (13)
Other race - Speak another language Native:
13.1% (9)Foreign-born:
38.9% (8)
Two or more races - Speak another language Native:
5.6% (80)Foreign-born:
100.0% (117)
White alone - Speak only English Native:
99.2% (10,122)Foreign-born:
86.2% (12)
White alone - Speak another language Native:
0.7% (68)Foreign-born:
7.3% (1)
Hispanic or Latino - Speak only English Native:
83.2% (420)Foreign-born:
24.6% (31)
Hispanic or Latino - Speak another language Native:
19.1% (97)Foreign-born:
74.9% (93)
Foreign-born residents in Mount Vernon 307 residents are foreign born (1.1% Asia , 0.6% Latin America ).
This city:
2.1%Illinois:
14.1%
Marital status for residents in Mount Vernon Marital status - White (Caucasian) population 15 years and over
Males 37.0% Never married47.3% Now married0.0% Separated2.6% Widowed13.1% DivorcedFemales 24.6% Never married42.1% Now married1.7% Separated13.4% Widowed18.2% DivorcedWomen who gave birth in the past 12 months Now married:
76.2% (115)Unmarried:
23.8% (36)
Women who did not give birth in the past 12 months Now married:
36.7% (741)Unmarried:
63.3% (1,277)
Marital status - Black or African American population 15 years and over
Males 73.5% Never married16.5% Now married0.0% Separated2.1% Widowed7.9% DivorcedFemales 50.8% Never married13.3% Now married0.3% Separated18.6% Widowed17.0% DivorcedWomen who gave birth in the past 12 months Now married:
0.0% (0)Unmarried:
100.0% (24)
Women who did not give birth in the past 12 months Now married:
10.6% (32)Unmarried:
89.4% (272)
Marital status - Asian population 15 years and over
Males 31.9% Never married56.9% Now married0.0% Separated11.1% Widowed0.0% DivorcedFemales 26.4% Never married70.5% Now married0.0% Separated3.1% Widowed0.0% DivorcedWomen who did not give birth in the past 12 months Now married:
73.6% (82)Unmarried:
26.4% (29)
Marital status - Other race population 15 years and over
Males 59.6% Never married40.4% Now married0.0% Separated0.0% Widowed0.0% DivorcedFemales 76.7% Never married0.0% Now married0.0% Separated23.3% Widowed0.0% DivorcedWomen who did not give birth in the past 12 months Now married:
0.0% (0)Unmarried:
100.0% (27)
Marital status - Two or more races population 15 years and over
Males 48.4% Never married40.9% Now married0.0% Separated2.4% Widowed8.3% DivorcedFemales 46.5% Never married24.0% Now married7.1% Separated5.8% Widowed16.6% DivorcedWomen who gave birth in the past 12 months Now married:
0.0% (0)Unmarried:
100.0% (12)
Women who did not give birth in the past 12 months Now married:
33.2% (106)Unmarried:
66.8% (214)
Marital status - White alone, not Hispanic / Latino population 15 years and over
Males 37.4% Never married46.6% Now married0.0% Separated2.7% Widowed13.4% DivorcedFemales 23.6% Never married42.7% Now married1.7% Separated13.4% Widowed18.5% DivorcedWomen who gave birth in the past 12 months Now married:
76.2% (122)Unmarried:
23.8% (38)
Women who did not give birth in the past 12 months Now married:
37.6% (789)Unmarried:
62.4% (1,307)
Marital status - Hispanic or Latino population 15 years and over
Males 54.2% Never married45.8% Now married0.0% Separated0.0% Widowed0.0% DivorcedFemales 62.7% Never married23.2% Now married7.7% Separated6.3% Widowed0.0% DivorcedWomen who did not give birth in the past 12 months Now married:
36.1% (45)Unmarried:
63.9% (79)
Ancestries in Mount Vernon
1,057 18.3% English655 11.4% German617 10.7% American438 7.6% Irish127 2.2% European121 2.1% Scottish95 1.6% Swedish94 1.6% Italian55 1.0% Polish51 0.9% Haitian38 0.7% French33 0.6% Dutch27 0.5% Norwegian24 0.4% Scandinavian21 0.4% Scotch-Irish13 0.2% Canadian11 0.2% Lebanese11 0.2% Czech11 0.2% African10 0.2% Northern European7 0.1% Belgian7 0.1% Lithuanian7 0.1% Welsh6 0.1% British5 0.09% Bahamian3 0.05% Egyptian
Geographical mobility in Mount Vernon Same house 1 year ago 8,512 82.2% White (Caucasian)1,325 79.1% Black or African American31 94.9% American Indian / Alaska Native198 96.4% Asian6 100.0% Native Hawaiian / Pacific Islander56 61.4% Other race1,359 82.6% Two or more races8,736 81.9% White alone, not Hispanic / Latino596 90.1% Hispanic or LatinoMoved within same county 1,117 10.8% White / Caucasian180 10.7% Black or African American2 4.9% American Indian / Alaska Native6 3.0% Asian246 14.9% Two or more races1,186 11.1% White alone, not Hispanic / Latino12 1.9% Hispanic or LatinoMoved within same state 412 4.0% White / Caucasian104 6.2% Black or African American41 45.6% Other race34 2.0% Two or more races424 4.0% White alone, not Hispanic / Latino53 8.0% Hispanic or LatinoMoved from different state 266 2.6% White / Caucasian66 4.0% Black or African American274 2.6% White alone, not Hispanic / LatinoMoved from abroad 1 0.0% White1 0.0% White alone, not Hispanic / Latino
Children Nativity (place of birth) in Mount Vernon
Children under 6 years - Living with two parents Both parents native 371 100.0% NativeOne native, one foreign-born parent 53 100.0% NativeChildren under 6 years - Living with one parent Native parent 592 100.0% Native
Children 6 to 17 years - Living with two parents Both parents native 926 97.8% Native21 2.2% Foreign-bornOne native, one foreign-born parent 79 100.0% NativeChildren 6 to 17 years - Living with one parent Native parent 1,041 100.0% Native
Grandparents responsible for own grandchildren in Mount Vernon
Grandparents (30 to 59 years) White / Caucasian 37 84.8% Responsible for grandchildren7 15.2% Not responsible for grandchildrenBlack or African American 8 100.0% Not responsible for grandchildrenWhite alone, not Hispanic / Latino 41 83.3% Responsible for grandchildren8 16.7% Not responsible for grandchildrenGrandparents (60 years and over) White / Caucasian 18 36.1% Responsible for grandchildren32 63.9% Not responsible for grandchildrenBlack or African American 20 70.0% Responsible for grandchildren8 30.0% Not responsible for grandchildrenWhite alone, not Hispanic / Latino 19 35.1% Responsible for grandchildren36 64.9% Not responsible for grandchildren