Mount Dora, FL (Florida) Houses and Residents
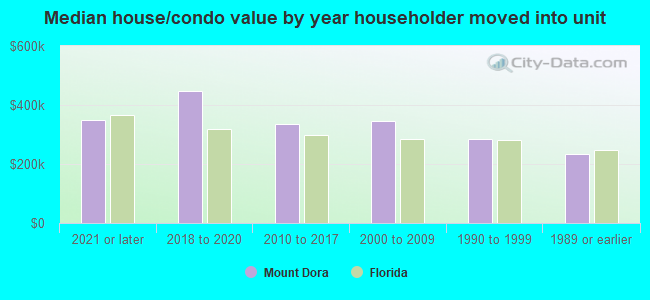
| Mount Dora: | $358,927 |
| Florida: | $354,100 |
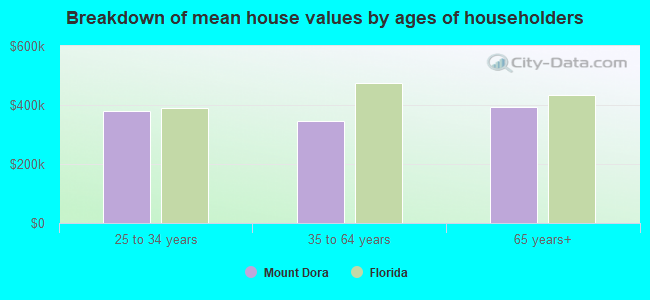
Mean price in 2022:
Detached houses: $340,646
Here: $340,646 State: $500,941 Townhouses or other attached units: $303,607
Here: $303,607 State: $370,869 In 5-or-more-unit structures: $121,882
Here: $121,882 State: $447,145 Mobile homes: $87,488
Here: $87,488 State: $113,202
Total population: 13,182 (Urban population: 9,353, Rural population: 69 (all nonfarm))
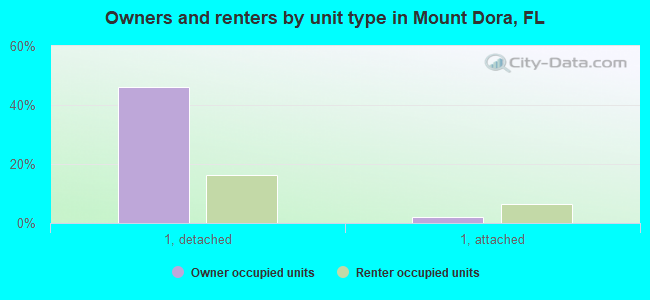
Houses: 8,413 (7,365 occupied: 4,796 owner occupied, 2,849 renter occupied)
| % of renters here: | 37% |
| State: | 33% |
Housing density: 1,711 houses/condos per square mile
Median price asked for vacant for-sale houses and condos in 2022: $155,015.
Median contract rent in 2022: $1,281 (lower quartile is $848, upper quartile is $1,762)
Median rent asked for vacant for-rent units in 2022: $1,508
Median gross rent in Mount Dora, FL in 2022: $1,480
Housing units in Mount Dora with a mortgage: 2,836 (206 second mortgage, 0 home equity loan, 206 both second mortgage and home equity loan)
Houses without a mortgage: 24
Median household income for houses/condos with a mortgage: $107,420
Median household income for apartments without a mortgage: $62,613
Median monthly housing costs: $1,414
Compare current foreclosures in Mount Dora, FL:
| Photo | Address | Area | Beds / Baths | Price | Details |
|---|---|---|---|---|---|

|
#1
Vincent Dr
Mount Dora, FL 32757
|
1,303 sq. feet
|
2 baths 3 beds |
show details | |

|
#2
E Jackson Ave
Mount Dora, FL 32757
|
1,066 sq. feet
|
2 baths 3 beds |
show details | |

|
#3
Natoma Blvd
Mount Dora, FL 32757
|
2,654 sq. feet
|
4 baths 4 beds |
show details | |

|
#4
Nantucket Sound
Mount Dora, FL 32757
|
3,002 sq. feet
|
3 baths 4 beds |
show details | |

|
#5
Cheval St
Mount Dora, FL 32757
|
2,904 sq. feet
|
3 baths 4 beds |
show details | |

|
#6
Triangle Dr
Mount Dora, FL 32757
|
1,042 sq. feet
|
1 baths 3 beds |
show details | |

|
#7
Vincent Dr
Mount Dora, FL 32757
|
950 sq. feet
|
2 baths 3 beds |
show details | |

|
#8
Stafford Springs Blvd
Mount Dora, FL 32757
|
1,609 sq. feet
|
2 baths 2 beds |
show details | |

|
#9
Quarter Cv
Mount Dora, FL 32757
|
3,499 sq. feet
|
4 baths 6 beds |
show details | |

|
#10
E 8th Ave
Mount Dora, FL 32757
|
1,610 sq. feet
|
2 baths 3 beds |
show details |
| Photo | Address | Area | Beds / Baths | Price | Details |
|---|---|---|---|---|---|

|
#11
Meadowland Dr
Mount Dora, FL 32757
|
2,161 sq. feet
|
2 baths 4 beds |
show details | |

|
#12
Strathmore Cir
Mount Dora, FL 32757
|
1,837 sq. feet
|
2 baths 4 beds |
show details | |

|
#13
Old Highway 441 S
Mount Dora, FL 32757
|
909 sq. feet
|
1 baths 2 beds |
show details | |

|
#14
Lake Ola Dr
Mount Dora, FL 32757
|
3,704 sq. feet
|
3 baths 5 beds |
show details | |

|
#15
Holly Ct
Mount Dora, FL 32757
|
1,672 sq. feet
|
2 baths 3 beds |
show details | |

|
#16
Florence Rd
Mount Dora, FL 32757
|
1,025 sq. feet
|
1 baths 3 beds |
show details | |

|
#17
Holly St
Mount Dora, FL 32757
|
1,527 sq. feet
|
2 baths 4 beds |
show details | |

|
#18
Simpson Ln
Mount Dora, FL 32757
|
1,170 sq. feet
|
2 baths 3 beds |
show details | |

|
#19
Southland Rd
Mount Dora, FL 32757
|
1,389 sq. feet
|
1 baths 3 beds |
show details | |

|
#20
Coventry Ct
Mount Dora, FL 32757
|
1,133 sq. feet
|
2 baths 2 beds |
show details |
| Photo | Address | Area | Beds / Baths | Price | Details |
|---|---|---|---|---|---|

|
#21
Crimson Clover Dr
Mount Dora, FL 32757
|
1,846 sq. feet
|
2 baths 4 beds |
show details | |

|
#22
Cobble Ln
Mount Dora, FL 32757
|
1,362 sq. feet
|
2 baths 3 beds |
show details | |

|
#23
Red Coral Cir
Mount Dora, FL 32757
|
2,650 sq. feet
|
3 baths 4 beds |
show details | |

|
#24
Strathmore Cir
Mount Dora, FL 32757
|
1,523 sq. feet
|
2 baths 3 beds |
show details | |

|
#25
Groveland Rd
Mount Dora, FL 32757
|
965 sq. feet
|
2 baths 2 beds |
show details | |

|
#26
Ballark St
Mount Dora, FL 32757
|
3,236 sq. feet
|
3 baths 3 beds |
show details | |

|
#27
Tremayne Dr
Mount Dora, FL 32757
|
4,433 sq. feet
|
3 baths 4 beds |
show details | |

|
#28
Sloewood Ct
Mount Dora, FL 32757
|
3,422 sq. feet
|
4 baths 4 beds |
show details | |

|
#29
E Jackson Ave
Mount Dora, FL 32757
|
1,190 sq. feet
|
2 baths 2 beds |
show details | |

|
#30
Scenic Hills Dr
Mount Dora, FL 32757
|
2,212 sq. feet
|
2 baths 3 beds |
show details |
| Photo | Address | Area | Beds / Baths | Price | Details |
|---|---|---|---|---|---|

|
#31
Lakeshore Pointe Blvd # 2402
Mount Dora, FL 32757
|
3,674 sq. feet
|
2 baths 3 beds |
show details | |

|
#32
Pico Ln
Mount Dora, FL 32757
|
1,686 sq. feet
|
2 baths 3 beds |
show details | |

|
#33
Rishley Run Way
Mount Dora, FL 32757
|
2,663 sq. feet
|
3 baths 4 beds |
show details | |

|
#34
Meadowland Dr
Mount Dora, FL 32757
|
2,368 sq. feet
|
3 baths 3 beds |
show details | |

|
#35
Dorset Dr
Mount Dora, FL 32757
|
1,230 sq. feet
|
2 baths 2 beds |
show details | |

|
#36
N Sunset Dr
Mount Dora, FL 32757
|
1,513 sq. feet
|
2 baths - beds |
show details | |

|
#37
Triangle Dr
Mount Dora, FL 32757
|
1,311 sq. feet
|
1 baths - beds |
show details | |

|
#38
Emerald Dr
Mount Dora, FL 32757
|
836 sq. feet
|
1 baths - beds |
show details | |

|
#39
County Road 448a
Mount Dora, FL 32757
|
2,100 sq. feet
|
2 baths - beds |
show details | |

|
#40
Morningside St
Mount Dora, FL 32757
|
966 sq. feet
|
1 baths - beds |
show details |
| Photo | Address | Area | Beds / Baths | Price | Details |
|---|---|---|---|---|---|

|
#41
Evergreen Ct
Mount Dora, FL 32757
|
890 sq. feet
|
1 baths - beds |
show details | |

|
#42
N Clayton St
Mount Dora, FL 32757
|
- sq. feet
|
- baths - beds |
show details | |

|
#43
Beth Page Loop
Mount Dora, FL 32757
|
- sq. feet
|
- baths - beds |
show details | |

|
#44
Veranda Way Apt 609
Mount Dora, FL 32757
|
- sq. feet
|
- baths - beds |
show details | |

|
#45
Crimson Clover Dr
Mount Dora, FL 32757
|
- sq. feet
|
- baths - beds |
show details | |

|
#46
High Point Dr
Mount Dora, FL 32757
|
- sq. feet
|
- baths - beds |
show details | |

|
#47
Meadowland Dr
Mount Dora, FL 32757
|
- sq. feet
|
- baths - beds |
show details | |

|
#48
Magnetite Loop
Mount Dora, FL 32757
|
- sq. feet
|
- baths - beds |
show details | |

|
#49
Liberty Ave
Mount Dora, FL 32757
|
- sq. feet
|
- baths - beds |
show details | |

|
Check over 1 million property listings on Foreclosure.com!
|
browse all offers | |||


 | Basements can be practical for homes in central & northern florida (23 replies) |
| Apartment Rents OUTSIDE of Orlando? (7 replies) |
| Buying 2nd home in Naples-from MN (40 replies) |
| Apartments in Mount Dora (1 reply) |
| FL Horrible Health Care (60 replies) |
| Mount Dora vs Clermont/Groveland Area - Where should I live?? (4 replies) |

Median year apartment built: 1992
Household type by relationship:
Households: 17,314- Male householders: 3,785 (964 living alone), Female householders: 3,660 (1,397 living alone)
3,607 spouses (3,592 opposite-sex spouses), 371 unmarried partners, (346 opposite-sex unmarried partners), 4,123 children (4,048 natural, 41 adopted, 33 stepchildren), 325 grandchildren, 115 brothers or sisters, 224 parents, 0 foster children, 213 other relatives, 526 non-relatives
- In group quarters: 361
Size of family households: 3,012 2-persons, 668 3-persons, 800 4-persons, 152 5-persons, 119 6-persons, 44 7-or-more-persons.
Size of nonfamily households: 2,467 1-person, 257 2-persons, 51 3-persons, 32 7-or-more-persons.
1,640 married couples with children.
1,201 single-parent households (242 men, 959 women).
89.7% of residents of Mount Dora speak English at home.
9.2% of residents speak Spanish at home (47% speak English very well, 18% speak English well, 11% speak English not well, 24% don't speak English at all).
1.3% of residents speak other Indo-European language at home (53% speak English very well, 36% speak English well, 12% speak English not well).
0.2% of residents speak Asian or Pacific Island language at home (100% speak English very well).
Foreign born population: 1,304 (7.5%)
(65.1% of them are naturalized citizens)
| Here: | 6.2 |
| State: | 5.9 |
| Here: | 4.0 |
| State: | 4.2 |
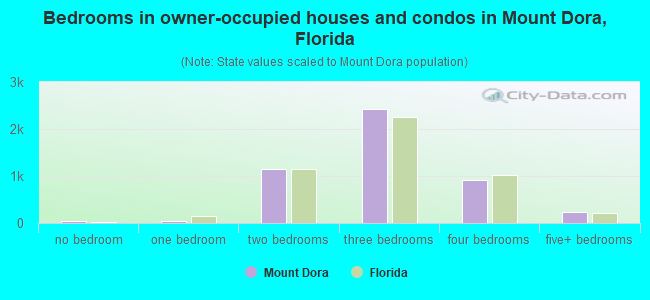
- Bedrooms in owner-occupied houses and condos in Mount Dora, Florida
- 40no bedroom
- 481 bedroom
- 1,1492 bedrooms
- 2,4233 bedrooms
- 9084 bedrooms
- 2295+ bedrooms
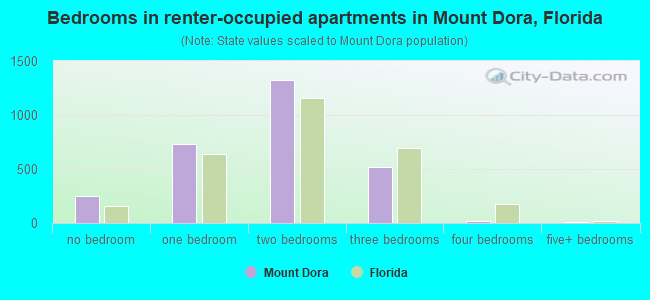
- Bedrooms in renter-occupied apartments in Mount Dora, Florida
- 247no bedroom
- 7311 bedroom
- 1,3202 bedrooms
- 5223 bedrooms
- 204 bedrooms
- 115+ bedrooms
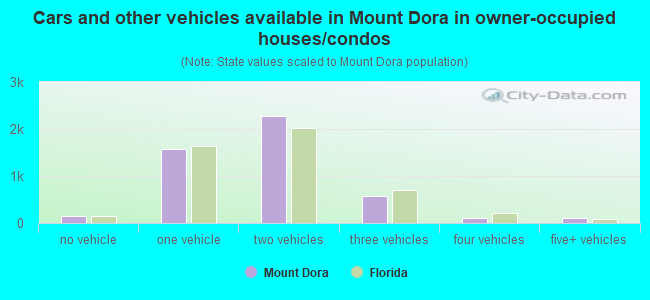
- Cars and other vehicles available in Mount Dora in owner-occupied houses/condos
- 159no vehicle
- 1,5711 vehicle
- 2,2742 vehicles
- 5813 vehicles
- 1004 vehicles
- 1115+ vehicles
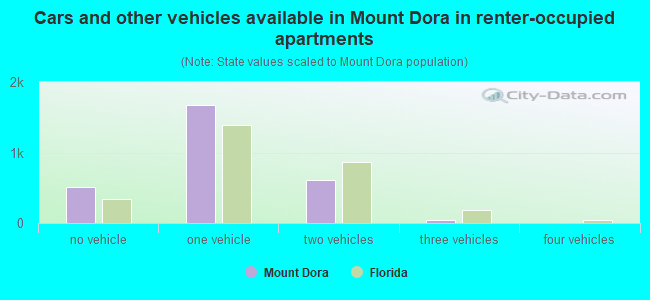
- Cars and other vehicles available in Mount Dora in renter-occupied apartments
- 514no vehicle
- 1,6781 vehicle
- 6122 vehicles
- 463 vehicles
- 04 vehicles
- 05+ vehicles
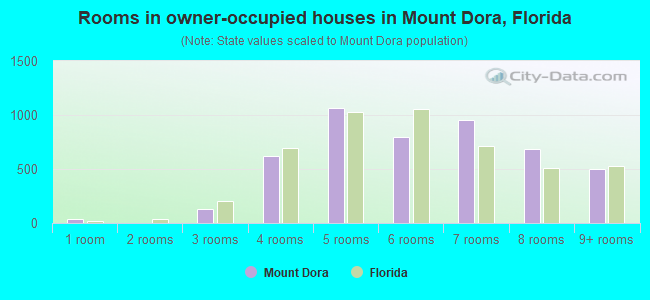
- Rooms in owner-occupied houses in Mount Dora, Florida
- 401 room
- 02 rooms
- 1283 rooms
- 6204 rooms
- 1,0695 rooms
- 7956 rooms
- 9577 rooms
- 6898 rooms
- 4989+ rooms
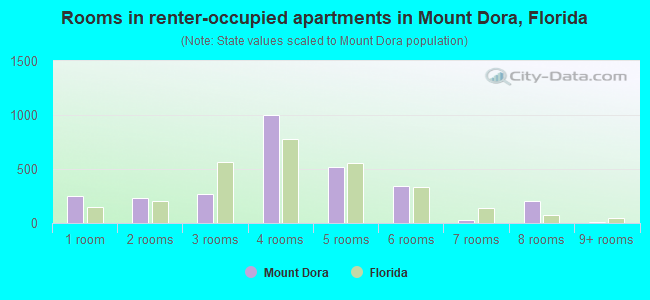
- Rooms in renter-occupied apartments in Mount Dora, Florida
- 2471 room
- 2342 rooms
- 2693 rooms
- 9964 rooms
- 5195 rooms
- 3416 rooms
- 327 rooms
- 2008 rooms
- 119+ rooms
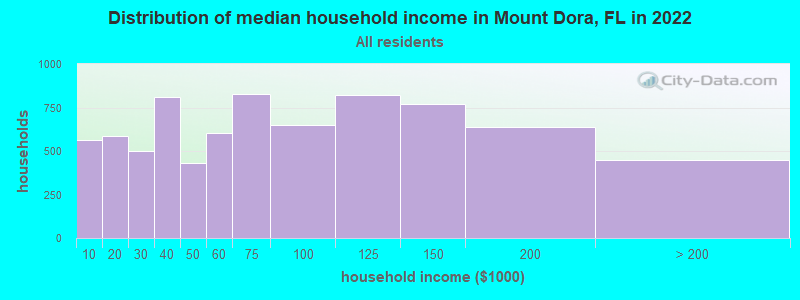
Mount Dora, FL household income distribution

- 565Less than $10,000
- 589$10,000 to $19,999
- 498$20,000 to $29,999
- 812$30,000 to $39,999
- 429$40,000 to $49,999
- 603$50,000 to $59,999
- 828$60,000 to $74,999
- 652$75,000 to $99,999
- 824$100,000 to $124,999
- 770$125,000 to $149,999
- 638$150,000 to $199,999
- 447$200,000 or more
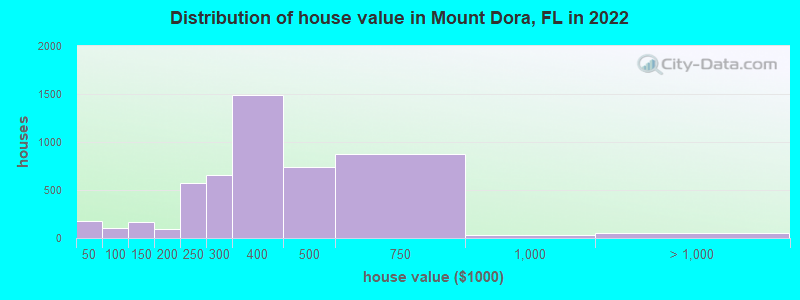
Home value of owner - occupied houses in 2022 in Mount Dora, FL
-
- 49Less than $10,000
- 13$10,000 to $14,999
- 17$15,000 to $19,999
- 24$20,000 to $24,999
- 20$25,000 to $29,999
- 29$35,000 to $39,999
- 19$40,000 to $49,999
- 31$70,000 to $79,999
- 52$90,000 to $99,999
- 70$100,000 to $124,999
- 93$125,000 to $149,999
- 65$150,000 to $174,999
- 28$175,000 to $199,999
- 571$200,000 to $249,999
- 660$250,000 to $299,999
- 1,491$300,000 to $399,999
- 738$400,000 to $499,999
- 875$500,000 to $749,999
- 33$750,000 to $999,999
- 12$1,000,000 to $1,499,999
- 12$1,500,000 to $1,999,999
- 23$2,000,000 or more
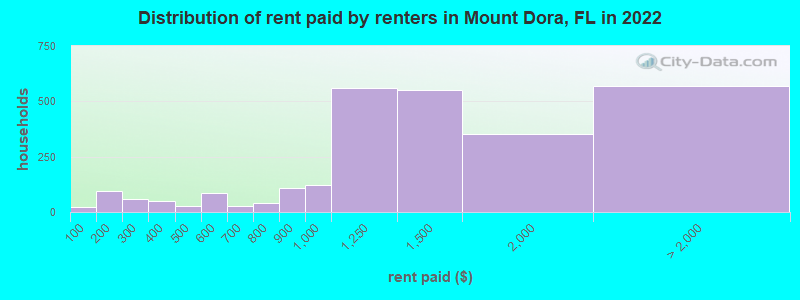
Rent paid by renters in 2022 in Mount Dora, FL
-
- 20Less than $100
- 27$100 to $149
- 67$150 to $199
- 57$250 to $299
- 21$300 to $349
- 26$350 to $399
- 24$450 to $499
- 84$550 to $599
- 12$600 to $649
- 14$650 to $699
- 38$750 to $799
- 107$800 to $899
- 123$900 to $999
- 560$1,000 to $1,249
- 550$1,250 to $1,499
- 350$1,500 to $1,999
- 149$2,000 to $2,499
- 9$2,500 to $2,999
- 107$3,000 to $3,499
- 193$3,500 or more
- 107No cash rent
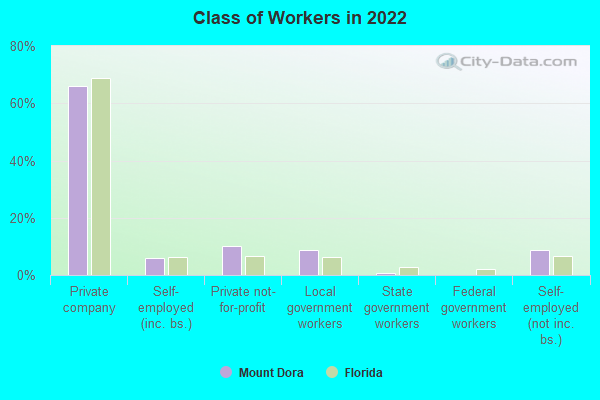
Percentage of workers working in this county: 62.2%
Number of people working at home: 1,727 (25.4% of all workers)
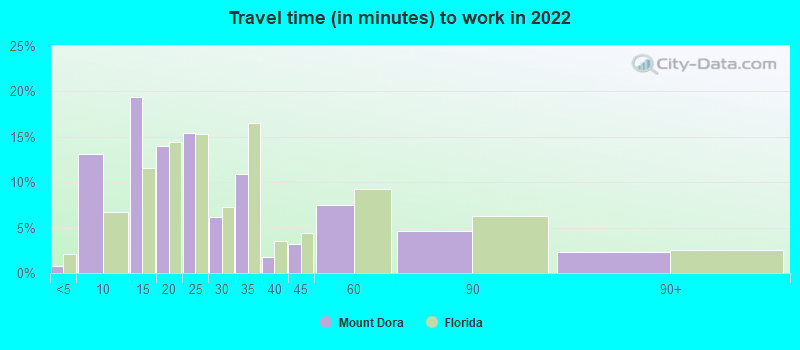
Travel time to work (commute)
- Less than 5 minutes: 59
- 5 to 9 minutes: 348
- 10 to 14 minutes: 828
- 15 to 19 minutes: 739
- 20 to 24 minutes: 485
- 25 to 29 minutes: 586
- 30 to 34 minutes: 314
- 35 to 39 minutes: 399
- 40 to 44 minutes: 301
- 45 to 59 minutes: 787
- 60 to 89 minutes: 318
- 90 or more minutes: 67
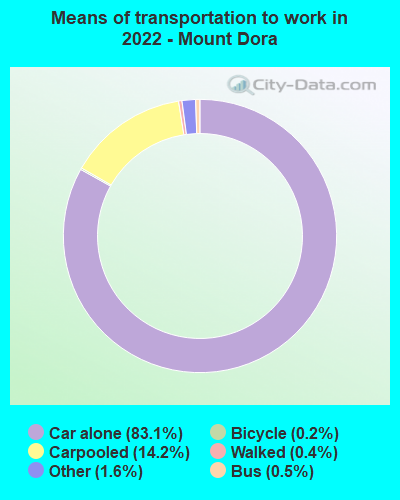
Means of transportation to work:
- Drove a car alone: 5,703 (66.6%)
- Carpooled: 1,038 (12.1%)
- Bus: 31 (0.4%)
- Taxi: 119 (1.4%)
- Bicycle: 14 (0.2%)
- Walked: 32 (0.4%)
- Worked at home: 1,727 (20.2%)
- Unemployment by race in 2022
- Unemployment rate for White non-Hispanic residents
- 2.8%Males
- 4.5%Females
- Unemployment rate for Black residents
- 24.8%Females
- Unemployment rate for Hispanic or Latino residents
- 4.1%Males
- 9.5%Females
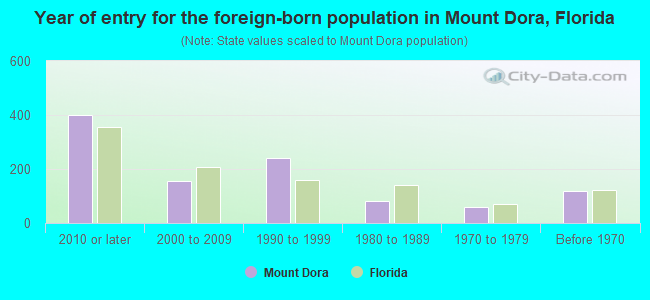
- Year of entry for the foreign-born population in Mount Dora, Florida
- 4012010 or later
- 1552000 to 2009
- 2401990 to 1999
- 811980 to 1989
- 581970 to 1979
- 119Before 1970
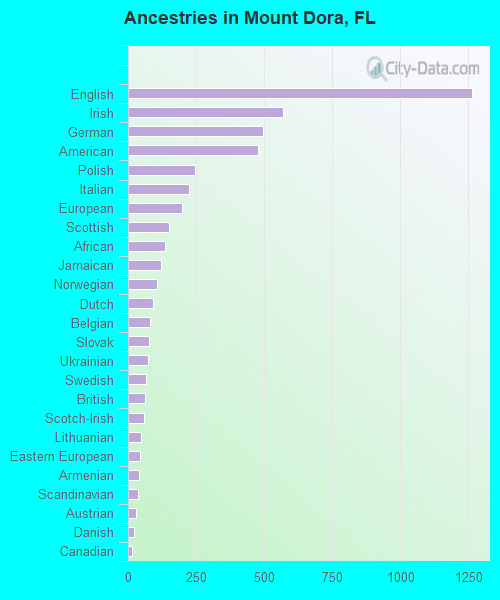
First ancestries reported:
- English: 1,264 (16.6%)
- Irish: 570 (7.5%)
- German: 498 (6.5%)
- American: 478 (6.3%)
- Polish: 245 (3.2%)
- Italian: 224 (2.9%)
- European: 199 (2.6%)
- Scottish: 151 (2.0%)
- African: 137 (1.8%)
- Jamaican: 123 (1.6%)
- Norwegian: 105 (1.4%)
- Dutch: 93 (1.2%)
- Belgian: 80 (1.0%)
- Slovak: 79 (1.0%)
- Ukrainian: 73 (1.0%)
- Swedish: 65 (0.9%)
- British: 63 (0.8%)
- Scotch-Irish: 58 (0.8%)
- Lithuanian: 46 (0.6%)
- Eastern European: 44 (0.6%)
- Armenian: 40 (0.5%)
- Scandinavian: 35 (0.5%)
- Austrian: 29 (0.4%)
- Danish: 21 (0.3%)
- Canadian: 16 (0.2%)
- Albanian: 14 (0.2%)
- Northern European: 11 (0.1%)
- Pennsylvania German: 10 (0.1%)
- French Canadian: 7 (0.09%)
- Czech: 7 (0.09%)
- Guyanese: 7 (0.09%)
- French: 6 (0.08%)
- Portuguese: 6 (0.08%)
- U.S. Virgin Islander: 6 (0.08%)
Most common places of birth for foreign-born residents (%):
| Mount Dora: | 30.3% (423) |
| Florida: | 5.7% (262,042) |
| Mount Dora: | 12.6% (175) |
| Florida: | 22.0% (1,006,576) |
| Mount Dora: | 9.0% (126) |
| Florida: | 5.0% (227,319) |
| Mount Dora: | 6.7% (93) |
| Florida: | 7.5% (342,375) |
| Mount Dora: | 6.2% (87) |
| Florida: | 2.1% (97,632) |
| Mount Dora: | 5.2% (73) |
| Florida: | 2.4% (109,132) |
| Mount Dora: | 4.4% (61) |
| Florida: | 6.5% (298,669) |
| Mount Dora: | 3.0% (42) |
| Florida: | 3.0% (137,727) |
| Mount Dora: | 2.8% (39) |
| Florida: | 0.2% (9,990) |
| Mount Dora: | 2.8% (39) |
| Florida: | 0.2% (10,425) |
| Mount Dora: | 2.4% (33) |
| Florida: | 0.7% (33,556) |
| Mount Dora: | 2.2% (31) |
| Florida: | 0.8% (37,723) |
| Mount Dora: | 2.2% (31) |
| Florida: | 0.2% (6,883) |
| Mount Dora: | 1.9% (27) |
| Florida: | 0.3% (12,303) |
| Mount Dora: | 1.9% (26) |
| Florida: | 1.2% (54,272) |
Place of birth for U.S.-born residents:
- This state: 6,939
- Other state: 8,322
- Northeast: 3,109
- Midwest: 1,994
- South: 1,920
- West: 1,396
92.8% of Mount Dora residents lived in the same house 1 years ago.
Out of people who lived in different houses, 27.3% lived in this county.
Out of people who lived in different counties, 58.1% lived in Florida.
| Mount Dora: | 92.8% |
| State average: | 86.3% |
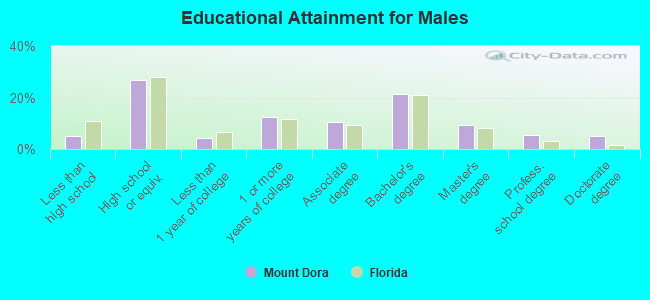
Education attainment for males 25 years and older:
- No schooling: 17
- Nursery to 4th grade: 6
- 5th and 6th grade: 0
- 7th and 8th grade: 0
- 9th grade: 7
- 10th grade: 88
- 11th grade: 81
- 12th grade, no diploma: 106
- High school graduate (or equivalency): 1,588
- Less than 1 year of college: 256
- Some college more than 1 year, no degree: 746
- Associate degree: 622
- Bachelor's degree: 1,267
- Master's degree: 558
- Professional school degree: 334
- Doctorate degree: 292
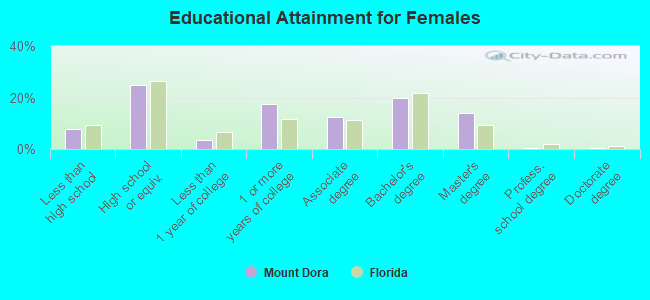
Education attainment for females 25 years and older:
- No schooling: 30
- Nursery to 4th grade: 0
- 5th and 6th grade: 18
- 7th and 8th grade: 20
- 9th grade: 8
- 10th grade: 50
- 11th grade: 230
- 12th grade, no diploma: 206
- High school graduate (or equivalency): 1,813
- Less than 1 year of college: 244
- Some college more than 1 year, no degree: 1,259
- Associate degree: 893
- Bachelor's degree: 1,434
- Master's degree: 1,003
- Professional school degree: 24
- Doctorate degree: 21


Housing units in structures:
- One, detached: 5,287
- One, attached: 573
- Two: 303
- 3 or 4: 460
- 5 to 9: 491
- 10 to 19: 669
- 20 to 49: 168
- 50 or more: 335
- Mobile homes: 122
Housing units lacking complete kitchen facilities in 2022: 2.9%
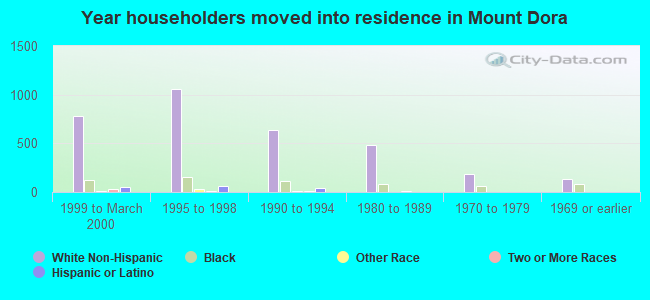
House/condo owner moved in on average 7 years ago
Renter moved in on average 2 years ago
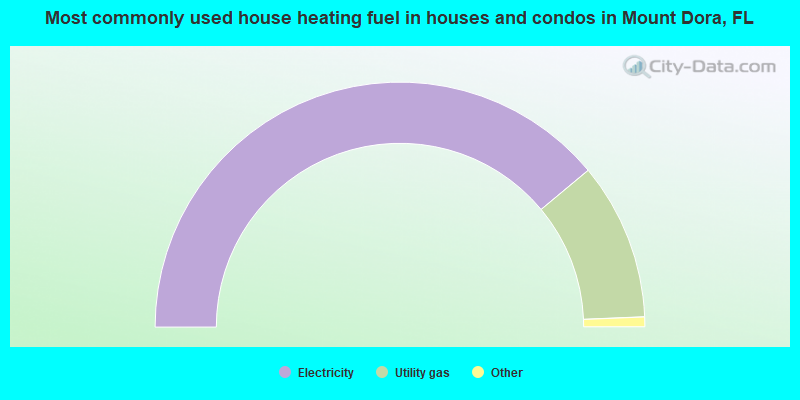
- 77.9%Electricity
- 20.8%Utility gas
- 0.7%Bottled, tank, or LP gas
- 0.5%Fuel oil, kerosene, etc.
- 0.2%Solar energy
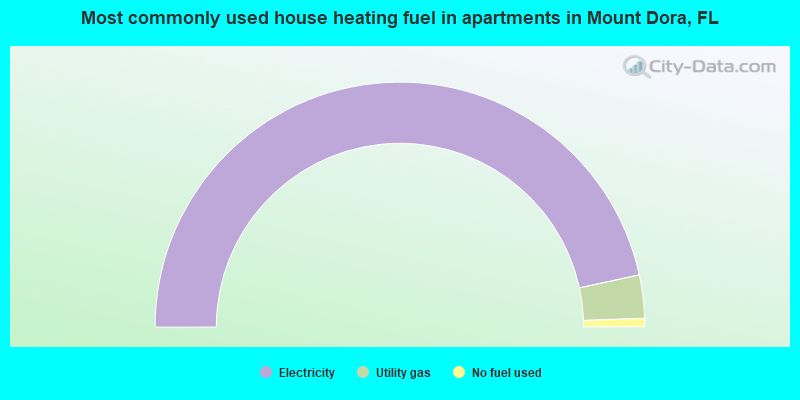
- 93.2%Electricity
- 5.7%Utility gas
- 1.1%No fuel used
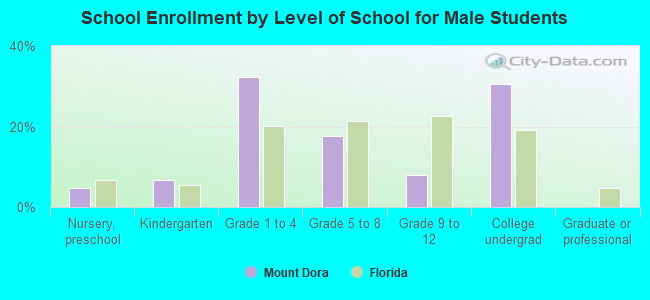
Private vs. public school enrollment:
| Here: | 13.7% |
| Florida: | 15.8% |
| Here: | 0.0% |
| Florida: | 12.9% |
| Here: | 35.5% |
| Florida: | 23.6% |