Races in Mount Dora, Florida (FL) Detailed Stats
Data:
Races - White alone (%)
Races - White alone (% change since 2000)
Races - Black alone (%)
Races - Black alone (% change since 2000)
Races - American Indian alone (%)
Races - American Indian alone (% change since 2000)
Races - Asian alone (%)
Races - Asian alone (% change since 2000)
Races - Hispanic (%)
Races - Hispanic (% change since 2000)
Races - Native Hawaiian and Other Pacific Islander alone (%)
Races - Native Hawaiian and Other Pacific Islander alone (% change since 2000)
Races - Two or more races(%)
Races - Two or more races(% change since 2000)
Races - Other race alone (%)
Races - Other race alone (% change since 2000)
Racial diversity
Place of birth - Born in state of residence (%)
Place of birth - Born in state of residence (%) - White
Place of birth - Born in state of residence (%) - Black or African American
Place of birth - Born in state of residence (%) - Asian
Place of birth - Born in state of residence (%) - Hispanic or Latino
Place of birth - Born in state of residence (%) - American Indian and Alaska Native
Place of birth - Born in state of residence (%) - Multirace
Place of birth - Born in state of residence (%) - Other Race
Place of birth - Born in other state (%)
Place of birth - Born in other state (%) - White
Place of birth - Born in other state (%) - Black or African American
Place of birth - Born in other state (%) - Asian
Place of birth - Born in other state (%) - Hispanic or Latino
Place of birth - Born in other state (%) - American Indian and Alaska Native
Place of birth - Born in other state (%) - Multirace
Place of birth - Born in other state (%) - Other Race
Place of birth - Native, outside of US (%)
Place of birth - Native, outside of US (%) - White
Place of birth - Native, outside of US (%) - Black or African American
Place of birth - Native, outside of US (%) - Asian
Place of birth - Native, outside of US (%) - Hispanic or Latino
Place of birth - Native, outside of US (%) - American Indian and Alaska Native
Place of birth - Native, outside of US (%) - Multirace
Place of birth - Native, outside of US (%) - Other Race
Place of birth - Foreign born (%)
Place of birth - Foreign born (%) - White
Place of birth - Foreign born (%) - Black or African American
Place of birth - Foreign born (%) - Asian
Place of birth - Foreign born (%) - Hispanic or Latino
Place of birth - Foreign born (%) - American Indian and Alaska Native
Place of birth - Foreign born (%) - Multirace
Place of birth - Foreign born (%) - Other Race
Residents speaking English at home (%)
Residents speaking English at home - Born in the United States (%)
Residents speaking English at home - Native, born elsewhere (%)
Residents speaking English at home - Foreign born (%)
Residents speaking Spanish at home (%)
Residents speaking Spanish at home - Born in the United States (%)
Residents speaking Spanish at home - Native, born elsewhere (%)
Residents speaking Spanish at home - Foreign born (%)
Residents speaking other language at home (%)
Residents speaking other language at home - Born in the United States (%)
Residents speaking other language at home - Native, born elsewhere (%)
Residents speaking other language at home - Foreign born (%)
Marital status - Never married (%)
Marital status - Now married (%)
Marital status - Separated (%)
Marital status - Widowed (%)
Marital status - Divorced (%)
Ancestries Reported - Arab (%)
Ancestries Reported - Czech (%)
Ancestries Reported - Danish (%)
Ancestries Reported - Dutch (%)
Ancestries Reported - English (%)
Ancestries Reported - French (%)
Ancestries Reported - French Canadian (%)
Ancestries Reported - German (%)
Ancestries Reported - Greek (%)
Ancestries Reported - Hungarian (%)
Ancestries Reported - Irish (%)
Ancestries Reported - Italian (%)
Ancestries Reported - Lithuanian (%)
Ancestries Reported - Norwegian (%)
Ancestries Reported - Polish (%)
Ancestries Reported - Portuguese (%)
Ancestries Reported - Russian (%)
Ancestries Reported - Scotch-Irish (%)
Ancestries Reported - Scottish (%)
Ancestries Reported - Slovak (%)
Ancestries Reported - Subsaharan African (%)
Ancestries Reported - Swedish (%)
Ancestries Reported - Swiss (%)
Ancestries Reported - Ukrainian (%)
Ancestries Reported - United States (%)
Ancestries Reported - Welsh (%)
Ancestries Reported - West Indian (%)
Ancestries Reported - Other (%)
Geographical mobility - Same house 1 year ago (%)
Geographical mobility - Same house 1 year ago (%) - White
Geographical mobility - Same house 1 year ago (%) - Black or African American
Geographical mobility - Same house 1 year ago (%) - Asian
Geographical mobility - Same house 1 year ago (%) - Hispanic or Latino
Geographical mobility - Same house 1 year ago (%) - American Indian and Alaska Native
Geographical mobility - Same house 1 year ago (%) - Multirace
Geographical mobility - Same house 1 year ago (%) - Other Race
Geographical mobility - Moved within same county (%)
Geographical mobility - Moved within same county (%) - White
Geographical mobility - Moved within same county (%) - Black or African American
Geographical mobility - Moved within same county (%) - Asian
Geographical mobility - Moved within same county (%) - Hispanic or Latino
Geographical mobility - Moved within same county (%) - American Indian and Alaska Native
Geographical mobility - Moved within same county (%) - Multirace
Geographical mobility - Moved within same county (%) - Other Race
Geographical mobility - Moved from different county within same state (%)
Geographical mobility - Moved from different county within same state (%) - White
Geographical mobility - Moved from different county within same state (%) - Black or African American
Geographical mobility - Moved from different county within same state (%) - Asian
Geographical mobility - Moved from different county within same state (%) - Hispanic or Latino
Geographical mobility - Moved from different county within same state (%) - American Indian and Alaska Native
Geographical mobility - Moved from different county within same state (%) - Multirace
Geographical mobility - Moved from different county within same state (%) - Other Race
Geographical mobility - Moved from different state (%)
Geographical mobility - Moved from different state (%) - White
Geographical mobility - Moved from different state (%) - Black or African American
Geographical mobility - Moved from different state (%) - Asian
Geographical mobility - Moved from different state (%) - Hispanic or Latino
Geographical mobility - Moved from different state (%) - American Indian and Alaska Native
Geographical mobility - Moved from different state (%) - Multirace
Geographical mobility - Moved from different state (%) - Other Race
Geographical mobility - Moved from abroad (%)
Geographical mobility - Moved from abroad (%) - White
Geographical mobility - Moved from abroad (%) - Black or African American
Geographical mobility - Moved from abroad (%) - Asian
Geographical mobility - Moved from abroad (%) - Hispanic or Latino
Geographical mobility - Moved from abroad (%) - American Indian and Alaska Native
Geographical mobility - Moved from abroad (%) - Multirace
Geographical mobility - Moved from abroad (%) - Other Race
Place of birth for the foreign-born population - Ireland (%)
Place of birth for the foreign-born population - Denmark (%)
Place of birth for the foreign-born population - Norway (%)
Place of birth for the foreign-born population - Sweden (%)
Place of birth for the foreign-born population - United Kingdom (%)
Place of birth for the foreign-born population - England (%)
Place of birth for the foreign-born population - Scotland (%)
Place of birth for the foreign-born population - Other Northern Europe (%)
Place of birth for the foreign-born population - Austria (%)
Place of birth for the foreign-born population - Belgium (%)
Place of birth for the foreign-born population - France (%)
Place of birth for the foreign-born population - Germany (%)
Place of birth for the foreign-born population - Netherlands (%)
Place of birth for the foreign-born population - Switzerland (%)
Place of birth for the foreign-born population - Other Western Europe (%)
Place of birth for the foreign-born population - Greece (%)
Place of birth for the foreign-born population - Italy (%)
Place of birth for the foreign-born population - Portugal (%)
Place of birth for the foreign-born population - Spain (%)
Place of birth for the foreign-born population - Other Southern Europe (%)
Place of birth for the foreign-born population - Albania (%)
Place of birth for the foreign-born population - Belarus (%)
Place of birth for the foreign-born population - Bosnia and Herzegovina (%)
Place of birth for the foreign-born population - Bulgaria (%)
Place of birth for the foreign-born population - Croatia (%)
Place of birth for the foreign-born population - Czechoslovakia (%)
Place of birth for the foreign-born population - Hungary (%)
Place of birth for the foreign-born population - Latvia (%)
Place of birth for the foreign-born population - Lithuania (%)
Place of birth for the foreign-born population - North Macedonia (Macedonia) (%)
Place of birth for the foreign-born population - Moldova (%)
Place of birth for the foreign-born population - Poland (%)
Place of birth for the foreign-born population - Romania (%)
Place of birth for the foreign-born population - Russia (%)
Place of birth for the foreign-born population - Serbia (%)
Place of birth for the foreign-born population - Ukraine (%)
Place of birth for the foreign-born population - Other Eastern Europe (%)
Place of birth for the foreign-born population - China (%)
Place of birth for the foreign-born population - Hong Kong (%)
Place of birth for the foreign-born population - Taiwan (%)
Place of birth for the foreign-born population - Japan (%)
Place of birth for the foreign-born population - Korea (%)
Place of birth for the foreign-born population - Other Eastern Asia (%)
Place of birth for the foreign-born population - Afghanistan (%)
Place of birth for the foreign-born population - Bangladesh (%)
Place of birth for the foreign-born population - India (%)
Place of birth for the foreign-born population - Iran (%)
Place of birth for the foreign-born population - Kazakhstan (%)
Place of birth for the foreign-born population - Nepal (%)
Place of birth for the foreign-born population - Pakistan (%)
Place of birth for the foreign-born population - Sri Lanka (%)
Place of birth for the foreign-born population - Uzbekistan (%)
Place of birth for the foreign-born population - Other South Central Asia (%)
Place of birth for the foreign-born population - Burma (%)
Place of birth for the foreign-born population - Cambodia (%)
Place of birth for the foreign-born population - Indonesia (%)
Place of birth for the foreign-born population - Laos (%)
Place of birth for the foreign-born population - Malaysia (%)
Place of birth for the foreign-born population - Philippines (%)
Place of birth for the foreign-born population - Singapore (%)
Place of birth for the foreign-born population - Thailand (%)
Place of birth for the foreign-born population - Vietnam (%)
Place of birth for the foreign-born population - Other South Eastern Asia (%)
Place of birth for the foreign-born population - Armenia (%)
Place of birth for the foreign-born population - Iraq (%)
Place of birth for the foreign-born population - Israel (%)
Place of birth for the foreign-born population - Jordan (%)
Place of birth for the foreign-born population - Kuwait (%)
Place of birth for the foreign-born population - Lebanon (%)
Place of birth for the foreign-born population - Saudi Arabia (%)
Place of birth for the foreign-born population - Syria (%)
Place of birth for the foreign-born population - Turkey (%)
Place of birth for the foreign-born population - Yemen (%)
Place of birth for the foreign-born population - Other Western Asia (%)
Place of birth for the foreign-born population - Eritrea (%)
Place of birth for the foreign-born population - Ethiopia (%)
Place of birth for the foreign-born population - Kenya (%)
Place of birth for the foreign-born population - Somalia (%)
Place of birth for the foreign-born population - Uganda (%)
Place of birth for the foreign-born population - Zimbabwe (%)
Place of birth for the foreign-born population - Other Eastern Africa (%)
Place of birth for the foreign-born population - Cameroon (%)
Place of birth for the foreign-born population - Congo (%)
Place of birth for the foreign-born population - Democratic Republic of Congo (Zaire) (%)
Place of birth for the foreign-born population - Other Middle Africa (%)
Place of birth for the foreign-born population - Egypt (%)
Place of birth for the foreign-born population - Morocco (%)
Place of birth for the foreign-born population - Sudan (%)
Place of birth for the foreign-born population - Other Northern Africa (%)
Place of birth for the foreign-born population - South Africa (%)
Place of birth for the foreign-born population - Other Southern Africa (%)
Place of birth for the foreign-born population - Cabo Verde (%)
Place of birth for the foreign-born population - Ghana (%)
Place of birth for the foreign-born population - Liberia (%)
Place of birth for the foreign-born population - Nigeria (%)
Place of birth for the foreign-born population - Senegal (%)
Place of birth for the foreign-born population - Sierra Leone (%)
Place of birth for the foreign-born population - Other Western Africa (%)
Place of birth for the foreign-born population - Australia (%)
Place of birth for the foreign-born population - New Zealand (%)
Place of birth for the foreign-born population - Fiji (%)
Place of birth for the foreign-born population - Micronesia (%)
Place of birth for the foreign-born population - Bahamas (%)
Place of birth for the foreign-born population - Barbados (%)
Place of birth for the foreign-born population - Cuba (%)
Place of birth for the foreign-born population - Dominica (%)
Place of birth for the foreign-born population - Dominican Republic (%)
Place of birth for the foreign-born population - Grenada (%)
Place of birth for the foreign-born population - Haiti (%)
Place of birth for the foreign-born population - Jamaica (%)
Place of birth for the foreign-born population - St. Vincent and the Grenadines (%)
Place of birth for the foreign-born population - Trinidad and Tobago (%)
Place of birth for the foreign-born population - West Indies (%)
Place of birth for the foreign-born population - Other Caribbean (%)
Place of birth for the foreign-born population - Belize (%)
Place of birth for the foreign-born population - Costa Rica (%)
Place of birth for the foreign-born population - El Salvador (%)
Place of birth for the foreign-born population - Guatemala (%)
Place of birth for the foreign-born population - Honduras (%)
Place of birth for the foreign-born population - Mexico (%)
Place of birth for the foreign-born population - Nicaragua (%)
Place of birth for the foreign-born population - Panama (%)
Place of birth for the foreign-born population - Other Central America (%)
Place of birth for the foreign-born population - Argentina (%)
Place of birth for the foreign-born population - Bolivia (%)
Place of birth for the foreign-born population - Brazil (%)
Place of birth for the foreign-born population - Chile (%)
Place of birth for the foreign-born population - Colombia (%)
Place of birth for the foreign-born population - Ecuador (%)
Place of birth for the foreign-born population - Guyana (%)
Place of birth for the foreign-born population - Peru (%)
Place of birth for the foreign-born population - Uruguay (%)
Place of birth for the foreign-born population - Venezuela (%)
Place of birth for the foreign-born population - Other South America (%)
Place of birth for the foreign-born population - Canada (%)
Place of birth for the foreign-born population - Other Northern America (%)
Place of birth for the foreign-born population - Other (%)
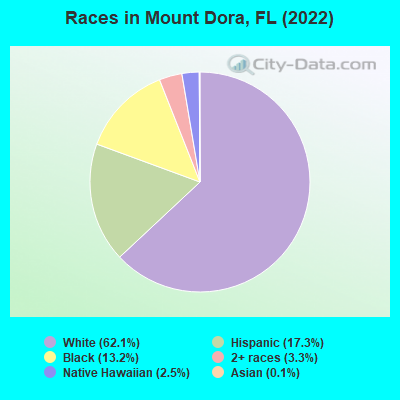
According to 2022 data, the most numerous races in Mount Dora, FL are White alone (10,756 residents), Hispanic (2,996 residents), and Black alone (2,293 residents). 88.1% of Mount Dora residents speak English at home. 8.1% of Mount Dora, FL residents are foreign-born (6.0% born in Latin America, 0.9% born in Europe), which is 160.8% less than the foreign-born rate of 21.0% across the entire state of Florida.
Race distribution in Mount Dora
2000 2022
10,458,509 65.4% White alone 2,682,715 16.8% Hispanic 2,264,268 14.2% Black alone 261,693 1.6% Asian alone 236,954 1.5% Two or more races 42,358 0.3% American Indian alone 28,994 0.2% Other race alone 6,887 0.04% Native Hawaiian and Other
11,309,403 50.8% White alone 6,025,039 27.1% Hispanic 3,241,015 14.6% Black alone 861,630 3.9% Two or more races 623,692 2.8% Asian alone 152,054 0.7% Other race alone 22,504 0.1% American Indian alone 9,486 0.04% Native Hawaiian and Other
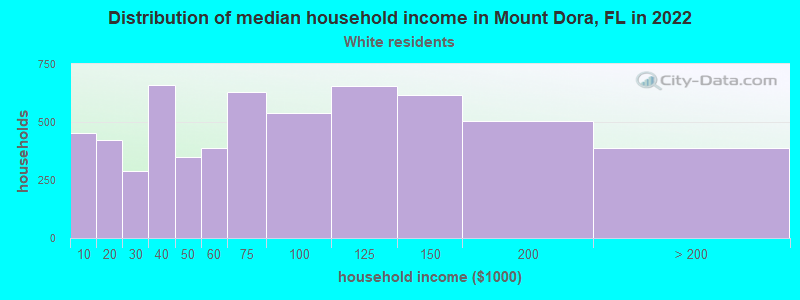
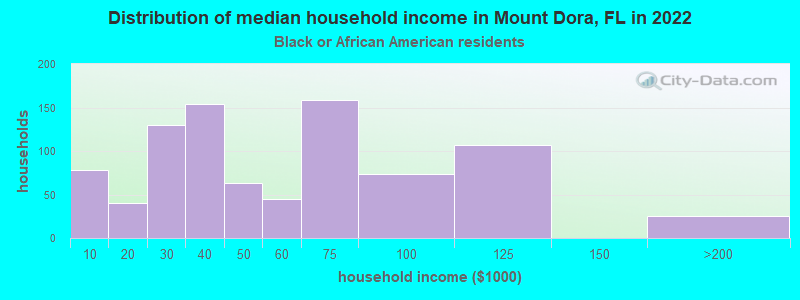
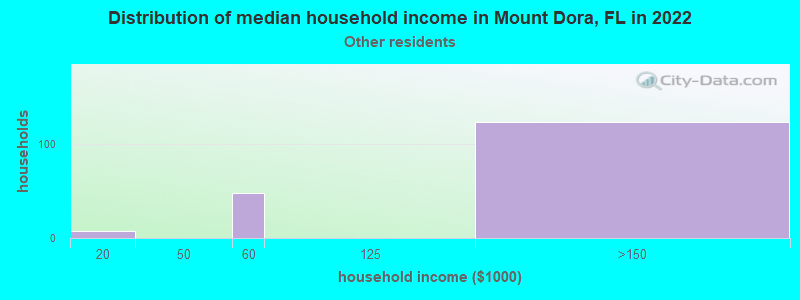
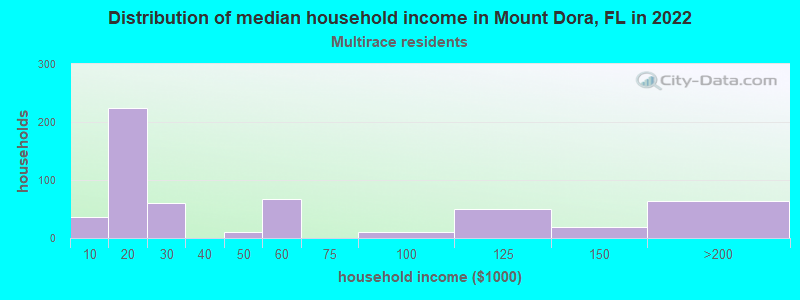
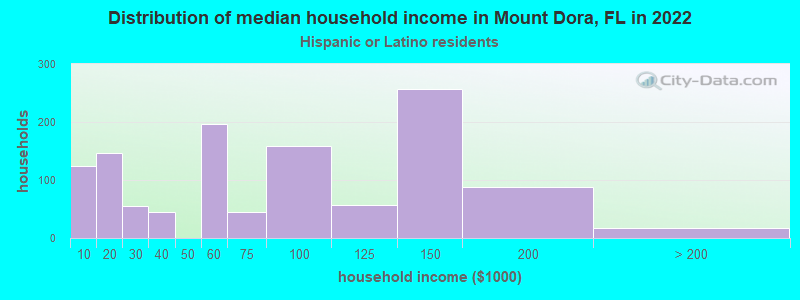
Income and house value in Mount Dora Median household income in 2022 $69,381 White non-Hispanic householders$46,737 Black householders$144,619 Some other race householders$65,018 Hispanic or Latino race householdersMedian 2022 house value $405,074 White Non-Hispanic householders$238,258 Black or African American householders$384,564 American Indian or Alaska Native householders $470,022 Asian householders$153,825 Some other race householders$324,743 Two or more races householders$715,802 Hispanic or Latino householders
Median age by race in Mount Dora
60.4 Median age for White residents55.1 61.8 42.3 Median age for Black or African American residents38.3 41.4 -654,353,561.4 Median age for American Indian / Alaska Native residents-665,012,406.3 -591,194,968.0 -714,840,714.1 Median age for Asian residents-738,211,381.4 -717,948,717.2 21.1 Median age for Native Hawaiian / Pacific Islander residents26.3 -443,298,968.6 31.4 Median age for Other race residents31.8 30.4 20.6 Median age for Two or more races residents30.6 19.6 62.8 Median age for White alone residents58.9 64.5 34.4 Median age for Hispanic or Latino residents35.0 33.9
Owner/renter occupied households by race in Mount Dora
House owners and renters - White residents 3,730 65.2% Owner occupied1,990 34.8% Renter occupiedHouse owners and renters - Black or African American residents 590 61.4% Owner occupied371 38.6% Renter occupiedHouse owners and renters - Asian residents 26 100.0% Owner occupiedHouse owners and renters - Other race residents 121 61.4% Owner occupied76 38.6% Renter occupiedHouse owners and renters - Two or more races residents 237 42.3% Owner occupied324 57.7% Renter occupiedHouse owners and renters - White alone residents 3,602 65.2% Owner occupied1,926 34.8% Renter occupiedHouse owners and renters - Hispanic or Latino residents 482 46.0% Owner occupied566 54.0% Renter occupied
Language usage in Mount Dora
English speakers - Total 88.1% of residents of Mount Dora speak English at home.
9.7% of residents speak Spanish at home 824 51.6% Speak English very well774 48.4% Speak English less than very well1.6% of residents speak other language at home 146 57.3% Speak English very well109 42.7% Speak English less than very well
English speakers - Born in the United States 96.8% of residents of Mount Dora speak English at home.
2.0% of residents speak Spanish at home 96 57.5% Speak English very well71 42.5% Speak English less than very well0.6% of residents speak other language at home 46 100.0% Speak English very well
English speakers - Native, born elsewhere 64.0% of residents of Mount Dora speak English at home.
38.8% of residents speak Spanish at home 234 74.8% Speak English very well79 25.2% Speak English less than very well1.7% of residents speak other language at home 14 100.0% Speak English very well
English speakers - Foreign-born 28.2% of residents of Mount Dora speak English at home.
58.0% of residents speak Spanish at home 276 36.5% Speak English very well481 63.5% Speak English less than very well13.2% of residents speak other language at home 88 50.9% Speak English very well85 49.1% Speak English less than very well
White (Caucasian) - Speak only English Native:
95.3% (10,574)Foreign-born:
61.9% (177)
White (Caucasian) - Speak another language Native:
4.7% (523)Foreign-born:
69.9% (200)
Black or African American - Speak only English Native:
100.0% (2,072)Foreign-born:
88.9% (154)
Other race - Speak another language Native:
4.9% (7)Foreign-born:
100.0% (265)
Two or more races - Speak only English Native:
77.8% (719)Foreign-born:
4.7% (25)
Two or more races - Speak another language Native:
23.8% (220)Foreign-born:
100.0% (537)
White alone - Speak only English Native:
98.8% (10,195)Foreign-born:
71.5% (152)
White alone - Speak another language Native:
1.2% (120)Foreign-born:
27.9% (59)
Hispanic or Latino - Speak only English Native:
55.9% (1,059)Foreign-born:
5.9% (49)
Hispanic or Latino - Speak another language Native:
41.3% (783)Foreign-born:
95.1% (789)
Foreign-born residents in Mount Dora 1,394 residents are foreign born (6.0% Latin America , 0.9% Europe ).
This city:
8.1%Florida:
21.1%
Marital status for residents in Mount Dora Marital status - White (Caucasian) population 15 years and over
Males 19.2% Never married65.0% Now married0.4% Separated3.6% Widowed11.9% DivorcedFemales 16.6% Never married53.2% Now married1.5% Separated12.6% Widowed16.2% DivorcedWomen who gave birth in the past 12 months Now married:
61.9% (69)Unmarried:
38.1% (43)
Women who did not give birth in the past 12 months Now married:
47.5% (877)Unmarried:
52.5% (968)
Marital status - Black or African American population 15 years and over
Males 38.7% Never married47.9% Now married11.0% Separated0.0% Widowed2.3% DivorcedFemales 40.5% Never married33.1% Now married0.0% Separated7.6% Widowed18.7% DivorcedWomen who gave birth in the past 12 months Now married:
0.0% (0)Unmarried:
100.0% (56)
Women who did not give birth in the past 12 months Now married:
39.1% (204)Unmarried:
60.9% (318)
Marital status - Native Hawaiian / Pacific Islander population 15 years and over
Males 50.3% Never married49.7% Now married0.0% Separated0.0% Widowed0.0% DivorcedFemales 100.0% Never married0.0% Now married0.0% Separated0.0% Widowed0.0% DivorcedWomen who did not give birth in the past 12 months Now married:
0.0% (0)Unmarried:
100.0% (111)
Marital status - Other race population 15 years and over
Males 22.8% Never married77.2% Now married0.0% Separated0.0% Widowed0.0% DivorcedFemales 0.0% Never married93.4% Now married0.0% Separated0.0% Widowed6.6% DivorcedWomen who gave birth in the past 12 months Now married:
100.0% (64)Unmarried:
0.0% (0)
Marital status - Two or more races population 15 years and over
Males 51.9% Never married43.2% Now married0.0% Separated2.3% Widowed2.6% DivorcedFemales 50.9% Never married23.6% Now married0.3% Separated1.6% Widowed23.6% DivorcedWomen who did not give birth in the past 12 months Now married:
3.6% (12)Unmarried:
96.4% (308)
Marital status - White alone, not Hispanic / Latino population 15 years and over
Males 18.8% Never married66.3% Now married0.5% Separated4.0% Widowed10.4% DivorcedFemales 16.2% Never married52.0% Now married0.1% Separated13.6% Widowed17.9% DivorcedWomen who gave birth in the past 12 months Now married:
51.6% (49)Unmarried:
48.4% (46)
Women who did not give birth in the past 12 months Now married:
42.6% (693)Unmarried:
57.4% (932)
Marital status - Hispanic or Latino population 15 years and over
Males 32.0% Never married54.4% Now married0.0% Separated0.7% Widowed12.9% DivorcedFemales 29.2% Never married52.9% Now married8.3% Separated1.4% Widowed8.2% DivorcedWomen who gave birth in the past 12 months Now married:
100.0% (60)Unmarried:
0.0% (0)
Women who did not give birth in the past 12 months Now married:
44.8% (291)Unmarried:
55.2% (359)
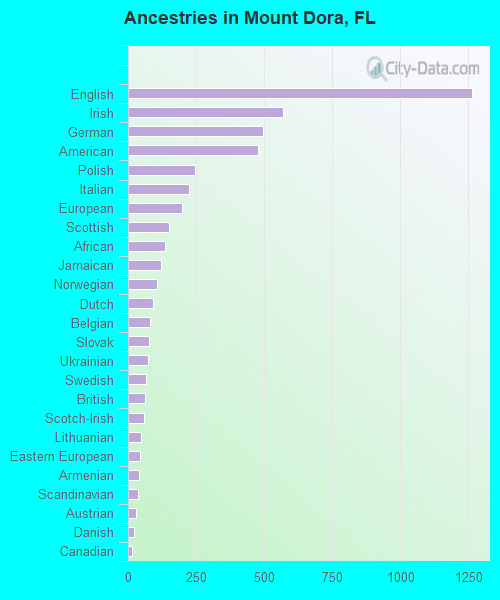
Ancestries in Mount Dora
1,264 16.6% English570 7.5% Irish498 6.5% German478 6.3% American245 3.2% Polish224 2.9% Italian199 2.6% European151 2.0% Scottish137 1.8% African123 1.6% Jamaican105 1.4% Norwegian93 1.2% Dutch80 1.0% Belgian79 1.0% Slovak73 1.0% Ukrainian65 0.9% Swedish63 0.8% British58 0.8% Scotch-Irish46 0.6% Lithuanian44 0.6% Eastern European40 0.5% Armenian35 0.5% Scandinavian29 0.4% Austrian21 0.3% Danish16 0.2% Canadian14 0.2% Albanian11 0.1% Northern European10 0.1% Pennsylvania German7 0.09% French Canadian7 0.09% Czech7 0.09% Guyanese6 0.08% French6 0.08% Portuguese6 0.08% U.S. Virgin Islander
Geographical mobility in Mount Dora Same house 1 year ago 10,817 93.6% White (Caucasian)2,083 92.5% Black or African American23 100.0% Asian421 100.0% Native Hawaiian / Pacific Islander313 62.6% Other race1,556 85.2% Two or more races9,945 92.7% White alone, not Hispanic / Latino2,610 88.7% Hispanic or LatinoMoved within same county 298 2.6% White / Caucasian2 0.1% Black or African American77 4.2% Two or more races319 3.0% White alone, not Hispanic / Latino61 2.1% Hispanic or LatinoMoved within same state 319 2.8% White / Caucasian110 4.9% Black or African American303 2.8% White alone, not Hispanic / Latino42 1.4% Hispanic or LatinoMoved from different state 178 1.5% White / Caucasian163 32.5% Other race35 1.9% Two or more races165 1.5% White alone, not Hispanic / Latino198 6.7% Hispanic or LatinoMoved from abroad 17 0.1% White250 13.7% Two or more races20 0.2% White alone, not Hispanic / Latino241 8.2% Hispanic or Latino
Children Nativity (place of birth) in Mount Dora
Children under 6 years - Living with two parents Both parents native 483 100.0% NativeBoth parents foreign-born 44 100.0% NativeOne native, one foreign-born parent 131 100.0% NativeChildren under 6 years - Living with one parent Native parent 470 100.0% NativeForeign-born parent 71 100.0% NativeChildren 6 to 17 years - Living with two parents Both parents native 998 100.0% NativeOne native, one foreign-born parent 20 100.0% NativeChildren 6 to 17 years - Living with one parent Native parent 800 100.0% NativeForeign-born parent 27 46.1% Native31 53.9% Foreign-born
Grandparents responsible for own grandchildren in Mount Dora
Grandparents (30 to 59 years) Black or African American 7 23.2% Responsible for grandchildren23 76.8% Not responsible for grandchildrenOther race 24 100.0% Not responsible for grandchildrenTwo or more races 34 100.0% Not responsible for grandchildrenHispanic or Latino 38 100.0% Not responsible for grandchildren
Grandparents (60 years and over) Black or African American 1 89.8% Responsible for grandchildrenOther race 22 100.0% Not responsible for grandchildrenHispanic or Latino 20 100.0% Not responsible for grandchildren