Morristown, NJ (New Jersey) Houses and Residents
| Morristown: | $550,814 |
| New Jersey: | $428,900 |
Mean price in 2022:
Detached houses: $622,507
Here: $622,507 State: $537,591 Townhouses or other attached units: $493,771
Here: $493,771 State: $381,113 In 2-unit structures: $290,336
Here: $290,336 State: $444,476 In 3-to-4-unit structures: $470,187
Here: $470,187 State: $457,463 In 5-or-more-unit structures: $426,044
Here: $426,044 State: $368,745
Total population: 19,085 (Urban population: 18,544, Rural population: 0)
Houses: 9,374 (9,013 occupied: 3,390 owner occupied, 5,772 renter occupied)
| % of renters here: | 63% |
| State: | 35% |
Housing density: 3,187 houses/condos per square mile
Median price asked for vacant for-sale houses and condos in 2022: $1,112,956.
Median contract rent in 2022: $1,978 (lower quartile is $1,369, upper quartile is over $2,000)
Median rent asked for vacant for-rent units in 2022: $1,956
Median gross rent in Morristown, NJ in 2022: over $2,000
Housing units in Morristown with a mortgage: 2,557 (175 second mortgage, 0 home equity loan, 176 both second mortgage and home equity loan)
Houses without a mortgage: 43
Median household income for houses/condos with a mortgage: $180,632
Median household income for apartments without a mortgage: $119,657
Median monthly housing costs: $2,195
Compare current foreclosures in Morristown, NJ:
| Photo | Address | Area | Beds / Baths | Price | Details |
|---|---|---|---|---|---|

|
#1
Jersey Ave
Morristown, NJ 07960
|
2,406 sq. feet
|
2 baths 4 beds |
$665,000
|
show details |

|
#2
Kensington Ct
Morristown, NJ 07960
|
4,424 sq. feet
|
6 baths 6 beds |
show details | |

|
#3
Sussex Ave
Morristown, NJ 07960
|
2,367 sq. feet
|
- baths - beds |
show details | |

|
#4
Alexandria Rd
Morristown, NJ 07960
|
2,684 sq. feet
|
- baths - beds |
show details | |

|
#5
Prospect St # 502
Morristown, NJ 07960
|
- sq. feet
|
- baths - beds |
show details | |

|
#6
Burnham Pkwy
Morristown, NJ 07960
|
1,798 sq. feet
|
- baths - beds |
show details | |

|
#7
Franklin St Apt 4e1
Morristown, NJ 07960
|
- sq. feet
|
- baths - beds |
show details | |

|
#8
Netherton Ter
Morristown, NJ 07960
|
2,544 sq. feet
|
- baths - beds |
show details | |

|
#9
Cottonwood Rd
Morristown, NJ 07960
|
2,557 sq. feet
|
- baths - beds |
show details | |

|
#10
Phoenix Ave
Morristown, NJ 07960
|
1,507 sq. feet
|
- baths - beds |
show details |
| Photo | Address | Area | Beds / Baths | Price | Details |
|---|---|---|---|---|---|

|
#11
Chestnut St
Morristown, NJ 07960
|
- sq. feet
|
- baths - beds |
show details | |

|
#12
Speedwell Pl, Units 1 To 5
Morristown, NJ 07960
|
618 sq. feet
|
- baths - beds |
show details | |

|
#13
Harter Rd
Morristown, NJ 07960
|
3,561 sq. feet
|
- baths - beds |
show details | |

|
#14
1/2 Pine St
Morristown, NJ 07960
|
- sq. feet
|
- baths - beds |
show details | |

|
#15
Lake Trl E
Morristown, NJ 07960
|
1,705 sq. feet
|
- baths - beds |
show details | |

|
#16
Piedmont Ct
Morristown, NJ 07960
|
- sq. feet
|
- baths - beds |
show details | |

|
#17
Lake Rd
Morristown, NJ 07960
|
3,825 sq. feet
|
- baths - beds |
show details | |

|
#18
Davenport Pl
Morristown, NJ 07960
|
2,074 sq. feet
|
- baths - beds |
show details | |

|
#19
Ellsworth Ave
Morristown, NJ 07960
|
2,012 sq. feet
|
- baths - beds |
show details | |

|
#20
Arborview Way
Morristown, NJ 07960
|
11,415 sq. feet
|
- baths - beds |
show details |
| Photo | Address | Area | Beds / Baths | Price | Details |
|---|---|---|---|---|---|

|
#21
Spring Valley Rd
Morristown, NJ 07960
|
- sq. feet
|
- baths - beds |
show details | |

|
#22
Gaston Rd
Morristown, NJ 07960
|
3,798 sq. feet
|
- baths - beds |
show details | |

|
#23
Mount Kemble Ave
Morristown, NJ 07960
|
- sq. feet
|
- baths - beds |
show details | |

|
#24
Valley View Dr
Morristown, NJ 07960
|
- sq. feet
|
- baths - beds |
show details | |

|
#25
Morris St
Morristown, NJ 07960
|
- sq. feet
|
- baths - beds |
show details | |

|
#26
Hill St
Morristown, NJ 07960
|
2,422 sq. feet
|
- baths - beds |
show details | |

|
#27
Ford Ave
Morristown, NJ 07960
|
1,264 sq. feet
|
- baths - beds |
show details | |

|
#28
Lafayette Ave Apt 239
Morristown, NJ 07960
|
- sq. feet
|
- baths - beds |
show details | |

|
#29
Village Dr
Morristown, NJ 07960
|
1,266 sq. feet
|
- baths - beds |
show details | |

|
#30
Jones Dr
Morristown, NJ 07960
|
3,254 sq. feet
|
- baths - beds |
show details |
| Photo | Address | Area | Beds / Baths | Price | Details |
|---|---|---|---|---|---|

|
#31
Hillairy Ave
Morristown, NJ 07960
|
3,012 sq. feet
|
- baths - beds |
show details | |

|
#32
Vail Pl
Morristown, NJ 07960
|
1,215 sq. feet
|
- baths - beds |
show details | |

|
#33
Sand Spring Rd
Morristown, NJ 07960
|
- sq. feet
|
- baths - beds |
show details | |

|
#34
Leva Dr
Morristown, NJ 07960
|
733 sq. feet
|
- baths - beds |
show details | |

|
#35
Highland Ave
Morristown, NJ 07960
|
1,680 sq. feet
|
- baths - beds |
show details | |

|
#36
Max Dr Apt 1a
Morristown, NJ 07960
|
- sq. feet
|
- baths - beds |
show details | |

|
#37
Hamilton Rd
Morristown, NJ 07960
|
- sq. feet
|
- baths - beds |
show details | |

|
#38
Martin Luther King Ave
Morristown, NJ 07960
|
2,234 sq. feet
|
- baths - beds |
show details | |

|
#39
Wilson Dr
Morristown, NJ 07960
|
- sq. feet
|
- baths - beds |
show details | |

|
#40
Ridgedale Ave
Morristown, NJ 07960
|
- sq. feet
|
- baths - beds |
show details |
| Photo | Address | Area | Beds / Baths | Price | Details |
|---|---|---|---|---|---|

|
#41
Skyline Dr
Morristown, NJ 07960
|
2,084 sq. feet
|
- baths - beds |
show details | |

|
#42
Normandy Pkwy
Morristown, NJ 07960
|
4,056 sq. feet
|
- baths - beds |
show details | |

|
#43
Witherspoon Ct # 8
Morristown, NJ 07960
|
1,332 sq. feet
|
- baths - beds |
show details | |

|
#44
W Hanover Ave
Morristown, NJ 07960
|
- sq. feet
|
- baths - beds |
show details | |

|
#45
Hancock Dr
Morristown, NJ 07960
|
1,869 sq. feet
|
- baths - beds |
show details | |

|
#46
Jersey Ave
Morristown, NJ 07960
|
2,064 sq. feet
|
- baths - beds |
show details | |

|
#47
Vail Pl
Morristown, NJ 07960
|
1,215 sq. feet
|
- baths - beds |
show details | |

|
#48
Overlook Rd
Morristown, NJ 07960
|
- sq. feet
|
- baths - beds |
show details | |

|
#49
Lake Rd
Morristown, NJ 07960
|
- sq. feet
|
- baths - beds |
show details | |

|
Check over 1 million property listings on Foreclosure.com!
|
browse all offers | |||

Latest news about housing in Morristown, NJ collected exclusively by city-data.com from local newspapers, TV, and radio stations

 | Safe , affordable apartments 30 -45 mins away from Morristown nj (16 replies) |
| East Rutherford/Rutherford Condos vs House? (4 replies) |
| Pet-friendly apartments in Morristown or Madison (9 replies) |
| New to NJ, need help to find rental apartments!!! (7 replies) |
| Somerville, Morristown, Boonton (9 replies) |
| Real Estate bubble? Morristown and vicinity (12 replies) |

Median year apartment built: 1971
Household type by relationship:
Households: 20,218- Male householders: 4,381 (1,730 living alone), Female householders: 4,609 (1,621 living alone)
2,833 spouses (2,802 opposite-sex spouses), 1,093 unmarried partners, (1,006 opposite-sex unmarried partners), 4,697 children (4,366 natural, 42 adopted, 288 stepchildren), 148 grandchildren, 149 brothers or sisters, 119 parents, 0 foster children, 180 other relatives, 1,512 non-relatives
- In group quarters: 491
Size of family households: 1,867 2-persons, 1,357 3-persons, 633 4-persons, 172 5-persons, 210 6-persons, 56 7-or-more-persons.
Size of nonfamily households: 3,239 1-person, 1,496 2-persons, 179 3-persons, 23 4-persons.
1,910 married couples with children.
812 single-parent households (29 men, 783 women).
67.2% of residents of Morristown speak English at home.
22.9% of residents speak Spanish at home (44% speak English very well, 20% speak English well, 32% speak English not well, 4% don't speak English at all).
6.0% of residents speak other Indo-European language at home (68% speak English very well, 11% speak English well, 21% speak English not well).
2.6% of residents speak Asian or Pacific Island language at home (84% speak English very well, 13% speak English well, 3% speak English not well).
1.3% of residents speak other language at home (54% speak English very well, 46% speak English well).
Foreign born population: 4,173 (20.6%)
(39.1% of them are naturalized citizens)
| Here: | 6.2 |
| State: | 6.8 |
| Here: | 3.2 |
| State: | 3.9 |

- Bedrooms in owner-occupied houses and condos in Morristown, New Jersey
- 16no bedroom
- 1401 bedroom
- 9822 bedrooms
- 1,1963 bedrooms
- 7524 bedrooms
- 3045+ bedrooms

- Bedrooms in renter-occupied apartments in Morristown, New Jersey
- 479no bedroom
- 2,4291 bedroom
- 2,0882 bedrooms
- 6143 bedrooms
- 1324 bedrooms
- 315+ bedrooms

- Cars and other vehicles available in Morristown in owner-occupied houses/condos
- 52no vehicle
- 1,0471 vehicle
- 1,5872 vehicles
- 5333 vehicles
- 1704 vehicles
- 05+ vehicles

- Cars and other vehicles available in Morristown in renter-occupied apartments
- 813no vehicle
- 3,0401 vehicle
- 1,4472 vehicles
- 3633 vehicles
- 794 vehicles
- 315+ vehicles

- Rooms in owner-occupied houses in Morristown, New Jersey
- 01 room
- 522 rooms
- 1553 rooms
- 3094 rooms
- 5495 rooms
- 7256 rooms
- 4037 rooms
- 4578 rooms
- 7409+ rooms

- Rooms in renter-occupied apartments in Morristown, New Jersey
- 4211 room
- 6122 rooms
- 1,9603 rooms
- 1,4464 rooms
- 6075 rooms
- 3316 rooms
- 2657 rooms
- 938 rooms
- 389+ rooms


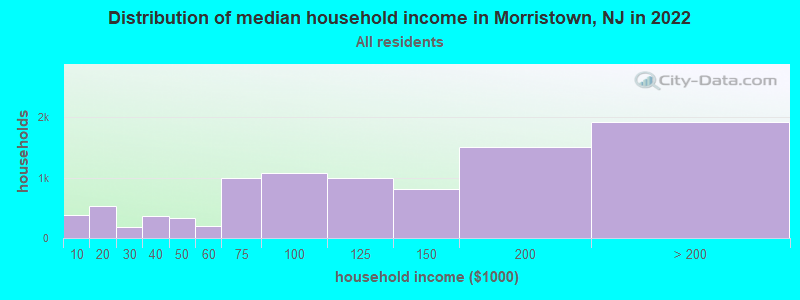
Morristown, NJ household income distribution

- 383Less than $10,000
- 532$10,000 to $19,999
- 187$20,000 to $29,999
- 363$30,000 to $39,999
- 330$40,000 to $49,999
- 195$50,000 to $59,999
- 990$60,000 to $74,999
- 1,072$75,000 to $99,999
- 999$100,000 to $124,999
- 805$125,000 to $149,999
- 1,498$150,000 to $199,999
- 1,918$200,000 or more
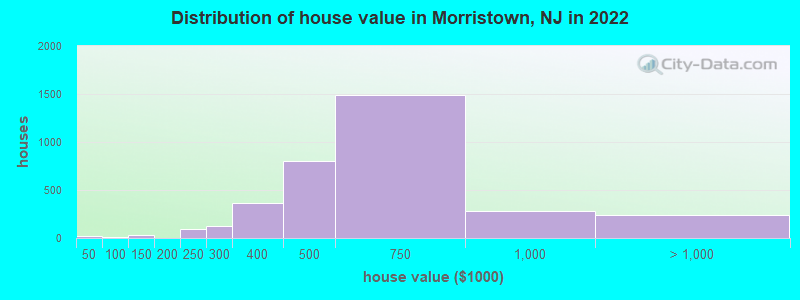
Home value of owner - occupied houses in 2022 in Morristown, NJ
-
- 16$20,000 to $24,999
- 13$50,000 to $59,999
- 32$100,000 to $124,999
- 90$200,000 to $249,999
- 128$250,000 to $299,999
- 359$300,000 to $399,999
- 799$400,000 to $499,999
- 1,484$500,000 to $749,999
- 283$750,000 to $999,999
- 212$1,000,000 to $1,499,999
- 23$1,500,000 to $1,999,999
Rent paid by renters in 2022 in Morristown, NJ
-
- 10Less than $100
- 172$100 to $149
- 27$150 to $199
- 157$200 to $249
- 243$250 to $299
- 59$300 to $349
- 26$400 to $449
- 7$600 to $649
- 24$650 to $699
- 22$700 to $749
- 28$750 to $799
- 32$800 to $899
- 144$900 to $999
- 426$1,000 to $1,249
- 413$1,250 to $1,499
- 1,137$1,500 to $1,999
- 937$2,000 to $2,499
- 793$2,500 to $2,999
- 507$3,000 to $3,499
- 184$3,500 or more
- 54No cash rent


Percentage of workers working in this county: 79.4%
Number of people working at home: 2,558 (20.3% of all workers)
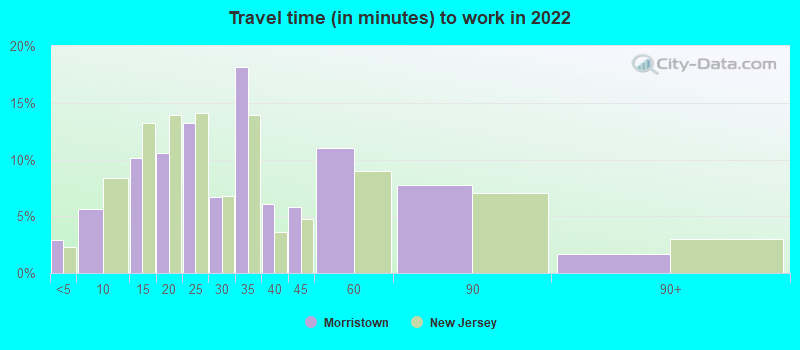
Travel time to work (commute)
- Less than 5 minutes: 502
- 5 to 9 minutes: 919
- 10 to 14 minutes: 2,040
- 15 to 19 minutes: 1,979
- 20 to 24 minutes: 1,215
- 25 to 29 minutes: 504
- 30 to 34 minutes: 1,364
- 35 to 39 minutes: 239
- 40 to 44 minutes: 232
- 45 to 59 minutes: 609
- 60 to 89 minutes: 445
- 90 or more minutes: 84
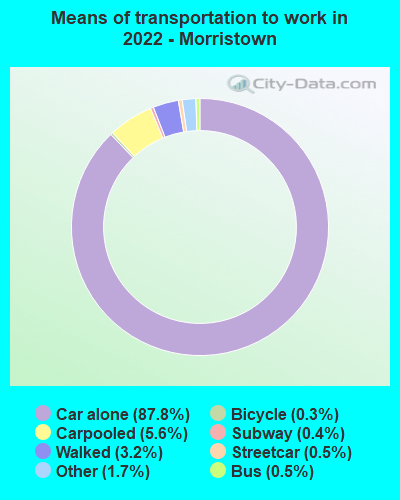
Means of transportation to work:
- Drove a car alone: 19,251 (75.0%)
- Carpooled: 1,243 (4.8%)
- Bus: 112 (0.4%)
- Subway or elevated rail: 85 (0.3%)
- Long-distance train or commuter rail: 117 (0.5%)
- Taxi: 484 (1.9%)
- Bicycle: 54 (0.2%)
- Walked: 956 (3.7%)
- Worked at home: 2,558 (10.0%)

- Unemployment by race in 2022
- Unemployment rate for White non-Hispanic residents
- 2.4%Males
- 2.2%Females
- Unemployment rate for Black residents
- 6.5%Males
- 13.9%Females
- Unemployment rate for other race residents
- 5.5%Males
- Unemployment rate for two or more race residents
- 4.5%Males
- 2.5%Females
- Unemployment rate for Hispanic or Latino residents
- 1.3%Males
- 3.0%Females

- Year of entry for the foreign-born population in Morristown, New Jersey
- 1,4482010 or later
- 7982000 to 2009
- 4611990 to 1999
- 1,2201980 to 1989
- 5411970 to 1979
- 470Before 1970

First ancestries reported:
- Irish: 990 (9.2%)
- Italian: 881 (8.2%)
- English: 287 (2.7%)
- American: 262 (2.4%)
- German: 230 (2.1%)
- Haitian: 207 (1.9%)
- Polish: 206 (1.9%)
- Romanian: 164 (1.5%)
- Portuguese: 158 (1.5%)
- European: 110 (1.0%)
- Russian: 104 (1.0%)
- British: 67 (0.6%)
- Dutch: 55 (0.5%)
- Hungarian: 53 (0.5%)
- Egyptian: 51 (0.5%)
- Scottish: 47 (0.4%)
- Eastern European: 46 (0.4%)
- Greek: 46 (0.4%)
- Jamaican: 42 (0.4%)
- Austrian: 34 (0.3%)
- Canadian: 25 (0.2%)
- Kenyan: 24 (0.2%)
- African: 24 (0.2%)
- Lebanese: 20 (0.2%)
- Trinidadian and Tobagonian: 20 (0.2%)
- Jordanian: 15 (0.1%)
- Cajun: 13 (0.1%)
- Scotch-Irish: 13 (0.1%)
- French Canadian: 11 (0.1%)
- Northern European: 9 (0.08%)
Most common places of birth for foreign-born residents (%):
| Morristown: | 17.1% (739) |
| New Jersey: | 1.7% (37,335) |
| Morristown: | 11.1% (481) |
| New Jersey: | 2.3% (48,885) |
| Morristown: | 9.9% (427) |
| New Jersey: | 4.2% (90,817) |
| Morristown: | 7.3% (314) |
| New Jersey: | 0.7% (14,848) |
| Morristown: | 5.4% (234) |
| New Jersey: | 12.8% (274,609) |
| Morristown: | 5.1% (222) |
| New Jersey: | 4.4% (95,275) |
| Morristown: | 4.4% (189) |
| New Jersey: | 0.5% (10,246) |
| Morristown: | 4.2% (180) |
| New Jersey: | 4.8% (102,527) |
| Morristown: | 3.5% (150) |
| New Jersey: | 2.3% (49,491) |
| Morristown: | 2.6% (113) |
| New Jersey: | 0.7% (15,533) |
| Morristown: | 2.3% (99) |
| New Jersey: | 4.0% (85,934) |
| Morristown: | 2.3% (98) |
| New Jersey: | 0.6% (12,793) |
| Morristown: | 1.9% (84) |
| New Jersey: | 0.9% (20,371) |
| Morristown: | 1.9% (81) |
| New Jersey: | 0.5% (10,886) |
| Morristown: | 1.7% (74) |
| New Jersey: | 9.7% (209,055) |
| Morristown: | 1.6% (69) |
| New Jersey: | 2.7% (58,563) |
| Morristown: | 1.5% (66) |
| New Jersey: | 0.3% (6,033) |
| Morristown: | 1.5% (66) |
| New Jersey: | 1.6% (33,678) |
Place of birth for U.S.-born residents:
- This state: 9,972
- Other state: 5,427
- Northeast: 3,319
- Midwest: 807
- South: 939
- West: 342
81.0% of Morristown residents lived in the same house 1 years ago.
Out of people who lived in different houses, 28.7% lived in this county.
Out of people who lived in different counties, 80.0% lived in New Jersey.
| Morristown: | 81.0% |
| State average: | 90.4% |
Education attainment for males 25 years and older:
- No schooling: 27
- Nursery to 4th grade: 84
- 5th and 6th grade: 77
- 7th and 8th grade: 34
- 9th grade: 112
- 10th grade: 41
- 11th grade: 57
- 12th grade, no diploma: 24
- High school graduate (or equivalency): 1,691
- Less than 1 year of college: 185
- Some college more than 1 year, no degree: 598
- Associate degree: 321
- Bachelor's degree: 2,680
- Master's degree: 1,194
- Professional school degree: 618
- Doctorate degree: 178

Education attainment for females 25 years and older:
- No schooling: 89
- Nursery to 4th grade: 0
- 5th and 6th grade: 98
- 7th and 8th grade: 51
- 9th grade: 0
- 10th grade: 141
- 11th grade: 0
- 12th grade, no diploma: 3
- High school graduate (or equivalency): 1,406
- Less than 1 year of college: 216
- Some college more than 1 year, no degree: 338
- Associate degree: 348
- Bachelor's degree: 2,788
- Master's degree: 1,511
- Professional school degree: 231
- Doctorate degree: 179


Housing units in structures:
- One, detached: 2,243
- One, attached: 1,033
- Two: 745
- 3 or 4: 957
- 5 to 9: 398
- 10 to 19: 711
- 20 to 49: 1,123
- 50 or more: 2,080
- Mobile homes: 80
Housing units lacking complete kitchen facilities in 2022: 1.5%
House/condo owner moved in on average 9 years ago
Renter moved in on average 1 years ago

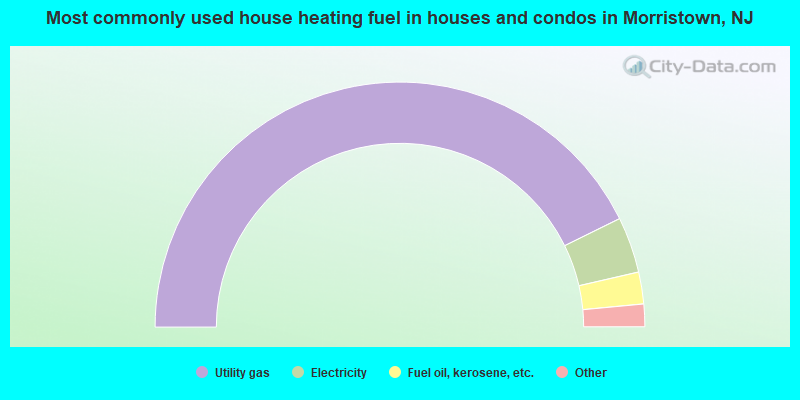
- 85.5%Utility gas
- 7.4%Electricity
- 4.2%Fuel oil, kerosene, etc.
- 1.6%No fuel used
- 1.4%Bottled, tank, or LP gas
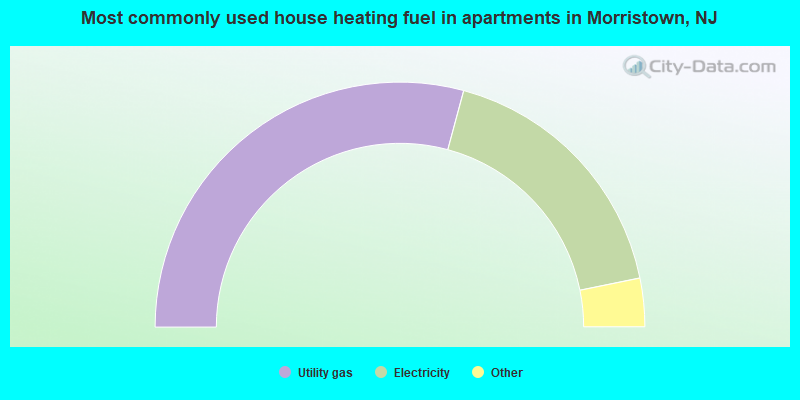
- 58.4%Utility gas
- 35.2%Electricity
- 2.3%Bottled, tank, or LP gas
- 1.9%Fuel oil, kerosene, etc.
- 1.5%No fuel used
- 0.4%Other fuel
- 0.3%Solar energy
Private vs. public school enrollment:
| Here: | 6.2% |
| New Jersey: | 12.3% |
| Here: | 11.4% |
| New Jersey: | 13.1% |
| Here: | 31.5% |
| New Jersey: | 33.2% |


