Races in Morristown, New Jersey (NJ) Detailed Stats
Data:
Races - White alone (%)
Races - White alone (% change since 2000)
Races - Black alone (%)
Races - Black alone (% change since 2000)
Races - American Indian alone (%)
Races - American Indian alone (% change since 2000)
Races - Asian alone (%)
Races - Asian alone (% change since 2000)
Races - Hispanic (%)
Races - Hispanic (% change since 2000)
Races - Native Hawaiian and Other Pacific Islander alone (%)
Races - Native Hawaiian and Other Pacific Islander alone (% change since 2000)
Races - Two or more races(%)
Races - Two or more races(% change since 2000)
Races - Other race alone (%)
Races - Other race alone (% change since 2000)
Racial diversity
Place of birth - Born in state of residence (%)
Place of birth - Born in state of residence (%) - White
Place of birth - Born in state of residence (%) - Black or African American
Place of birth - Born in state of residence (%) - Asian
Place of birth - Born in state of residence (%) - Hispanic or Latino
Place of birth - Born in state of residence (%) - American Indian and Alaska Native
Place of birth - Born in state of residence (%) - Multirace
Place of birth - Born in state of residence (%) - Other Race
Place of birth - Born in other state (%)
Place of birth - Born in other state (%) - White
Place of birth - Born in other state (%) - Black or African American
Place of birth - Born in other state (%) - Asian
Place of birth - Born in other state (%) - Hispanic or Latino
Place of birth - Born in other state (%) - American Indian and Alaska Native
Place of birth - Born in other state (%) - Multirace
Place of birth - Born in other state (%) - Other Race
Place of birth - Native, outside of US (%)
Place of birth - Native, outside of US (%) - White
Place of birth - Native, outside of US (%) - Black or African American
Place of birth - Native, outside of US (%) - Asian
Place of birth - Native, outside of US (%) - Hispanic or Latino
Place of birth - Native, outside of US (%) - American Indian and Alaska Native
Place of birth - Native, outside of US (%) - Multirace
Place of birth - Native, outside of US (%) - Other Race
Place of birth - Foreign born (%)
Place of birth - Foreign born (%) - White
Place of birth - Foreign born (%) - Black or African American
Place of birth - Foreign born (%) - Asian
Place of birth - Foreign born (%) - Hispanic or Latino
Place of birth - Foreign born (%) - American Indian and Alaska Native
Place of birth - Foreign born (%) - Multirace
Place of birth - Foreign born (%) - Other Race
Residents speaking English at home (%)
Residents speaking English at home - Born in the United States (%)
Residents speaking English at home - Native, born elsewhere (%)
Residents speaking English at home - Foreign born (%)
Residents speaking Spanish at home (%)
Residents speaking Spanish at home - Born in the United States (%)
Residents speaking Spanish at home - Native, born elsewhere (%)
Residents speaking Spanish at home - Foreign born (%)
Residents speaking other language at home (%)
Residents speaking other language at home - Born in the United States (%)
Residents speaking other language at home - Native, born elsewhere (%)
Residents speaking other language at home - Foreign born (%)
Marital status - Never married (%)
Marital status - Now married (%)
Marital status - Separated (%)
Marital status - Widowed (%)
Marital status - Divorced (%)
Ancestries Reported - Arab (%)
Ancestries Reported - Czech (%)
Ancestries Reported - Danish (%)
Ancestries Reported - Dutch (%)
Ancestries Reported - English (%)
Ancestries Reported - French (%)
Ancestries Reported - French Canadian (%)
Ancestries Reported - German (%)
Ancestries Reported - Greek (%)
Ancestries Reported - Hungarian (%)
Ancestries Reported - Irish (%)
Ancestries Reported - Italian (%)
Ancestries Reported - Lithuanian (%)
Ancestries Reported - Norwegian (%)
Ancestries Reported - Polish (%)
Ancestries Reported - Portuguese (%)
Ancestries Reported - Russian (%)
Ancestries Reported - Scotch-Irish (%)
Ancestries Reported - Scottish (%)
Ancestries Reported - Slovak (%)
Ancestries Reported - Subsaharan African (%)
Ancestries Reported - Swedish (%)
Ancestries Reported - Swiss (%)
Ancestries Reported - Ukrainian (%)
Ancestries Reported - United States (%)
Ancestries Reported - Welsh (%)
Ancestries Reported - West Indian (%)
Ancestries Reported - Other (%)
Geographical mobility - Same house 1 year ago (%)
Geographical mobility - Same house 1 year ago (%) - White
Geographical mobility - Same house 1 year ago (%) - Black or African American
Geographical mobility - Same house 1 year ago (%) - Asian
Geographical mobility - Same house 1 year ago (%) - Hispanic or Latino
Geographical mobility - Same house 1 year ago (%) - American Indian and Alaska Native
Geographical mobility - Same house 1 year ago (%) - Multirace
Geographical mobility - Same house 1 year ago (%) - Other Race
Geographical mobility - Moved within same county (%)
Geographical mobility - Moved within same county (%) - White
Geographical mobility - Moved within same county (%) - Black or African American
Geographical mobility - Moved within same county (%) - Asian
Geographical mobility - Moved within same county (%) - Hispanic or Latino
Geographical mobility - Moved within same county (%) - American Indian and Alaska Native
Geographical mobility - Moved within same county (%) - Multirace
Geographical mobility - Moved within same county (%) - Other Race
Geographical mobility - Moved from different county within same state (%)
Geographical mobility - Moved from different county within same state (%) - White
Geographical mobility - Moved from different county within same state (%) - Black or African American
Geographical mobility - Moved from different county within same state (%) - Asian
Geographical mobility - Moved from different county within same state (%) - Hispanic or Latino
Geographical mobility - Moved from different county within same state (%) - American Indian and Alaska Native
Geographical mobility - Moved from different county within same state (%) - Multirace
Geographical mobility - Moved from different county within same state (%) - Other Race
Geographical mobility - Moved from different state (%)
Geographical mobility - Moved from different state (%) - White
Geographical mobility - Moved from different state (%) - Black or African American
Geographical mobility - Moved from different state (%) - Asian
Geographical mobility - Moved from different state (%) - Hispanic or Latino
Geographical mobility - Moved from different state (%) - American Indian and Alaska Native
Geographical mobility - Moved from different state (%) - Multirace
Geographical mobility - Moved from different state (%) - Other Race
Geographical mobility - Moved from abroad (%)
Geographical mobility - Moved from abroad (%) - White
Geographical mobility - Moved from abroad (%) - Black or African American
Geographical mobility - Moved from abroad (%) - Asian
Geographical mobility - Moved from abroad (%) - Hispanic or Latino
Geographical mobility - Moved from abroad (%) - American Indian and Alaska Native
Geographical mobility - Moved from abroad (%) - Multirace
Geographical mobility - Moved from abroad (%) - Other Race
Place of birth for the foreign-born population - Ireland (%)
Place of birth for the foreign-born population - Denmark (%)
Place of birth for the foreign-born population - Norway (%)
Place of birth for the foreign-born population - Sweden (%)
Place of birth for the foreign-born population - United Kingdom (%)
Place of birth for the foreign-born population - England (%)
Place of birth for the foreign-born population - Scotland (%)
Place of birth for the foreign-born population - Other Northern Europe (%)
Place of birth for the foreign-born population - Austria (%)
Place of birth for the foreign-born population - Belgium (%)
Place of birth for the foreign-born population - France (%)
Place of birth for the foreign-born population - Germany (%)
Place of birth for the foreign-born population - Netherlands (%)
Place of birth for the foreign-born population - Switzerland (%)
Place of birth for the foreign-born population - Other Western Europe (%)
Place of birth for the foreign-born population - Greece (%)
Place of birth for the foreign-born population - Italy (%)
Place of birth for the foreign-born population - Portugal (%)
Place of birth for the foreign-born population - Spain (%)
Place of birth for the foreign-born population - Other Southern Europe (%)
Place of birth for the foreign-born population - Albania (%)
Place of birth for the foreign-born population - Belarus (%)
Place of birth for the foreign-born population - Bosnia and Herzegovina (%)
Place of birth for the foreign-born population - Bulgaria (%)
Place of birth for the foreign-born population - Croatia (%)
Place of birth for the foreign-born population - Czechoslovakia (%)
Place of birth for the foreign-born population - Hungary (%)
Place of birth for the foreign-born population - Latvia (%)
Place of birth for the foreign-born population - Lithuania (%)
Place of birth for the foreign-born population - North Macedonia (Macedonia) (%)
Place of birth for the foreign-born population - Moldova (%)
Place of birth for the foreign-born population - Poland (%)
Place of birth for the foreign-born population - Romania (%)
Place of birth for the foreign-born population - Russia (%)
Place of birth for the foreign-born population - Serbia (%)
Place of birth for the foreign-born population - Ukraine (%)
Place of birth for the foreign-born population - Other Eastern Europe (%)
Place of birth for the foreign-born population - China (%)
Place of birth for the foreign-born population - Hong Kong (%)
Place of birth for the foreign-born population - Taiwan (%)
Place of birth for the foreign-born population - Japan (%)
Place of birth for the foreign-born population - Korea (%)
Place of birth for the foreign-born population - Other Eastern Asia (%)
Place of birth for the foreign-born population - Afghanistan (%)
Place of birth for the foreign-born population - Bangladesh (%)
Place of birth for the foreign-born population - India (%)
Place of birth for the foreign-born population - Iran (%)
Place of birth for the foreign-born population - Kazakhstan (%)
Place of birth for the foreign-born population - Nepal (%)
Place of birth for the foreign-born population - Pakistan (%)
Place of birth for the foreign-born population - Sri Lanka (%)
Place of birth for the foreign-born population - Uzbekistan (%)
Place of birth for the foreign-born population - Other South Central Asia (%)
Place of birth for the foreign-born population - Burma (%)
Place of birth for the foreign-born population - Cambodia (%)
Place of birth for the foreign-born population - Indonesia (%)
Place of birth for the foreign-born population - Laos (%)
Place of birth for the foreign-born population - Malaysia (%)
Place of birth for the foreign-born population - Philippines (%)
Place of birth for the foreign-born population - Singapore (%)
Place of birth for the foreign-born population - Thailand (%)
Place of birth for the foreign-born population - Vietnam (%)
Place of birth for the foreign-born population - Other South Eastern Asia (%)
Place of birth for the foreign-born population - Armenia (%)
Place of birth for the foreign-born population - Iraq (%)
Place of birth for the foreign-born population - Israel (%)
Place of birth for the foreign-born population - Jordan (%)
Place of birth for the foreign-born population - Kuwait (%)
Place of birth for the foreign-born population - Lebanon (%)
Place of birth for the foreign-born population - Saudi Arabia (%)
Place of birth for the foreign-born population - Syria (%)
Place of birth for the foreign-born population - Turkey (%)
Place of birth for the foreign-born population - Yemen (%)
Place of birth for the foreign-born population - Other Western Asia (%)
Place of birth for the foreign-born population - Eritrea (%)
Place of birth for the foreign-born population - Ethiopia (%)
Place of birth for the foreign-born population - Kenya (%)
Place of birth for the foreign-born population - Somalia (%)
Place of birth for the foreign-born population - Uganda (%)
Place of birth for the foreign-born population - Zimbabwe (%)
Place of birth for the foreign-born population - Other Eastern Africa (%)
Place of birth for the foreign-born population - Cameroon (%)
Place of birth for the foreign-born population - Congo (%)
Place of birth for the foreign-born population - Democratic Republic of Congo (Zaire) (%)
Place of birth for the foreign-born population - Other Middle Africa (%)
Place of birth for the foreign-born population - Egypt (%)
Place of birth for the foreign-born population - Morocco (%)
Place of birth for the foreign-born population - Sudan (%)
Place of birth for the foreign-born population - Other Northern Africa (%)
Place of birth for the foreign-born population - South Africa (%)
Place of birth for the foreign-born population - Other Southern Africa (%)
Place of birth for the foreign-born population - Cabo Verde (%)
Place of birth for the foreign-born population - Ghana (%)
Place of birth for the foreign-born population - Liberia (%)
Place of birth for the foreign-born population - Nigeria (%)
Place of birth for the foreign-born population - Senegal (%)
Place of birth for the foreign-born population - Sierra Leone (%)
Place of birth for the foreign-born population - Other Western Africa (%)
Place of birth for the foreign-born population - Australia (%)
Place of birth for the foreign-born population - New Zealand (%)
Place of birth for the foreign-born population - Fiji (%)
Place of birth for the foreign-born population - Micronesia (%)
Place of birth for the foreign-born population - Bahamas (%)
Place of birth for the foreign-born population - Barbados (%)
Place of birth for the foreign-born population - Cuba (%)
Place of birth for the foreign-born population - Dominica (%)
Place of birth for the foreign-born population - Dominican Republic (%)
Place of birth for the foreign-born population - Grenada (%)
Place of birth for the foreign-born population - Haiti (%)
Place of birth for the foreign-born population - Jamaica (%)
Place of birth for the foreign-born population - St. Vincent and the Grenadines (%)
Place of birth for the foreign-born population - Trinidad and Tobago (%)
Place of birth for the foreign-born population - West Indies (%)
Place of birth for the foreign-born population - Other Caribbean (%)
Place of birth for the foreign-born population - Belize (%)
Place of birth for the foreign-born population - Costa Rica (%)
Place of birth for the foreign-born population - El Salvador (%)
Place of birth for the foreign-born population - Guatemala (%)
Place of birth for the foreign-born population - Honduras (%)
Place of birth for the foreign-born population - Mexico (%)
Place of birth for the foreign-born population - Nicaragua (%)
Place of birth for the foreign-born population - Panama (%)
Place of birth for the foreign-born population - Other Central America (%)
Place of birth for the foreign-born population - Argentina (%)
Place of birth for the foreign-born population - Bolivia (%)
Place of birth for the foreign-born population - Brazil (%)
Place of birth for the foreign-born population - Chile (%)
Place of birth for the foreign-born population - Colombia (%)
Place of birth for the foreign-born population - Ecuador (%)
Place of birth for the foreign-born population - Guyana (%)
Place of birth for the foreign-born population - Peru (%)
Place of birth for the foreign-born population - Uruguay (%)
Place of birth for the foreign-born population - Venezuela (%)
Place of birth for the foreign-born population - Other South America (%)
Place of birth for the foreign-born population - Canada (%)
Place of birth for the foreign-born population - Other Northern America (%)
Place of birth for the foreign-born population - Other (%)
Latest news about races in Morristown, NJ collected exclusively by city-data.com from local newspapers, TV, and radio stations
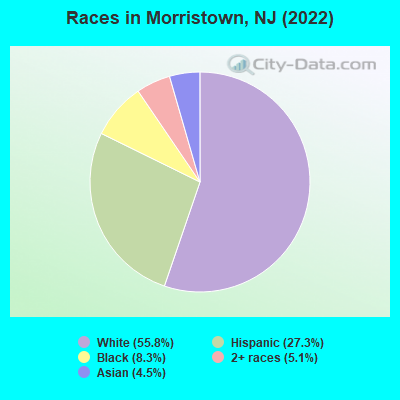
According to 2022 data, the most numerous races in Morristown, NJ are White alone (11,276 residents), Hispanic (5,516 residents), and Black alone (1,684 residents). 67.2% of Morristown residents speak English at home. 21.4% of Morristown, NJ residents are foreign-born (14.0% born in Latin America, 3.8% born in Europe, 2.7% born in Asia), which is 7.5% less than the foreign-born rate of 23.0% across the entire state of New Jersey.
Race distribution in Morristown
2000 2022
5,557,209 66.0% White alone 1,117,191 13.3% Hispanic 1,096,171 13.0% Black alone 477,012 5.7% Asian alone 133,689 1.6% Two or more races 19,565 0.2% Other race alone 11,338 0.1% American Indian alone 2,175 0.03% Native Hawaiian and Other
4,766,476 51.5% White alone 2,028,470 21.9% Hispanic 1,111,632 12.0% Black alone 923,546 10.0% Asian alone 332,237 3.6% Two or more races 89,847 1.0% Other race alone 8,557 0.09% American Indian alone 934 0.01% Native Hawaiian and Other
Income and house value in Morristown Median household income in 2022 $131,873 White non-Hispanic householders$77,978 Black householders$183,012 Asian householders$54,046 Some other race householders$116,824 Two or more races householders$72,580 Hispanic or Latino race householdersMedian 2022 house value $614,784 White Non-Hispanic householders$452,674 Black or African American householders$578,046 American Indian or Alaska Native householders $466,547 Asian householders$425,442 Some other race householders$433,663 Two or more races householders$538,739 Hispanic or Latino householders
Median age by race in Morristown
35.0 Median age for White residents34.2 35.8 45.6 Median age for Black or African American residents38.0 47.6 -847,710,329.3 Median age for American Indian / Alaska Native residents-707,246,376.1 -671,264,367.1 36.2 Median age for Asian residents35.7 39.9 -804,177,544.9 Median age for Native Hawaiian / Pacific Islander residents-666,666,666.0 -713,070,378.3 36.9 Median age for Other race residents46.6 22.6 30.6 Median age for Two or more races residents35.8 21.0 34.8 Median age for White alone residents33.7 37.5 33.8 Median age for Hispanic or Latino residents37.0 27.6
Owner/renter occupied households by race in Morristown
House owners and renters - White residents 2,410 39.8% Owner occupied3,649 60.2% Renter occupiedHouse owners and renters - Black or African American residents 288 40.9% Owner occupied416 59.1% Renter occupiedHouse owners and renters - American Indian / Alaska Native residents 31 100.0% Renter occupiedHouse owners and renters - Asian residents 176 36.8% Owner occupied302 63.2% Renter occupiedHouse owners and renters - Other race residents 184 27.7% Owner occupied480 72.3% Renter occupiedHouse owners and renters - Two or more races residents 513 45.1% Owner occupied625 54.9% Renter occupiedHouse owners and renters - White alone residents 2,317 38.7% Owner occupied3,671 61.3% Renter occupiedHouse owners and renters - Hispanic or Latino residents 590 35.9% Owner occupied1,054 64.1% Renter occupied
Language usage in Morristown
English speakers - Total 67.2% of residents of Morristown speak English at home.
22.9% of residents speak Spanish at home 1,945 44.5% Speak English very well2,421 55.5% Speak English less than very well9.4% of residents speak other language at home 1,341 74.7% Speak English very well453 25.3% Speak English less than very well
English speakers - Born in the United States 89.5% of residents of Morristown speak English at home.
3.9% of residents speak Spanish at home 179 85.6% Speak English very well30 14.4% Speak English less than very well6.6% of residents speak other language at home 294 83.8% Speak English very well57 16.2% Speak English less than very well
English speakers - Native, born elsewhere 34.5% of residents of Morristown speak English at home.
74.8% of residents speak Spanish at home 126 25.5% Speak English very well368 74.5% Speak English less than very well1.7% of residents speak other language at home 11 100.0% Speak English very well
English speakers - Foreign-born 11.5% of residents of Morristown speak English at home.
61.5% of residents speak Spanish at home 569 22.5% Speak English very well1,964 77.5% Speak English less than very well27.5% of residents speak other language at home 809 71.3% Speak English very well325 28.7% Speak English less than very well
White (Caucasian) - Speak only English Native:
93.1% (9,699)Foreign-born:
20.4% (265)
White (Caucasian) - Speak another language Native:
6.5% (676)Foreign-born:
76.6% (992)
Black or African American - Speak only English Native:
100.0% (1,648)Foreign-born:
21.2% (24)
Black or African American - Speak another language Native:
0.1% (2)Foreign-born:
66.4% (75)
Asian - Speak only English Native:
57.6% (221)Foreign-born:
11.9% (64)
Asian - Speak another language Native:
42.8% (164)Foreign-born:
87.2% (470)
Other race - Speak only English Native:
10.8% (82)Foreign-born:
4.7% (38)
Other race - Speak another language Native:
92.6% (704)Foreign-born:
95.2% (772)
Two or more races - Speak only English Native:
38.6% (853)Foreign-born:
6.3% (103)
Two or more races - Speak another language Native:
63.5% (1,405)Foreign-born:
92.5% (1,501)
White alone - Speak only English Native:
96.3% (9,640)Foreign-born:
27.0% (234)
White alone - Speak another language Native:
3.7% (372)Foreign-born:
73.7% (640)
Hispanic or Latino - Speak only English Native:
21.1% (537)Foreign-born:
6.5% (172)
Hispanic or Latino - Speak another language Native:
76.6% (1,954)Foreign-born:
92.8% (2,467)
Foreign-born residents in Morristown 4,327 residents are foreign born (14.0% Latin America , 3.8% Europe , 2.7% Asia ).
This city:
21.4%New Jersey:
23.2%
Marital status for residents in Morristown Marital status - White (Caucasian) population 15 years and over
Males 52.2% Never married36.0% Now married2.3% Separated0.7% Widowed8.8% DivorcedFemales 47.5% Never married34.8% Now married2.5% Separated3.0% Widowed12.2% DivorcedWomen who gave birth in the past 12 months Now married:
100.0% (181)Unmarried:
0.0% (0)
Women who did not give birth in the past 12 months Now married:
28.0% (942)Unmarried:
72.0% (2,421)
Marital status - Black or African American population 15 years and over
Males 68.7% Never married23.0% Now married0.5% Separated4.5% Widowed3.4% DivorcedFemales 40.0% Never married37.8% Now married4.5% Separated0.0% Widowed17.8% DivorcedWomen who gave birth in the past 12 months Now married:
0.0% (0)Unmarried:
100.0% (15)
Women who did not give birth in the past 12 months Now married:
11.3% (32)Unmarried:
88.7% (255)
Marital status - Asian population 15 years and over
Males 31.6% Never married62.6% Now married0.0% Separated0.0% Widowed5.8% DivorcedFemales 58.8% Never married36.9% Now married0.0% Separated3.0% Widowed1.4% DivorcedWomen who gave birth in the past 12 months Now married:
100.0% (13)Unmarried:
0.0% (0)
Women who did not give birth in the past 12 months Now married:
32.8% (132)Unmarried:
67.2% (270)
Marital status - Other race population 15 years and over
Males 50.3% Never married49.7% Now married0.0% Separated0.0% Widowed0.0% DivorcedFemales 48.6% Never married51.4% Now married0.0% Separated0.0% Widowed0.0% DivorcedWomen who did not give birth in the past 12 months Now married:
44.5% (246)Unmarried:
55.5% (307)
Marital status - Two or more races population 15 years and over
Males 53.5% Never married44.1% Now married0.0% Separated0.0% Widowed2.4% DivorcedFemales 52.5% Never married35.9% Now married0.0% Separated6.2% Widowed5.5% DivorcedWomen who gave birth in the past 12 months Now married:
100.0% (17)Unmarried:
0.0% (0)
Women who did not give birth in the past 12 months Now married:
11.6% (94)Unmarried:
88.4% (717)
Marital status - White alone, not Hispanic / Latino population 15 years and over
Males 55.6% Never married33.1% Now married2.6% Separated0.8% Widowed8.0% DivorcedFemales 50.5% Never married31.4% Now married2.9% Separated3.0% Widowed12.2% DivorcedWomen who gave birth in the past 12 months Now married:
100.0% (192)Unmarried:
0.0% (0)
Women who did not give birth in the past 12 months Now married:
22.6% (697)Unmarried:
77.4% (2,383)
Marital status - Hispanic or Latino population 15 years and over
Males 45.4% Never married49.0% Now married0.0% Separated0.0% Widowed5.6% DivorcedFemales 41.8% Never married49.0% Now married0.0% Separated3.7% Widowed5.5% DivorcedWomen who gave birth in the past 12 months Now married:
100.0% (12)Unmarried:
0.0% (0)
Women who did not give birth in the past 12 months Now married:
38.2% (574)Unmarried:
61.8% (927)
Ancestries in Morristown
990 9.2% Irish881 8.2% Italian287 2.7% English262 2.4% American230 2.1% German207 1.9% Haitian206 1.9% Polish164 1.5% Romanian158 1.5% Portuguese110 1.0% European104 1.0% Russian67 0.6% British55 0.5% Dutch53 0.5% Hungarian51 0.5% Egyptian47 0.4% Scottish46 0.4% Eastern European46 0.4% Greek42 0.4% Jamaican34 0.3% Austrian25 0.2% Canadian24 0.2% Kenyan24 0.2% African20 0.2% Lebanese20 0.2% Trinidadian and Tobagonian15 0.1% Jordanian13 0.1% Cajun13 0.1% Scotch-Irish11 0.1% French Canadian9 0.08% Northern European
Geographical mobility in Morristown Same house 1 year ago 9,908 80.7% White (Caucasian)1,559 94.9% Black or African American27 96.6% American Indian / Alaska Native546 60.5% Asian1,366 81.5% Other race3,587 82.9% Two or more races8,759 78.5% White alone, not Hispanic / Latino4,792 86.8% Hispanic or LatinoMoved within same county 953 7.8% White / Caucasian113 6.9% Black or African American42 2.5% Other race170 3.9% Two or more races1,011 9.1% White alone, not Hispanic / Latino92 1.7% Hispanic or LatinoMoved within same state 891 7.3% White / Caucasian13 0.8% Black or African American99 10.9% Asian112 6.7% Other race222 5.1% Two or more races984 8.8% White alone, not Hispanic / Latino502 9.1% Hispanic or LatinoMoved from different state 350 2.9% White / Caucasian2 0.1% Black or African American73 8.1% Asian305 2.7% White alone, not Hispanic / Latino39 0.7% Hispanic or LatinoMoved from abroad 194 1.6% White183 20.3% Asian258 6.0% Two or more races233 2.1% White alone, not Hispanic / Latino283 5.1% Hispanic or Latino
Children Nativity (place of birth) in Morristown
Children under 6 years - Living with two parents Both parents native 855 100.0% NativeBoth parents foreign-born 60 70.1% Native26 29.9% Foreign-bornOne native, one foreign-born parent 45 100.0% NativeChildren under 6 years - Living with one parent Native parent 292 100.0% NativeForeign-born parent 160 100.0% NativeChildren 6 to 17 years - Living with two parents Both parents native 367 96.5% Native13 3.5% Foreign-bornBoth parents foreign-born 489 100.0% NativeOne native, one foreign-born parent 79 100.0% NativeChildren 6 to 17 years - Living with one parent Native parent 381 100.0% NativeForeign-born parent 133 52.0% Native122 48.0% Foreign-born
Grandparents responsible for own grandchildren in Morristown
Grandparents (30 to 59 years) White / Caucasian 25 100.0% Responsible for grandchildrenWhite alone, not Hispanic / Latino 25 100.0% Responsible for grandchildrenGrandparents (60 years and over) White / Caucasian 89 52.6% Responsible for grandchildren80 47.4% Not responsible for grandchildrenWhite alone, not Hispanic / Latino 67 54.6% Responsible for grandchildren56 45.4% Not responsible for grandchildren