Monmouth, IL (Illinois) Houses and Residents
| Monmouth: | $94,705 |
| Illinois: | $251,600 |
Total population: 9,527 (All urban)
Houses: 3,739 (3,334 occupied: 2,341 owner occupied, 1,035 renter occupied)
| % of renters here: | 31% |
| State: | 33% |
Housing density: 928 houses/condos per square mile
Median price asked for vacant for-sale houses and condos in 2022: $153,135.
Median contract rent in 2022: $498 (lower quartile is $380, upper quartile is $663)
Median rent asked for vacant for-rent units in 2022: $691
Median gross rent in Monmouth, IL in 2022: $648
Housing units in Monmouth with a mortgage: 1,324 (103 second mortgage, 0 home equity loan, 58 both second mortgage and home equity loan)
Houses without a mortgage: 14
Median household income for houses/condos with a mortgage: $67,841
Median household income for apartments without a mortgage: $57,678
Median monthly housing costs: $709
Compare current foreclosures near Monmouth, IL:
| Photo | Address | Area | Beds / Baths | Price | Details |
|---|---|---|---|---|---|

|
#1
N 9th 1/2 St
Monmouth, IL 61462
|
- sq. feet
|
- baths - beds |
show details | |

|
#2
E 6th Ave
Monmouth, IL 61462
|
- sq. feet
|
- baths - beds |
show details | |

|
#3
N 11th St
Monmouth, IL 61462
|
- sq. feet
|
- baths - beds |
show details | |

|
#4
W 4th Ave
Monmouth, IL 61462
|
- sq. feet
|
- baths - beds |
show details | |

|
#5
E 11th Ave
Monmouth, IL 61462
|
- sq. feet
|
- baths - beds |
show details | |

|
#6
62nd St
Monmouth, IL 61462
|
- sq. feet
|
- baths - beds |
show details | |

|
#7
S F St
Monmouth, IL 61462
|
- sq. feet
|
- baths - beds |
show details | |

|
#8
S 9th St Apt 32
Monmouth, IL 61462
|
- sq. feet
|
- baths - beds |
show details | |

|
#9
N Main St
Monmouth, IL 61462
|
- sq. feet
|
- baths - beds |
show details | |

|
#10
N Blayney St
Alexis, IL 61412
|
1,232 sq. feet
|
1 baths 2 beds |
$95,000
|
show details |
| Photo | Address | Area | Beds / Baths | Price | Details |
|---|---|---|---|---|---|

|
#11
N D St
Monmouth, IL 61462
|
- sq. feet
|
- baths - beds |
show details | |

|
#12
W Boston Ave
Monmouth, IL 61462
|
- sq. feet
|
- baths - beds |
show details | |

|
#13
N West St
Galesburg, IL 61401
|
864 sq. feet
|
1 baths 2 beds |
show details | |

|
#14
Winchester Cir
Galesburg, IL 61401
|
2,950 sq. feet
|
2 baths 3 beds |
show details | |

|
#15
N Main St
Abingdon, IL 61410
|
- sq. feet
|
2 baths 3 beds |
show details | |

|
#16
Beecher Ave
Galesburg, IL 61401
|
- sq. feet
|
1 baths 1 beds |
show details | |

|
#17
S Seminary St
Galesburg, IL 61401
|
1 sq. feet
|
2 baths 5 beds |
show details | |

|
#18
S Ohio Ave
Abingdon, IL 61410
|
- sq. feet
|
- baths - beds |
show details | |

|
#19
Lombard St
Galesburg, IL 61401
|
- sq. feet
|
- baths - beds |
show details | |

|
#20
N Henderson St Apt 521
Galesburg, IL 61401
|
- sq. feet
|
- baths - beds |
show details |
| Photo | Address | Area | Beds / Baths | Price | Details |
|---|---|---|---|---|---|

|
#21
Burgland Ave
Galesburg, IL 61401
|
- sq. feet
|
- baths - beds |
show details | |

|
#22
Maple St
Seaton, IL 61476
|
- sq. feet
|
- baths - beds |
show details | |

|
#23
Frank St
Galesburg, IL 61401
|
- sq. feet
|
- baths - beds |
show details | |

|
#24
Vine St
Cameron, IL 61423
|
- sq. feet
|
- baths - beds |
show details | |

|
#25
Lincoln St
Galesburg, IL 61401
|
- sq. feet
|
- baths - beds |
show details | |

|
#26
Sweetbriar Pl
Galesburg, IL 61401
|
- sq. feet
|
- baths - beds |
show details | |

|
#27
Jasmine Ln
Galesburg, IL 61401
|
- sq. feet
|
- baths - beds |
show details | |

|
#28
E Main St
Galesburg, IL 61401
|
- sq. feet
|
- baths - beds |
show details | |

|
#29
E 6th Ave
Galesburg, IL 61401
|
- sq. feet
|
- baths - beds |
show details | |

|
#30
Monmouth Blvd
Galesburg, IL 61401
|
- sq. feet
|
- baths - beds |
show details |
| Photo | Address | Area | Beds / Baths | Price | Details |
|---|---|---|---|---|---|

|
#31
S State Highway 164
Oquawka, IL 61469
|
- sq. feet
|
- baths - beds |
show details | |

|
#32
285th Ave
Alexis, IL 61412
|
- sq. feet
|
- baths - beds |
show details | |

|
#33
N Prairie St
Galesburg, IL 61401
|
- sq. feet
|
- baths - beds |
show details | |

|
#34
N Pearl St
Galesburg, IL 61401
|
- sq. feet
|
- baths - beds |
show details | |

|
#35
Oak St
Galesburg, IL 61401
|
- sq. feet
|
- baths - beds |
show details | |

|
#36
Willard St
Galesburg, IL 61401
|
- sq. feet
|
- baths - beds |
show details | |

|
#37
E South St
Galesburg, IL 61401
|
- sq. feet
|
- baths - beds |
show details | |

|
#38
E Brooks St
Galesburg, IL 61401
|
- sq. feet
|
- baths - beds |
show details | |

|
#39
Greenbush Rd
Avon, IL 61415
|
- sq. feet
|
- baths - beds |
show details | |

|
#40
Willow Ln
Galesburg, IL 61401
|
- sq. feet
|
- baths - beds |
show details |
| Photo | Address | Area | Beds / Baths | Price | Details |
|---|---|---|---|---|---|

|
#41
Phillips St
Galesburg, IL 61401
|
- sq. feet
|
- baths - beds |
show details | |

|
#42
E Losey St
Galesburg, IL 61401
|
- sq. feet
|
- baths - beds |
show details | |

|
#43
Arnold St
Galesburg, IL 61401
|
- sq. feet
|
- baths - beds |
show details | |

|
#44
N Farnham St
Galesburg, IL 61401
|
- sq. feet
|
- baths - beds |
show details | |

|
#45
N Kellogg St
Galesburg, IL 61401
|
- sq. feet
|
- baths - beds |
show details | |

|
#46
W Peach St
Kirkwood, IL 61447
|
- sq. feet
|
- baths - beds |
show details | |

|
#47
Peck St
Galesburg, IL 61401
|
- sq. feet
|
- baths - beds |
show details | |

|
#48
Abingdon St
Galesburg, IL 61401
|
- sq. feet
|
- baths - beds |
show details | |

|
#49
W Plum St
Kirkwood, IL 61447
|
- sq. feet
|
- baths - beds |
show details | |

|
Check over 1 million property listings on Foreclosure.com!
|
browse all offers | |||

Latest news about housing in Monmouth, IL collected exclusively by city-data.com from local newspapers, TV, and radio stations

 | Monmouth and Galesburg (11 replies) |
| Anything about Monmouth (4 replies) |
| Moving to Macomb, IL (11 replies) |
| Help smaller towns wanted! (47 replies) |
| Illinois left standing after 50-state search for our relocation... (17 replies) |

Median year apartment built: 1957
Household type by relationship:
Households: 8,643- Male householders: 1,272 (337 living alone), Female householders: 2,001 (616 living alone)
1,312 spouses (1,289 opposite-sex spouses), 329 unmarried partners, (260 opposite-sex unmarried partners), 2,314 children (2,183 natural, 42 adopted, 88 stepchildren), 211 grandchildren, 119 brothers or sisters, 25 parents, 0 foster children, 71 other relatives, 66 non-relatives
- In group quarters: 919
Size of family households: 1,047 2-persons, 327 3-persons, 533 4-persons, 211 5-persons, 42 6-persons.
Size of nonfamily households: 1,004 1-person, 203 2-persons, 5 5-persons.
915 married couples with children.
834 single-parent households (115 men, 719 women).
80.8% of residents of Monmouth speak English at home.
12.9% of residents speak Spanish at home (37% speak English very well, 24% speak English well, 31% speak English not well, 8% don't speak English at all).
3.2% of residents speak other Indo-European language at home (39% speak English very well, 46% speak English well, 11% speak English not well, 3% don't speak English at all).
1.9% of residents speak Asian or Pacific Island language at home (24% speak English very well, 68% speak English well, 8% speak English not well).
1.2% of residents speak other language at home (100% speak English very well).
Foreign born population: 1,008 (11.7%)
(49.7% of them are naturalized citizens)
| Here: | 6.2 |
| State: | 6.4 |
| Here: | 4.2 |
| State: | 4.1 |

- Bedrooms in owner-occupied houses and condos in Monmouth, Illinois
- 0no bedroom
- 621 bedroom
- 6932 bedrooms
- 1,1253 bedrooms
- 3154 bedrooms
- 1465+ bedrooms

- Bedrooms in renter-occupied apartments in Monmouth, Illinois
- 108no bedroom
- 2731 bedroom
- 3702 bedrooms
- 1813 bedrooms
- 804 bedrooms
- 235+ bedrooms

- Cars and other vehicles available in Monmouth in owner-occupied houses/condos
- 52no vehicle
- 7191 vehicle
- 1,1982 vehicles
- 2573 vehicles
- 914 vehicles
- 245+ vehicles

- Cars and other vehicles available in Monmouth in renter-occupied apartments
- 225no vehicle
- 4741 vehicle
- 2542 vehicles
- 593 vehicles
- 234 vehicles
- 05+ vehicles

- Rooms in owner-occupied houses in Monmouth, Illinois
- 01 room
- 02 rooms
- 423 rooms
- 2854 rooms
- 4295 rooms
- 5776 rooms
- 2667 rooms
- 3258 rooms
- 4189+ rooms

- Rooms in renter-occupied apartments in Monmouth, Illinois
- 971 room
- 1092 rooms
- 1483 rooms
- 2104 rooms
- 2545 rooms
- 1396 rooms
- 337 rooms
- 238 rooms
- 239+ rooms


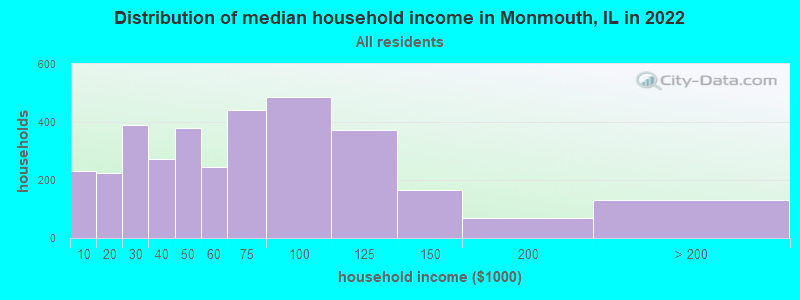
Monmouth, IL household income distribution

- 232Less than $10,000
- 225$10,000 to $19,999
- 388$20,000 to $29,999
- 272$30,000 to $39,999
- 378$40,000 to $49,999
- 245$50,000 to $59,999
- 441$60,000 to $74,999
- 487$75,000 to $99,999
- 373$100,000 to $124,999
- 166$125,000 to $149,999
- 69$150,000 to $199,999
- 130$200,000 or more
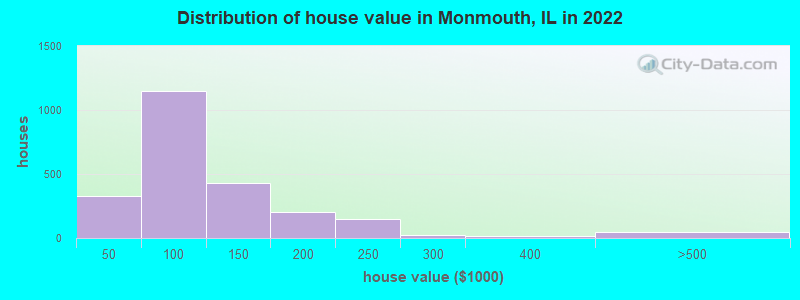
Home value of owner - occupied houses in 2022 in Monmouth, IL
-
- 25Less than $10,000
- 65$10,000 to $14,999
- 20$15,000 to $19,999
- 25$20,000 to $24,999
- 59$30,000 to $34,999
- 15$35,000 to $39,999
- 119$40,000 to $49,999
- 212$50,000 to $59,999
- 273$60,000 to $69,999
- 162$70,000 to $79,999
- 192$80,000 to $89,999
- 192$90,000 to $99,999
- 298$100,000 to $124,999
- 129$125,000 to $149,999
- 160$150,000 to $174,999
- 45$175,000 to $199,999
- 148$200,000 to $249,999
- 25$250,000 to $299,999
- 19$300,000 to $399,999
- 36$400,000 to $499,999
- 7$1,000,000 to $1,499,999
Rent paid by renters in 2022 in Monmouth, IL
-
- 21Less than $100
- 10$100 to $149
- 7$150 to $199
- 56$200 to $249
- 43$300 to $349
- 117$350 to $399
- 100$400 to $449
- 83$450 to $499
- 114$500 to $549
- 54$550 to $599
- 37$600 to $649
- 88$650 to $699
- 16$700 to $749
- 57$800 to $899
- 21$900 to $999
- 20$1,000 to $1,249
- 4$1,250 to $1,499
- 36$1,500 to $1,999
- 14$3,500 or more
- 143No cash rent


Percentage of workers working in this county: 79.7%
Number of people working at home: 246 (6.5% of all workers)
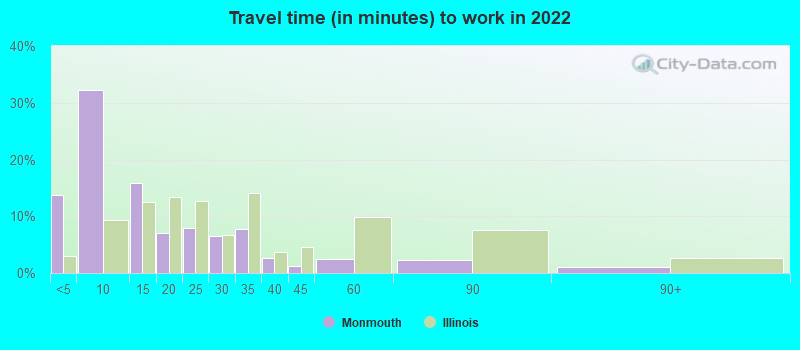
Travel time to work (commute)
- Less than 5 minutes: 673
- 5 to 9 minutes: 1,360
- 10 to 14 minutes: 435
- 15 to 19 minutes: 190
- 20 to 24 minutes: 275
- 25 to 29 minutes: 183
- 30 to 34 minutes: 123
- 35 to 39 minutes: 14
- 40 to 44 minutes: 48
- 45 to 59 minutes: 22
- 60 to 89 minutes: 98
- 90 or more minutes: 63
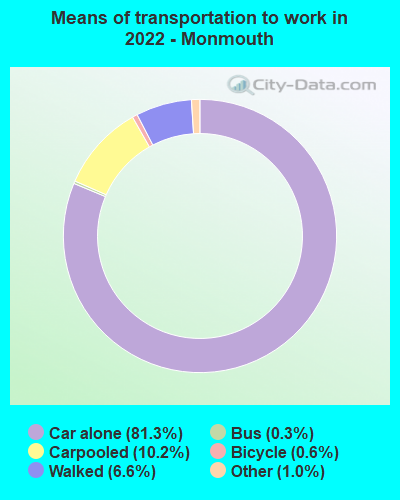
Means of transportation to work:
- Drove a car alone: 3,619 (75.2%)
- Carpooled: 485 (10.1%)
- Bus: 13 (0.3%)
- Taxi: 48 (1.0%)
- Bicycle: 30 (0.6%)
- Walked: 297 (6.2%)
- Worked at home: 246 (5.1%)

- Unemployment by race in 2022
- Unemployment rate for White non-Hispanic residents
- 10.9%Males
- 3.1%Females
- Unemployment rate for Black residents
- 25.4%Males
- 13.4%Females
- Unemployment rate for American Indian and Alaska Native residents
- 100.0%Females
- Unemployment rate for other race residents
- 53.8%Females
- Unemployment rate for two or more race residents
- 2.6%Males
- 9.8%Females
- Unemployment rate for Hispanic or Latino residents
- 5.9%Males
- 24.5%Females

- Year of entry for the foreign-born population in Monmouth, Illinois
- 2622010 or later
- 3332000 to 2009
- 1901990 to 1999
- 281980 to 1989
- 131970 to 1979
- 72Before 1970

First ancestries reported:
- German: 479 (12.5%)
- American: 339 (8.8%)
- Irish: 268 (7.0%)
- English: 198 (5.2%)
- African: 167 (4.3%)
- European: 109 (2.8%)
- Italian: 83 (2.2%)
- Swedish: 78 (2.0%)
- Polish: 61 (1.6%)
- Scotch-Irish: 39 (1.0%)
- French: 31 (0.8%)
- Norwegian: 30 (0.8%)
- Pennsylvania German: 21 (0.5%)
- Belgian: 12 (0.3%)
- Egyptian: 10 (0.3%)
- Scottish: 8 (0.2%)
- Danish: 7 (0.2%)
- Hungarian: 5 (0.1%)
- Scandinavian: 3 (0.08%)
- French Canadian: 2 (0.05%)
Most common places of birth for foreign-born residents (%):
| Monmouth: | 58.4% (589) |
| Illinois: | 34.7% (626,958) |
| Monmouth: | 9.5% (96) |
| Illinois: | 0.1% (1,142) |
| Monmouth: | 8.4% (85) |
| Illinois: | 0.4% (6,781) |
| Monmouth: | 6.0% (60) |
| Illinois: | 0.6% (10,943) |
| Monmouth: | 5.2% (52) |
| Illinois: | 0.3% (4,552) |
| Monmouth: | 1.6% (16) |
| Illinois: | 0.2% (4,414) |
Place of birth for U.S.-born residents:
- This state: 5,424
- Other state: 2,013
- Northeast: 76
- Midwest: 1,263
- South: 344
- West: 338
76.5% of Monmouth residents lived in the same house 1 years ago.
Out of people who lived in different houses, 33.6% lived in this county.
Out of people who lived in different counties, 64.4% lived in Illinois.
| Monmouth: | 76.5% |
| State average: | 88.3% |
Education attainment for males 25 years and older:
- No schooling: 55
- Nursery to 4th grade: 84
- 5th and 6th grade: 12
- 7th and 8th grade: 0
- 9th grade: 45
- 10th grade: 25
- 11th grade: 93
- 12th grade, no diploma: 57
- High school graduate (or equivalency): 921
- Less than 1 year of college: 210
- Some college more than 1 year, no degree: 229
- Associate degree: 141
- Bachelor's degree: 266
- Master's degree: 121
- Professional school degree: 36
- Doctorate degree: 67

Education attainment for females 25 years and older:
- No schooling: 86
- Nursery to 4th grade: 54
- 5th and 6th grade: 28
- 7th and 8th grade: 55
- 9th grade: 79
- 10th grade: 15
- 11th grade: 92
- 12th grade, no diploma: 49
- High school graduate (or equivalency): 917
- Less than 1 year of college: 329
- Some college more than 1 year, no degree: 313
- Associate degree: 251
- Bachelor's degree: 429
- Master's degree: 113
- Professional school degree: 2
- Doctorate degree: 16


Housing units in structures:
- One, detached: 2,942
- One, attached: 89
- Two: 58
- 3 or 4: 116
- 5 to 9: 153
- 10 to 19: 46
- 20 to 49: 75
- 50 or more: 179
- Mobile homes: 77
Median worth of mobile homes: $14,674
Housing units lacking complete kitchen facilities in 2022: 2.3%
House/condo owner moved in on average 14 years ago
Renter moved in on average 2 years ago

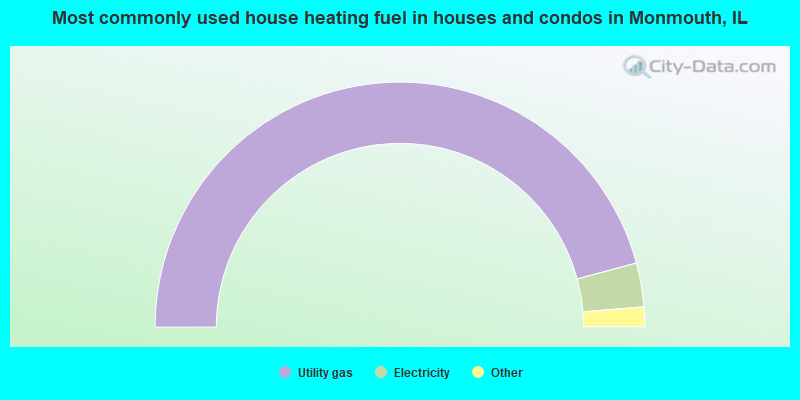
- 91.7%Utility gas
- 5.8%Electricity
- 1.6%Bottled, tank, or LP gas
- 1.0%Wood
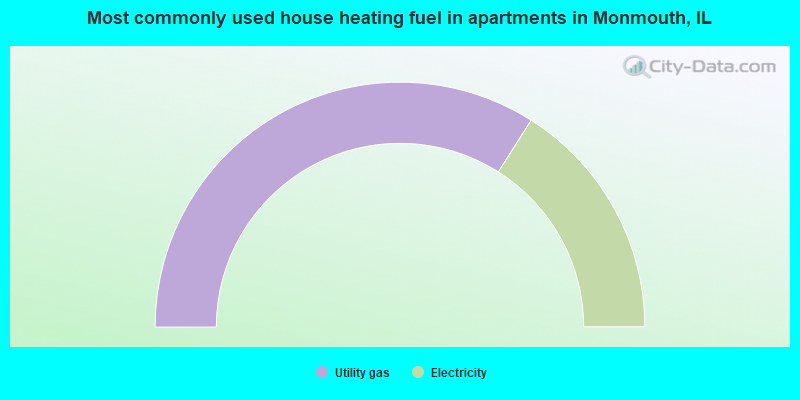
- 68.0%Utility gas
- 32.0%Electricity
Private vs. public school enrollment:
| Here: | 16.4% |
| Illinois: | 13.3% |
| Here: | 1.9% |
| Illinois: | 9.9% |
| Here: | 88.1% |
| Illinois: | 27.4% |


