Races in Monmouth, Illinois (IL) Detailed Stats
Ancestries, Foreign-born residents, place of birth
Settings
X


Recent posts about races in Monmouth, Illinois on our local forum with over 2,400,000 registered users:
 | Monmouth and Galesburg (11 replies) |
Latest news about races in Monmouth, IL collected exclusively by city-data.com from local newspapers, TV, and radio stations
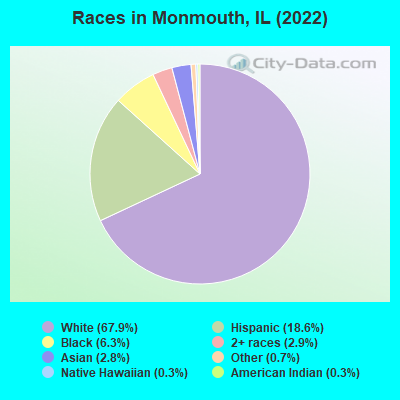
According to 2022 data, the most numerous races in Monmouth, IL are White alone (5,867 residents), Hispanic (1,609 residents), and Black alone (545 residents). 80.7% of Monmouth residents speak English at home. 11.7% of Monmouth, IL residents are foreign-born (7.0% born in Latin America, 2.7% born in Asia, 1.7% born in Africa), which is 20.0% less than the foreign-born rate of 14.0% across the entire state of Illinois.
Race distribution in Monmouth
2000
2022

- 8,94090.8%White alone
- 4284.3%Hispanic
- 2742.8%Black alone
- 1121.1%Two or more races
- 440.4%Asian alone
- 200.2%American Indian alone
- 170.2%Native Hawaiian and Other
Pacific Islander alone - 60.06%Other race alone

-
- 5,86767.9%White alone
- 1,60918.6%Hispanic
- 5456.3%Black alone
- 2492.9%Two or more races
- 2452.8%Asian alone
- 590.7%Other race alone
- 280.3%American Indian alone
- 300.3%Native Hawaiian and Other
Pacific Islander alone
2000
2022
-
- 8,424,14067.8%White alone
- 1,856,15214.9%Black alone
- 1,530,26212.3%Hispanic
- 419,9163.4%Asian alone
- 153,9961.2%Two or more races
- 13,4790.1%Other race alone
- 18,2320.1%American Indian alone
- 3,1160.03%Native Hawaiian and Other
Pacific Islander alone

-
- 7,356,30158.5%White alone
- 2,299,72618.3%Hispanic
- 1,660,42313.2%Black alone
- 747,2965.9%Asian alone
- 458,5993.6%Two or more races
- 45,3860.4%Other race alone
- 10,4050.08%American Indian alone
- 3,8960.03%Native Hawaiian and Other
Pacific Islander alone

Income and house value in Monmouth
- Median household income in 2022
- $56,209White non-Hispanic householders
- $66,988Black householders
- $43,387Two or more races householders
- Median 2022 house value
- $99,161White Non-Hispanic householders
- $82,449Black or African American householders
- $301,756American Indian or Alaska Native householders
- $343,538Asian householders
- $61,836Some other race householders
- $55,337Hispanic or Latino householders
Household income for White non-Hispanic householders

Household income for Black householders

Household income for American Indian and Alaska Native householders

Household income for Some other race householders

Household income for Two or more races householders

Household income for Hispanic or Latino race householders

Median age by race in Monmouth
- 40.3Median age for White residents
- 36.8Males
- 45.2Females
- 33.4Median age for Black or African American residents
- 29.5Males
- 38.7Females
- 11.0Median age for American Indian / Alaska Native residents
- 11.2Males
- 25.3Females
- 21.0Median age for Asian residents
- 21.0Males
- 30.9Females
- 10.0Median age for Native Hawaiian / Pacific Islander residents
- -658,536,584.7Males
- 10.0Females
- 38.1Median age for Other race residents
- 48.3Males
- 37.2Females
- 17.3Median age for Two or more races residents
- 12.6Males
- 18.3Females
- 42.7Median age for White alone residents
- 39.5Males
- 46.0Females
- 24.9Median age for Hispanic or Latino residents
- 23.4Males
- 26.9Females
Owner/renter occupied households by race in Monmouth
- House owners and renters - White residents
- 1,89671.0%Owner occupied
- 77529.0%Renter occupied
- House owners and renters - Black or African American residents
- 5634.4%Owner occupied
- 10665.6%Renter occupied
- House owners and renters - American Indian / Alaska Native residents
- 47100.0%Owner occupied
- House owners and renters - Asian residents
- 53100.0%Owner occupied
- House owners and renters - Native Hawaiian / Pacific Islander residents
- 24100.0%Renter occupied
- House owners and renters - Other race residents
- 23286.6%Owner occupied
- 3613.4%Renter occupied
- House owners and renters - Two or more races residents
- 5355.1%Owner occupied
- 4444.9%Renter occupied
- House owners and renters - White alone residents
- 1,86069.5%Owner occupied
- 81530.5%Renter occupied
- House owners and renters - Hispanic or Latino residents
- 29482.4%Owner occupied
- 6317.6%Renter occupied
Language usage in Monmouth
- English speakers - Total
- 80.7% of residents of Monmouth speak English at home.
- 13.0% of residents speak Spanish at home
- 40337.5%Speak English very well
- 67362.5%Speak English less than very well
- 6.3% of residents speak other language at home
- 23945.7%Speak English very well
- 28454.3%Speak English less than very well
- English speakers - Born in the United States
- 96.6% of residents of Monmouth speak English at home.
- 0.8% of residents speak Spanish at home
- 1487.5%Speak English very well
- 212.5%Speak English less than very well
- 2.3% of residents speak other language at home
- 3986.7%Speak English very well
- 613.3%Speak English less than very well
- English speakers - Native, born elsewhere
- 1.5% of residents of Monmouth speak English at home.
- 40.6% of residents speak Spanish at home
- 4352.4%Speak English very well
- 3947.6%Speak English less than very well
- 58.4% of residents speak other language at home
- 8168.6%Speak English very well
- 3731.4%Speak English less than very well
- English speakers - Foreign-born
- 12.6% of residents of Monmouth speak English at home.
- 56.7% of residents speak Spanish at home
- 11520.1%Speak English very well
- 45779.9%Speak English less than very well
- 30.6% of residents speak other language at home
- 10534.1%Speak English very well
- 20365.9%Speak English less than very well
White (Caucasian) - Speak only English
| Native: | 99.2% (5,633) |
| Foreign-born: | 27.4% (45) |
White (Caucasian) - Speak another language
| Native: | 2.1% (121) |
| Foreign-born: | 73.8% (120) |
Black or African American - Speak another language
| Native: | 38.1% (158) |
| Foreign-born: | 95.1% (123) |
Asian - Speak only English
| Native: | 24.7% (13) |
| Foreign-born: | 44.0% (73) |
Asian - Speak another language
| Native: | 76.2% (39) |
| Foreign-born: | 50.6% (83) |
Other race - Speak another language
| Native: | 51.6% (245) |
| Foreign-born: | 99.9% (528) |
White alone - Speak only English
| Native: | 98.3% (5,472) |
| Foreign-born: | 6.2% (6) |
White alone - Speak another language
| Native: | 1.7% (93) |
| Foreign-born: | 95.1% (85) |
Hispanic or Latino - Speak only English
| Native: | 58.7% (551) |
| Foreign-born: | 7.5% (46) |
Hispanic or Latino - Speak another language
| Native: | 42.3% (397) |
| Foreign-born: | 92.4% (571) |
Foreign-born residents in Monmouth
1,008 residents are foreign born (7.0% Latin America, 2.7% Asia, 1.7% Africa).
| This city: | 11.7% |
| Illinois: | 14.1% |


Marital status for residents in Monmouth
Marital status - White (Caucasian) population 15 years and over
- Males
- 37.8%Never married
- 44.7%Now married
- 0.0%Separated
- 3.5%Widowed
- 14.0%Divorced
- Females
- 35.9%Never married
- 34.0%Now married
- 2.2%Separated
- 12.6%Widowed
- 15.2%Divorced
Women who gave birth in the past 12 months
| Now married: | 100.0% (45) |
| Unmarried: | 0.0% (0) |
Women who did not give birth in the past 12 months
| Now married: | 23.6% (324) |
| Unmarried: | 76.4% (1,051) |
Marital status - Black or African American population 15 years and over
- Males
- 56.4%Never married
- 36.6%Now married
- 5.3%Separated
- 0.0%Widowed
- 1.8%Divorced
- Females
- 61.1%Never married
- 34.4%Now married
- 0.0%Separated
- 4.6%Widowed
- 0.0%Divorced
Women who did not give birth in the past 12 months
| Now married: | 29.4% (55) |
| Unmarried: | 70.6% (131) |
Marital status - American Indian / Alaska Native population 15 years and over
- Males
- 0.0%Never married
- 61.1%Now married
- 0.0%Separated
- 0.0%Widowed
- 38.9%Divorced
- Females
- 0.0%Never married
- 4.3%Now married
- 0.0%Separated
- 0.0%Widowed
- 95.7%Divorced
Women who did not give birth in the past 12 months
| Now married: | 4.3% (2) |
| Unmarried: | 95.7% (37) |
Marital status - Asian population 15 years and over
- Males
- 81.7%Never married
- 18.3%Now married
- 0.0%Separated
- 0.0%Widowed
- 0.0%Divorced
- Females
- 19.5%Never married
- 80.5%Now married
- 0.0%Separated
- 0.0%Widowed
- 0.0%Divorced
Women who did not give birth in the past 12 months
| Now married: | 75.8% (47) |
| Unmarried: | 24.2% (15) |
Marital status - Native Hawaiian / Pacific Islander population 15 years and over
- Males
- 100.0%Never married
- 0.0%Now married
- 0.0%Separated
- 0.0%Widowed
- 0.0%Divorced
- Females
- 0.0%Never married
- 0.0%Now married
- 100.0%Separated
- 0.0%Widowed
- 0.0%Divorced
Women who did not give birth in the past 12 months
| Now married: | 100.0% (29) |
| Unmarried: | 0.0% (0) |
Marital status - Other race population 15 years and over
- Males
- 54.8%Never married
- 38.8%Now married
- 0.0%Separated
- 0.0%Widowed
- 6.3%Divorced
- Females
- 56.1%Never married
- 43.9%Now married
- 0.0%Separated
- 0.0%Widowed
- 0.0%Divorced
Women who did not give birth in the past 12 months
| Now married: | 24.3% (48) |
| Unmarried: | 75.7% (149) |
Marital status - Two or more races population 15 years and over
- Males
- 55.6%Never married
- 40.3%Now married
- 0.0%Separated
- 0.0%Widowed
- 4.2%Divorced
- Females
- 85.9%Never married
- 14.1%Now married
- 0.0%Separated
- 0.0%Widowed
- 0.0%Divorced
Women who gave birth in the past 12 months
| Now married: | 100.0% (9) |
| Unmarried: | 0.0% (0) |
Women who did not give birth in the past 12 months
| Now married: | 8.6% (12) |
| Unmarried: | 91.4% (123) |
Marital status - White alone, not Hispanic / Latino population 15 years and over
- Males
- 37.4%Never married
- 45.1%Now married
- 0.0%Separated
- 3.7%Widowed
- 13.8%Divorced
- Females
- 35.4%Never married
- 35.0%Now married
- 2.1%Separated
- 13.5%Widowed
- 14.0%Divorced
Women who gave birth in the past 12 months
| Now married: | 100.0% (48) |
| Unmarried: | 0.0% (0) |
Women who did not give birth in the past 12 months
| Now married: | 23.5% (312) |
| Unmarried: | 76.5% (1,014) |
Marital status - Hispanic or Latino population 15 years and over
- Males
- 49.3%Never married
- 38.9%Now married
- 0.0%Separated
- 0.0%Widowed
- 11.8%Divorced
- Females
- 53.4%Never married
- 27.7%Now married
- 1.2%Separated
- 0.0%Widowed
- 17.7%Divorced
Women who did not give birth in the past 12 months
| Now married: | 19.3% (77) |
| Unmarried: | 80.7% (323) |
Ancestries in Monmouth

- 47912.5%German
- 3398.8%American
- 2687.0%Irish
- 1985.2%English
- 1674.3%African
- 1092.8%European
- 832.2%Italian
- 782.0%Swedish
- 611.6%Polish
- 391.0%Scotch-Irish
- 310.8%French
- 300.8%Norwegian
- 210.5%Pennsylvania German
- 120.3%Belgian
- 100.3%Egyptian
- 80.2%Scottish
- 70.2%Danish
- 50.1%Hungarian
- 30.08%Scandinavian
- 20.05%French Canadian

Geographical mobility in Monmouth

- Same house 1 year ago
- 4,58676.8%White (Caucasian)
- 37869.1%Black or African American
- 25999.7%American Indian / Alaska Native
- 21989.4%Asian
- 76100.0%Native Hawaiian / Pacific Islander
- 72372.0%Other race
- 32169.6%Two or more races
- 4,52677.4%White alone, not Hispanic / Latino
- 1,20474.8%Hispanic or Latino

-
- Moved within same county
- 65210.9%White / Caucasian
- 8515.5%Black or African American
- 21821.7%Other race
- 7816.8%Two or more races
- 61410.5%White alone, not Hispanic / Latino
- 28918.0%Hispanic or Latino

-
- Moved within same state
- 4707.9%White / Caucasian
- 437.9%Black or African American
- 197.5%Asian
- 40.4%Other race
- 5612.0%Two or more races
- 4658.0%White alone, not Hispanic / Latino
- 613.8%Hispanic or Latino

-
- Moved from different state
- 2584.3%White / Caucasian
- 387.0%Black or African American
- 93.8%Asian
- 292.9%Other race
- 2273.9%White alone, not Hispanic / Latino
- 442.7%Hispanic or Latino

-
- Moved from abroad
- 40.1%White
- 50.1%White alone, not Hispanic / Latino

Children Nativity (place of birth) in Monmouth
Place of birth for residents in Monmouth
![Place of birth for the foreign-born population - Regions]()
- 613Americas
- 611Latin America
- 596Central America
- 235Asia
- 154Africa
- 110Middle Africa
- 82Eastern Asia
- 81South Eastern Asia
- 71Western Asia
- 32Western Africa
- 15China
- 14South America
- 12Northern Africa
- 4Europe
- 4Western Europe
- 2Northern America
- 1South Central Asia
- 1Caribbean

![Place of birth for the foreign-born population - Countries]()
- 596Mexico
- 79Congo
- 71Syria
- 67Japan
- 66Burma (Myanmar)
- 32Togo
- 31Democratic Republic of Congo (Zaire)
- 15China
- 15Cambodia
- 14Peru
- 12Egypt
- 4Germany
- 2Canada
- 1Pakistan
- 1Jamaica

Grandparents responsible for own grandchildren in Monmouth
Zip codes: 61462.