Milford Mill, MD (Maryland) Houses and Residents
| Milford Mill: | $269,470 |
| Maryland: | $398,100 |
Mean price in 2022:
Detached houses: $296,256
Here: $296,256 State: $526,819 Townhouses or other attached units: $211,082
Here: $211,082 State: $328,305 In 5-or-more-unit structures: $186,135
Here: $186,135 State: $350,378
Total population: 29,042 (Urban population: 26,233, Rural population: 294 (all nonfarm))
Houses: 12,400 (11,643 occupied: 5,308 owner occupied, 6,595 renter occupied)
| % of renters here: | 55% |
| State: | 32% |
Housing density: 1,778 houses/condos per square mile
Median price asked for vacant for-sale houses and condos in 2022: $189,371.
Median contract rent in 2022: $1,312 (lower quartile is $1,069, upper quartile is $1,520)
Median rent asked for vacant for-rent units in 2022: $1,034
Median gross rent in Milford Mill, MD in 2022: $1,455
Housing units in Milford Mill with a mortgage: 4,085 (463 second mortgage, 6 home equity loan, 239 both second mortgage and home equity loan)
Houses without a mortgage: 58
Median household income for houses/condos with a mortgage: $107,687
Median household income for apartments without a mortgage: $64,218
Median monthly housing costs: $1,462
Compare current foreclosures near Milford Mill, MD:
| Photo | Address | Area | Beds / Baths | Price | Details |
|---|---|---|---|---|---|

|
#1
Light St
Baltimore, MD 21230
|
1,554 sq. feet
|
1 baths 2 beds |
$254,900
|
show details |

|
#2
E 28th St
Baltimore, MD 21218
|
1,244 sq. feet
|
1 baths 2 beds |
$298,900
|
show details |

|
#3
N Belnord Ave
Baltimore, MD 21205
|
1,040 sq. feet
|
1 baths 3 beds |
$112,900
|
show details |

|
#4
Carroll St
Baltimore, MD 21230
|
1,450 sq. feet
|
1 baths 3 beds |
$79,900
|
show details |

|
#5
Southern Ave
Baltimore, MD 21206
|
1,132 sq. feet
|
1 baths 3 beds |
$148,500
|
show details |

|
#6
Francis St
Baltimore, MD 21217
|
2,038 sq. feet
|
2 baths 4 beds |
$45,500
|
show details |

|
#7
Rossville Blvd
Rosedale, MD 21237
|
2,561 sq. feet
|
2 baths 4 beds |
$599,900
|
show details |

|
#8
W Mosher St
Baltimore, MD 21216
|
1,574 sq. feet
|
1 baths 3 beds |
$28,500
|
show details |

|
#9
Corkley Rd
Rosedale, MD 21237
|
1,292 sq. feet
|
2 baths 3 beds |
$355,000
|
show details |

|
#10
E Ostend St
Baltimore, MD 21230
|
1,470 sq. feet
|
2 baths 2 beds |
$379,900
|
show details |
| Photo | Address | Area | Beds / Baths | Price | Details |
|---|---|---|---|---|---|

|
#11
Brooks Ln Apt 1a
Baltimore, MD 21217
|
983 sq. feet
|
2 baths 2 beds |
$134,900
|
show details |

|
#12
Winston Ave
Baltimore, MD 21239
|
1,254 sq. feet
|
1 baths 3 beds |
$245,000
|
show details |

|
#13
Renaissance Dr
Essex, MD 21221
|
2,244 sq. feet
|
2 baths 3 beds |
$399,900
|
show details |

|
#14
N Decker Ave
Baltimore, MD 21213
|
950 sq. feet
|
1 baths 2 beds |
$145,000
|
show details |

|
#15
N Curley St
Baltimore, MD 21224
|
1,008 sq. feet
|
1 baths 3 beds |
$41,000
|
show details |

|
#16
Wicklow Rd
Baltimore, MD 21229
|
1,152 sq. feet
|
1 baths 3 beds |
$112,000
|
show details |

|
#17
Ardmore Ave
Parkville, MD 21234
|
2,463 sq. feet
|
2 baths 4 beds |
$349,900
|
show details |

|
#18
Eastern Blvd
Essex, MD 21221
|
1,220 sq. feet
|
1 baths 3 beds |
$229,900
|
show details |

|
#19
Calverton Heights Ave
Baltimore, MD 21216
|
1,620 sq. feet
|
2 baths 4 beds |
$72,800
|
show details |

|
#20
Wilgate Rd
Owings Mills, MD 21117
|
1,056 sq. feet
|
1 baths 3 beds |
$321,000
|
show details |
| Photo | Address | Area | Beds / Baths | Price | Details |
|---|---|---|---|---|---|

|
#21
Tapu Ct
Nottingham, MD 21236
|
1,162 sq. feet
|
1 baths 3 beds |
$218,500
|
show details |

|
#22
Gorsuch Ave
Baltimore, MD 21218
|
1,380 sq. feet
|
1 baths 3 beds |
$90,000
|
show details |

|
#23
Willow Branch Way Unit 303
Owings Mills, MD 21117
|
1,200 sq. feet
|
2 baths 2 beds |
$259,000
|
show details |

|
#24
Windpine Rd
Middle River, MD 21220
|
1,220 sq. feet
|
2 baths 3 beds |
$254,000
|
show details |

|
#25
Rayner Ave
Baltimore, MD 21216
|
1,456 sq. feet
|
1 baths 3 beds |
$42,900
|
show details |

|
#26
Washington Blvd
Baltimore, MD 21230
|
960 sq. feet
|
1 baths 2 beds |
$64,900
|
show details |

|
#27
Cuthbert Ave
Baltimore, MD 21215
|
- sq. feet
|
1 baths 1 beds |
$12,000
|
show details |

|
#28
Macbeth Dr
Baltimore, MD 21239
|
1,496 sq. feet
|
2 baths 4 beds |
show details | |

|
#29
Braden Loop
Glen Burnie, MD 21061
|
2,513 sq. feet
|
2 baths 3 beds |
show details | |

|
#30
5th St
Brooklyn, MD 21225
|
1,232 sq. feet
|
1 baths - beds |
$49,900
|
show details |
| Photo | Address | Area | Beds / Baths | Price | Details |
|---|---|---|---|---|---|

|
#31
Cole St
Baltimore, MD 21223
|
1,000 sq. feet
|
1 baths 3 beds |
show details | |

|
#32
S Beechfield Ave
Baltimore, MD 21229
|
1,598 sq. feet
|
2 baths 4 beds |
show details | |

|
#33
Washburn Ave
Brooklyn, MD 21225
|
2,318 sq. feet
|
2 baths 4 beds |
show details | |

|
#34
Dogwood Rd
Gwynn Oak, MD 21207
|
1,128 sq. feet
|
2 baths 3 beds |
show details | |

|
#35
Cypress Grove Ct
Owings Mills, MD 21117
|
1,280 sq. feet
|
4 baths 3 beds |
show details | |

|
#36
Brehms Ln
Baltimore, MD 21206
|
1,224 sq. feet
|
2 baths 4 beds |
show details | |

|
#37
S Calhoun St
Baltimore, MD 21223
|
936 sq. feet
|
1 baths 3 beds |
show details | |

|
#38
Sheraton Rd
Randallstown, MD 21133
|
1,413 sq. feet
|
1 baths 3 beds |
show details | |

|
#39
Cedar Dr
Gwynn Oak, MD 21207
|
1,834 sq. feet
|
2 baths 4 beds |
show details | |

|
#40
Woodbrook Ave
Baltimore, MD 21217
|
- sq. feet
|
1 baths 3 beds |
show details |
| Photo | Address | Area | Beds / Baths | Price | Details |
|---|---|---|---|---|---|

|
#41
Woodbrook Ave
Baltimore, MD 21217
|
2,190 sq. feet
|
1 baths 3 beds |
show details | |

|
#42
Kathland Ave
Gwynn Oak, MD 21207
|
2,942 sq. feet
|
2 baths 5 beds |
show details | |

|
#43
Hamiltowne Cir
Rosedale, MD 21237
|
1,102 sq. feet
|
1 baths 3 beds |
show details | |

|
#44
Parke West Dr
Glen Burnie, MD 21061
|
1,488 sq. feet
|
2 baths 3 beds |
show details | |

|
#45
Marksworth Rd
Gwynn Oak, MD 21207
|
1,720 sq. feet
|
3 baths 3 beds |
show details | |

|
#46
Benton Heights Ave
Baltimore, MD 21206
|
1,326 sq. feet
|
2 baths 3 beds |
show details | |

|
#47
Cypress St
Curtis Bay, MD 21226
|
656 sq. feet
|
1 baths 1 beds |
show details | |

|
#48
E 29th St
Baltimore, MD 21218
|
1,200 sq. feet
|
1 baths 3 beds |
show details | |

|
#49
Gwynns Falls Pkwy
Baltimore, MD 21216
|
1,200 sq. feet
|
3 baths 4 beds |
show details | |

|
Check over 1 million property listings on Foreclosure.com!
|
browse all offers | |||


Median year apartment built: 1983
Household type by relationship:
Households: 31,343- Male householders: 4,081 (1,123 living alone), Female householders: 7,444 (2,746 living alone)
3,366 spouses (3,329 opposite-sex spouses), 801 unmarried partners, (750 opposite-sex unmarried partners), 9,695 children (9,353 natural, 18 adopted, 323 stepchildren), 1,843 grandchildren, 536 brothers or sisters, 1,153 parents, 172 foster children, 1,012 other relatives, 974 non-relatives
- In group quarters: 260
Size of family households: 2,583 2-persons, 1,803 3-persons, 1,620 4-persons, 658 5-persons, 280 6-persons, 348 7-or-more-persons.
Size of nonfamily households: 4,030 1-person, 530 2-persons, 44 3-persons.
3,422 married couples with children.
2,337 single-parent households (403 men, 1,934 women).
83.9% of residents of Milford Mill speak English at home.
5.6% of residents speak Spanish at home (59% speak English very well, 15% speak English well, 26% speak English not well).
2.4% of residents speak other Indo-European language at home (49% speak English very well, 35% speak English well, 17% speak English not well).
0.4% of residents speak Asian or Pacific Island language at home (73% speak English very well, 14% speak English well, 12% don't speak English at all).
6.3% of residents speak other language at home (79% speak English very well, 11% speak English well, 10% speak English not well).
Foreign born population: 5,362 (17.1%)
(46.8% of them are naturalized citizens)
| Here: | 7.3 |
| State: | 7.3 |
| Here: | 4.3 |
| State: | 4.2 |

- Bedrooms in owner-occupied houses and condos in Milford Mill, Maryland
- 0no bedroom
- 691 bedroom
- 8752 bedrooms
- 2,5503 bedrooms
- 1,6004 bedrooms
- 2145+ bedrooms

- Bedrooms in renter-occupied apartments in Milford Mill, Maryland
- 347no bedroom
- 1,4081 bedroom
- 3,2872 bedrooms
- 1,3603 bedrooms
- 1284 bedrooms
- 655+ bedrooms

- Cars and other vehicles available in Milford Mill in owner-occupied houses/condos
- 84no vehicle
- 1,9621 vehicle
- 1,7362 vehicles
- 8753 vehicles
- 4934 vehicles
- 1585+ vehicles

- Cars and other vehicles available in Milford Mill in renter-occupied apartments
- 885no vehicle
- 3,3861 vehicle
- 1,7722 vehicles
- 4683 vehicles
- 354 vehicles
- 485+ vehicles

- Rooms in owner-occupied houses in Milford Mill, Maryland
- 01 room
- 02 rooms
- 233 rooms
- 3854 rooms
- 6445 rooms
- 8116 rooms
- 8767 rooms
- 1,2288 rooms
- 1,3409+ rooms

- Rooms in renter-occupied apartments in Milford Mill, Maryland
- 3171 room
- 1122 rooms
- 8573 rooms
- 2,2594 rooms
- 1,4435 rooms
- 6566 rooms
- 4507 rooms
- 2538 rooms
- 2499+ rooms


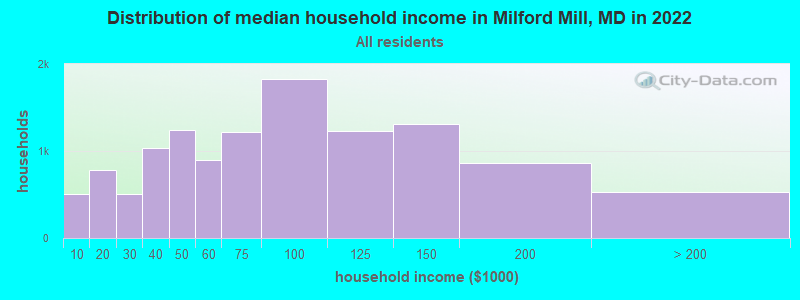
Milford Mill, MD household income distribution

- 510Less than $10,000
- 780$10,000 to $19,999
- 506$20,000 to $29,999
- 1,039$30,000 to $39,999
- 1,246$40,000 to $49,999
- 894$50,000 to $59,999
- 1,214$60,000 to $74,999
- 1,825$75,000 to $99,999
- 1,227$100,000 to $124,999
- 1,306$125,000 to $149,999
- 857$150,000 to $199,999
- 523$200,000 or more
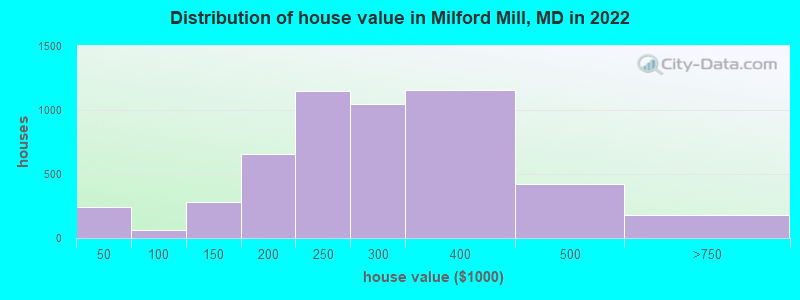
Home value of owner - occupied houses in 2022 in Milford Mill, MD
-
- 101Less than $10,000
- 14$15,000 to $19,999
- 113$20,000 to $24,999
- 14$30,000 to $34,999
- 30$70,000 to $79,999
- 32$80,000 to $89,999
- 166$100,000 to $124,999
- 115$125,000 to $149,999
- 372$150,000 to $174,999
- 285$175,000 to $199,999
- 1,150$200,000 to $249,999
- 1,043$250,000 to $299,999
- 1,157$300,000 to $399,999
- 422$400,000 to $499,999
- 169$500,000 to $749,999
- 7$750,000 to $999,999
Rent paid by renters in 2022 in Milford Mill, MD
-
- 10$100 to $149
- 101$150 to $199
- 39$200 to $249
- 37$250 to $299
- 34$300 to $349
- 8$350 to $399
- 6$400 to $449
- 179$500 to $549
- 65$550 to $599
- 49$650 to $699
- 8$700 to $749
- 17$750 to $799
- 55$800 to $899
- 300$900 to $999
- 1,520$1,000 to $1,249
- 2,005$1,250 to $1,499
- 1,516$1,500 to $1,999
- 117$2,000 to $2,499
- 175No cash rent


Percentage of workers working in this county: 49.3%
Number of people working at home: 2,172 (12.9% of all workers)
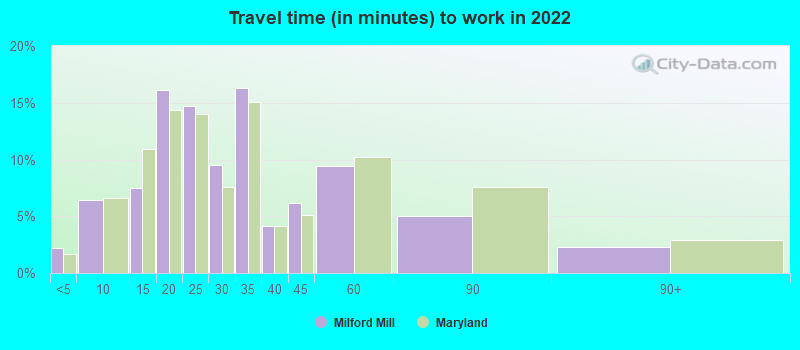
Travel time to work (commute)
- Less than 5 minutes: 127
- 5 to 9 minutes: 610
- 10 to 14 minutes: 1,315
- 15 to 19 minutes: 2,069
- 20 to 24 minutes: 1,574
- 25 to 29 minutes: 1,823
- 30 to 34 minutes: 3,527
- 35 to 39 minutes: 423
- 40 to 44 minutes: 768
- 45 to 59 minutes: 868
- 60 to 89 minutes: 1,022
- 90 or more minutes: 352
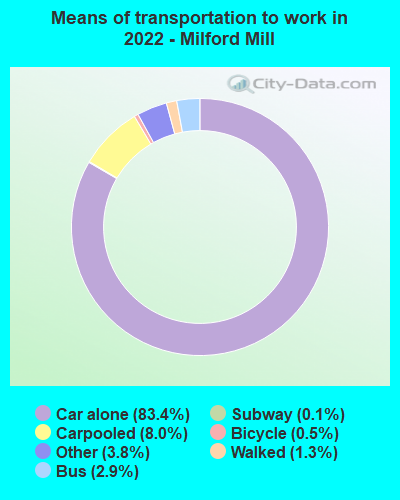
Means of transportation to work:
- Drove a car alone: 7,869 (67.3%)
- Carpooled: 869 (7.4%)
- Bus: 169 (1.4%)
- Long-distance train or commuter rail: 22 (0.2%)
- Taxi: 427 (3.7%)
- Bicycle: 38 (0.3%)
- Walked: 137 (1.2%)
- Worked at home: 2,172 (18.6%)

- Unemployment by race in 2022
- Unemployment rate for White non-Hispanic residents
- 0.7%Males
- 0.4%Females
- Unemployment rate for Black residents
- 6.9%Males
- 4.7%Females
- Unemployment rate for Asian residents
- 5.1%Males
- 3.6%Females
- Unemployment rate for other race residents
- 18.0%Males
- Unemployment rate for two or more race residents
- 5.7%Males
- 20.4%Females
- Unemployment rate for Hispanic or Latino residents
- 8.6%Males

- Year of entry for the foreign-born population in Milford Mill, Maryland
- 2,8402010 or later
- 1,3492000 to 2009
- 6801990 to 1999
- 3251980 to 1989
- 2891970 to 1979
- 183Before 1970

First ancestries reported:
- Nigerian: 2,014 (9.8%)
- American: 879 (4.3%)
- Ethiopian: 613 (3.0%)
- African: 521 (2.5%)
- Jamaican: 399 (1.9%)
- Ghanaian: 292 (1.4%)
- Trinidadian and Tobagonian: 271 (1.3%)
- Italian: 191 (0.9%)
- Irish: 141 (0.7%)
- German: 104 (0.5%)
- Iranian: 61 (0.3%)
- British West Indian: 56 (0.3%)
- West Indian: 52 (0.3%)
- English: 49 (0.2%)
- European: 35 (0.2%)
- Eastern European: 25 (0.1%)
- Haitian: 23 (0.1%)
- Moroccan: 22 (0.1%)
- Arab: 19 (0.09%)
- Barbadian: 19 (0.09%)
- Canadian: 15 (0.07%)
- Russian: 15 (0.07%)
- Czech: 10 (0.05%)
- Brazilian: 9 (0.04%)
- Scottish: 9 (0.04%)
- New Zealander: 5 (0.02%)
- Guyanese: 3 (0.01%)
Most common places of birth for foreign-born residents (%):
| Milford Mill: | 43.5% (2,352) |
| Maryland: | 4.6% (44,825) |
| Milford Mill: | 7.3% (396) |
| Maryland: | 12.0% (115,412) |
| Milford Mill: | 7.1% (382) |
| Maryland: | 2.8% (27,444) |
| Milford Mill: | 6.5% (352) |
| Maryland: | 1.2% (11,481) |
| Milford Mill: | 4.6% (247) |
| Maryland: | 1.8% (17,774) |
| Milford Mill: | 3.7% (200) |
| Maryland: | 1.8% (17,037) |
| Milford Mill: | 3.6% (195) |
| Maryland: | 4.4% (42,350) |
| Milford Mill: | 3.5% (190) |
| Maryland: | 3.2% (30,870) |
| Milford Mill: | 2.5% (136) |
| Maryland: | 0.3% (2,915) |
| Milford Mill: | 2.1% (116) |
| Maryland: | 3.5% (34,065) |
| Milford Mill: | 1.8% (99) |
| Maryland: | 6.4% (61,725) |
| Milford Mill: | 1.6% (85) |
| Maryland: | 0.6% (5,899) |
Place of birth for U.S.-born residents:
- This state: 19,220
- Other state: 5,825
- Northeast: 2,131
- Midwest: 356
- South: 3,067
- West: 258
83.8% of Milford Mill residents lived in the same house 1 years ago.
Out of people who lived in different houses, 31.9% lived in this county.
Out of people who lived in different counties, 51.7% lived in Maryland.
| Milford Mill: | 83.8% |
| State average: | 88.5% |
Education attainment for males 25 years and older:
- No schooling: 504
- Nursery to 4th grade: 29
- 5th and 6th grade: 70
- 7th and 8th grade: 95
- 9th grade: 26
- 10th grade: 188
- 11th grade: 200
- 12th grade, no diploma: 139
- High school graduate (or equivalency): 2,416
- Less than 1 year of college: 713
- Some college more than 1 year, no degree: 1,465
- Associate degree: 695
- Bachelor's degree: 1,567
- Master's degree: 296
- Professional school degree: 120
- Doctorate degree: 55

Education attainment for females 25 years and older:
- No schooling: 225
- Nursery to 4th grade: 18
- 5th and 6th grade: 0
- 7th and 8th grade: 50
- 9th grade: 73
- 10th grade: 87
- 11th grade: 144
- 12th grade, no diploma: 171
- High school graduate (or equivalency): 2,574
- Less than 1 year of college: 1,155
- Some college more than 1 year, no degree: 1,292
- Associate degree: 1,448
- Bachelor's degree: 2,624
- Master's degree: 1,608
- Professional school degree: 116
- Doctorate degree: 165


Housing units in structures:
- One, detached: 4,523
- One, attached: 2,386
- Two: 202
- 3 or 4: 147
- 5 to 9: 2,075
- 10 to 19: 2,279
- 20 to 49: 235
- 50 or more: 536
- Mobile homes: 13
Housing units lacking complete kitchen facilities in 2022: 1.0%
House/condo owner moved in on average 13 years ago
Renter moved in on average 3 years ago

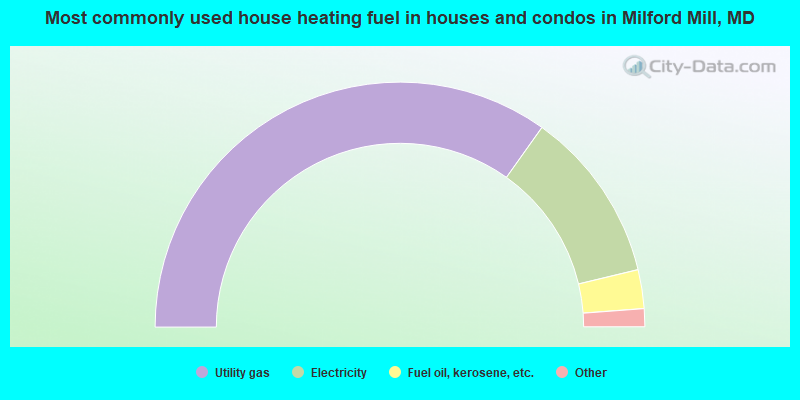
- 69.7%Utility gas
- 22.8%Electricity
- 5.1%Fuel oil, kerosene, etc.
- 1.5%Bottled, tank, or LP gas
- 0.5%Solar energy
- 0.4%No fuel used
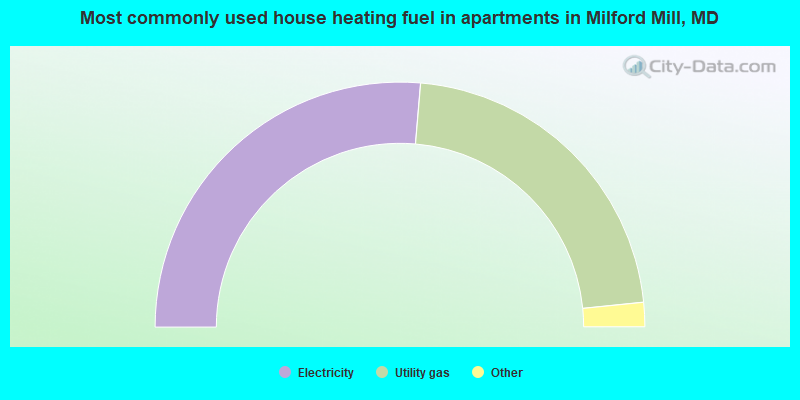
- 52.7%Electricity
- 44.1%Utility gas
- 1.7%Bottled, tank, or LP gas
- 0.8%Solar energy
- 0.2%Wood
- 0.2%Other fuel
- 0.2%No fuel used
- 0.1%Fuel oil, kerosene, etc.
Private vs. public school enrollment:
| Here: | 8.4% |
| Maryland: | 15.2% |
| Here: | 7.3% |
| Maryland: | 14.4% |
| Here: | 16.8% |
| Maryland: | 20.2% |


