Races in Milford Mill, Maryland (MD) Detailed Stats
Data:
Races - White alone (%)
Races - White alone (% change since 2000)
Races - Black alone (%)
Races - Black alone (% change since 2000)
Races - American Indian alone (%)
Races - American Indian alone (% change since 2000)
Races - Asian alone (%)
Races - Asian alone (% change since 2000)
Races - Hispanic (%)
Races - Hispanic (% change since 2000)
Races - Native Hawaiian and Other Pacific Islander alone (%)
Races - Native Hawaiian and Other Pacific Islander alone (% change since 2000)
Races - Two or more races(%)
Races - Two or more races(% change since 2000)
Races - Other race alone (%)
Races - Other race alone (% change since 2000)
Racial diversity
Place of birth - Born in state of residence (%)
Place of birth - Born in state of residence (%) - White
Place of birth - Born in state of residence (%) - Black or African American
Place of birth - Born in state of residence (%) - Asian
Place of birth - Born in state of residence (%) - Hispanic or Latino
Place of birth - Born in state of residence (%) - American Indian and Alaska Native
Place of birth - Born in state of residence (%) - Multirace
Place of birth - Born in state of residence (%) - Other Race
Place of birth - Born in other state (%)
Place of birth - Born in other state (%) - White
Place of birth - Born in other state (%) - Black or African American
Place of birth - Born in other state (%) - Asian
Place of birth - Born in other state (%) - Hispanic or Latino
Place of birth - Born in other state (%) - American Indian and Alaska Native
Place of birth - Born in other state (%) - Multirace
Place of birth - Born in other state (%) - Other Race
Place of birth - Native, outside of US (%)
Place of birth - Native, outside of US (%) - White
Place of birth - Native, outside of US (%) - Black or African American
Place of birth - Native, outside of US (%) - Asian
Place of birth - Native, outside of US (%) - Hispanic or Latino
Place of birth - Native, outside of US (%) - American Indian and Alaska Native
Place of birth - Native, outside of US (%) - Multirace
Place of birth - Native, outside of US (%) - Other Race
Place of birth - Foreign born (%)
Place of birth - Foreign born (%) - White
Place of birth - Foreign born (%) - Black or African American
Place of birth - Foreign born (%) - Asian
Place of birth - Foreign born (%) - Hispanic or Latino
Place of birth - Foreign born (%) - American Indian and Alaska Native
Place of birth - Foreign born (%) - Multirace
Place of birth - Foreign born (%) - Other Race
Residents speaking English at home (%)
Residents speaking English at home - Born in the United States (%)
Residents speaking English at home - Native, born elsewhere (%)
Residents speaking English at home - Foreign born (%)
Residents speaking Spanish at home (%)
Residents speaking Spanish at home - Born in the United States (%)
Residents speaking Spanish at home - Native, born elsewhere (%)
Residents speaking Spanish at home - Foreign born (%)
Residents speaking other language at home (%)
Residents speaking other language at home - Born in the United States (%)
Residents speaking other language at home - Native, born elsewhere (%)
Residents speaking other language at home - Foreign born (%)
Marital status - Never married (%)
Marital status - Now married (%)
Marital status - Separated (%)
Marital status - Widowed (%)
Marital status - Divorced (%)
Ancestries Reported - Arab (%)
Ancestries Reported - Czech (%)
Ancestries Reported - Danish (%)
Ancestries Reported - Dutch (%)
Ancestries Reported - English (%)
Ancestries Reported - French (%)
Ancestries Reported - French Canadian (%)
Ancestries Reported - German (%)
Ancestries Reported - Greek (%)
Ancestries Reported - Hungarian (%)
Ancestries Reported - Irish (%)
Ancestries Reported - Italian (%)
Ancestries Reported - Lithuanian (%)
Ancestries Reported - Norwegian (%)
Ancestries Reported - Polish (%)
Ancestries Reported - Portuguese (%)
Ancestries Reported - Russian (%)
Ancestries Reported - Scotch-Irish (%)
Ancestries Reported - Scottish (%)
Ancestries Reported - Slovak (%)
Ancestries Reported - Subsaharan African (%)
Ancestries Reported - Swedish (%)
Ancestries Reported - Swiss (%)
Ancestries Reported - Ukrainian (%)
Ancestries Reported - United States (%)
Ancestries Reported - Welsh (%)
Ancestries Reported - West Indian (%)
Ancestries Reported - Other (%)
Geographical mobility - Same house 1 year ago (%)
Geographical mobility - Same house 1 year ago (%) - White
Geographical mobility - Same house 1 year ago (%) - Black or African American
Geographical mobility - Same house 1 year ago (%) - Asian
Geographical mobility - Same house 1 year ago (%) - Hispanic or Latino
Geographical mobility - Same house 1 year ago (%) - American Indian and Alaska Native
Geographical mobility - Same house 1 year ago (%) - Multirace
Geographical mobility - Same house 1 year ago (%) - Other Race
Geographical mobility - Moved within same county (%)
Geographical mobility - Moved within same county (%) - White
Geographical mobility - Moved within same county (%) - Black or African American
Geographical mobility - Moved within same county (%) - Asian
Geographical mobility - Moved within same county (%) - Hispanic or Latino
Geographical mobility - Moved within same county (%) - American Indian and Alaska Native
Geographical mobility - Moved within same county (%) - Multirace
Geographical mobility - Moved within same county (%) - Other Race
Geographical mobility - Moved from different county within same state (%)
Geographical mobility - Moved from different county within same state (%) - White
Geographical mobility - Moved from different county within same state (%) - Black or African American
Geographical mobility - Moved from different county within same state (%) - Asian
Geographical mobility - Moved from different county within same state (%) - Hispanic or Latino
Geographical mobility - Moved from different county within same state (%) - American Indian and Alaska Native
Geographical mobility - Moved from different county within same state (%) - Multirace
Geographical mobility - Moved from different county within same state (%) - Other Race
Geographical mobility - Moved from different state (%)
Geographical mobility - Moved from different state (%) - White
Geographical mobility - Moved from different state (%) - Black or African American
Geographical mobility - Moved from different state (%) - Asian
Geographical mobility - Moved from different state (%) - Hispanic or Latino
Geographical mobility - Moved from different state (%) - American Indian and Alaska Native
Geographical mobility - Moved from different state (%) - Multirace
Geographical mobility - Moved from different state (%) - Other Race
Geographical mobility - Moved from abroad (%)
Geographical mobility - Moved from abroad (%) - White
Geographical mobility - Moved from abroad (%) - Black or African American
Geographical mobility - Moved from abroad (%) - Asian
Geographical mobility - Moved from abroad (%) - Hispanic or Latino
Geographical mobility - Moved from abroad (%) - American Indian and Alaska Native
Geographical mobility - Moved from abroad (%) - Multirace
Geographical mobility - Moved from abroad (%) - Other Race
Place of birth for the foreign-born population - Ireland (%)
Place of birth for the foreign-born population - Denmark (%)
Place of birth for the foreign-born population - Norway (%)
Place of birth for the foreign-born population - Sweden (%)
Place of birth for the foreign-born population - United Kingdom (%)
Place of birth for the foreign-born population - England (%)
Place of birth for the foreign-born population - Scotland (%)
Place of birth for the foreign-born population - Other Northern Europe (%)
Place of birth for the foreign-born population - Austria (%)
Place of birth for the foreign-born population - Belgium (%)
Place of birth for the foreign-born population - France (%)
Place of birth for the foreign-born population - Germany (%)
Place of birth for the foreign-born population - Netherlands (%)
Place of birth for the foreign-born population - Switzerland (%)
Place of birth for the foreign-born population - Other Western Europe (%)
Place of birth for the foreign-born population - Greece (%)
Place of birth for the foreign-born population - Italy (%)
Place of birth for the foreign-born population - Portugal (%)
Place of birth for the foreign-born population - Spain (%)
Place of birth for the foreign-born population - Other Southern Europe (%)
Place of birth for the foreign-born population - Albania (%)
Place of birth for the foreign-born population - Belarus (%)
Place of birth for the foreign-born population - Bosnia and Herzegovina (%)
Place of birth for the foreign-born population - Bulgaria (%)
Place of birth for the foreign-born population - Croatia (%)
Place of birth for the foreign-born population - Czechoslovakia (%)
Place of birth for the foreign-born population - Hungary (%)
Place of birth for the foreign-born population - Latvia (%)
Place of birth for the foreign-born population - Lithuania (%)
Place of birth for the foreign-born population - North Macedonia (Macedonia) (%)
Place of birth for the foreign-born population - Moldova (%)
Place of birth for the foreign-born population - Poland (%)
Place of birth for the foreign-born population - Romania (%)
Place of birth for the foreign-born population - Russia (%)
Place of birth for the foreign-born population - Serbia (%)
Place of birth for the foreign-born population - Ukraine (%)
Place of birth for the foreign-born population - Other Eastern Europe (%)
Place of birth for the foreign-born population - China (%)
Place of birth for the foreign-born population - Hong Kong (%)
Place of birth for the foreign-born population - Taiwan (%)
Place of birth for the foreign-born population - Japan (%)
Place of birth for the foreign-born population - Korea (%)
Place of birth for the foreign-born population - Other Eastern Asia (%)
Place of birth for the foreign-born population - Afghanistan (%)
Place of birth for the foreign-born population - Bangladesh (%)
Place of birth for the foreign-born population - India (%)
Place of birth for the foreign-born population - Iran (%)
Place of birth for the foreign-born population - Kazakhstan (%)
Place of birth for the foreign-born population - Nepal (%)
Place of birth for the foreign-born population - Pakistan (%)
Place of birth for the foreign-born population - Sri Lanka (%)
Place of birth for the foreign-born population - Uzbekistan (%)
Place of birth for the foreign-born population - Other South Central Asia (%)
Place of birth for the foreign-born population - Burma (%)
Place of birth for the foreign-born population - Cambodia (%)
Place of birth for the foreign-born population - Indonesia (%)
Place of birth for the foreign-born population - Laos (%)
Place of birth for the foreign-born population - Malaysia (%)
Place of birth for the foreign-born population - Philippines (%)
Place of birth for the foreign-born population - Singapore (%)
Place of birth for the foreign-born population - Thailand (%)
Place of birth for the foreign-born population - Vietnam (%)
Place of birth for the foreign-born population - Other South Eastern Asia (%)
Place of birth for the foreign-born population - Armenia (%)
Place of birth for the foreign-born population - Iraq (%)
Place of birth for the foreign-born population - Israel (%)
Place of birth for the foreign-born population - Jordan (%)
Place of birth for the foreign-born population - Kuwait (%)
Place of birth for the foreign-born population - Lebanon (%)
Place of birth for the foreign-born population - Saudi Arabia (%)
Place of birth for the foreign-born population - Syria (%)
Place of birth for the foreign-born population - Turkey (%)
Place of birth for the foreign-born population - Yemen (%)
Place of birth for the foreign-born population - Other Western Asia (%)
Place of birth for the foreign-born population - Eritrea (%)
Place of birth for the foreign-born population - Ethiopia (%)
Place of birth for the foreign-born population - Kenya (%)
Place of birth for the foreign-born population - Somalia (%)
Place of birth for the foreign-born population - Uganda (%)
Place of birth for the foreign-born population - Zimbabwe (%)
Place of birth for the foreign-born population - Other Eastern Africa (%)
Place of birth for the foreign-born population - Cameroon (%)
Place of birth for the foreign-born population - Congo (%)
Place of birth for the foreign-born population - Democratic Republic of Congo (Zaire) (%)
Place of birth for the foreign-born population - Other Middle Africa (%)
Place of birth for the foreign-born population - Egypt (%)
Place of birth for the foreign-born population - Morocco (%)
Place of birth for the foreign-born population - Sudan (%)
Place of birth for the foreign-born population - Other Northern Africa (%)
Place of birth for the foreign-born population - South Africa (%)
Place of birth for the foreign-born population - Other Southern Africa (%)
Place of birth for the foreign-born population - Cabo Verde (%)
Place of birth for the foreign-born population - Ghana (%)
Place of birth for the foreign-born population - Liberia (%)
Place of birth for the foreign-born population - Nigeria (%)
Place of birth for the foreign-born population - Senegal (%)
Place of birth for the foreign-born population - Sierra Leone (%)
Place of birth for the foreign-born population - Other Western Africa (%)
Place of birth for the foreign-born population - Australia (%)
Place of birth for the foreign-born population - New Zealand (%)
Place of birth for the foreign-born population - Fiji (%)
Place of birth for the foreign-born population - Micronesia (%)
Place of birth for the foreign-born population - Bahamas (%)
Place of birth for the foreign-born population - Barbados (%)
Place of birth for the foreign-born population - Cuba (%)
Place of birth for the foreign-born population - Dominica (%)
Place of birth for the foreign-born population - Dominican Republic (%)
Place of birth for the foreign-born population - Grenada (%)
Place of birth for the foreign-born population - Haiti (%)
Place of birth for the foreign-born population - Jamaica (%)
Place of birth for the foreign-born population - St. Vincent and the Grenadines (%)
Place of birth for the foreign-born population - Trinidad and Tobago (%)
Place of birth for the foreign-born population - West Indies (%)
Place of birth for the foreign-born population - Other Caribbean (%)
Place of birth for the foreign-born population - Belize (%)
Place of birth for the foreign-born population - Costa Rica (%)
Place of birth for the foreign-born population - El Salvador (%)
Place of birth for the foreign-born population - Guatemala (%)
Place of birth for the foreign-born population - Honduras (%)
Place of birth for the foreign-born population - Mexico (%)
Place of birth for the foreign-born population - Nicaragua (%)
Place of birth for the foreign-born population - Panama (%)
Place of birth for the foreign-born population - Other Central America (%)
Place of birth for the foreign-born population - Argentina (%)
Place of birth for the foreign-born population - Bolivia (%)
Place of birth for the foreign-born population - Brazil (%)
Place of birth for the foreign-born population - Chile (%)
Place of birth for the foreign-born population - Colombia (%)
Place of birth for the foreign-born population - Ecuador (%)
Place of birth for the foreign-born population - Guyana (%)
Place of birth for the foreign-born population - Peru (%)
Place of birth for the foreign-born population - Uruguay (%)
Place of birth for the foreign-born population - Venezuela (%)
Place of birth for the foreign-born population - Other South America (%)
Place of birth for the foreign-born population - Canada (%)
Place of birth for the foreign-born population - Other Northern America (%)
Place of birth for the foreign-born population - Other (%)
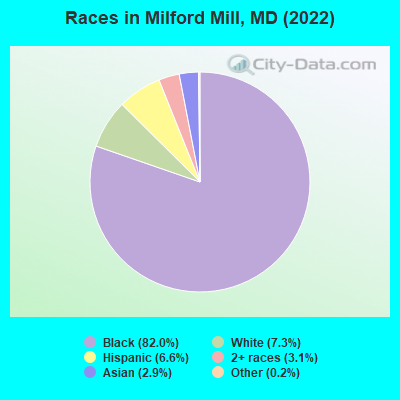
According to 2022 data, the most numerous races in Milford Mill, MD are White alone (2,285 residents), Black alone (25,710 residents), and Hispanic (2,065 residents). 84.1% of Milford Mill residents speak English at home. 17.2% of Milford Mill, MD residents are foreign-born (8.5% born in Africa, 5.4% born in Latin America), which is 7.1% greater than the foreign-born rate of 16.0% across the entire state of Maryland.
Race distribution in Milford Mill
2000 2022
3,286,547 62.1% White alone 1,464,735 27.7% Black alone 227,916 4.3% Hispanic 209,738 4.0% Asian alone 82,946 1.6% Two or more races 13,312 0.3% American Indian alone 9,379 0.2% Other race alone 1,913 0.04% Native Hawaiian and Other
2,906,492 47.1% White alone 1,800,914 29.2% Black alone 705,842 11.4% Hispanic 401,818 6.5% Asian alone 291,317 4.7% Two or more races 46,930 0.8% Other race alone 8,930 0.1% American Indian alone 2,417 0.04% Native Hawaiian and Other
Income and house value in Milford Mill Median household income in 2022 $69,620 White non-Hispanic householders$73,323 Black householders$68,624 Two or more races householdersMedian 2022 house value $258,633 White Non-Hispanic householders$272,600 Black or African American householders$235,997 American Indian or Alaska Native householders $244,666 Asian householders$277,176 Two or more races householders$296,682 Hispanic or Latino householders
Median age by race in Milford Mill
43.8 Median age for White residents43.8 44.6 35.5 Median age for Black or African American residents31.8 37.5 -768,041,236.3 Median age for American Indian / Alaska Native residents-867,632,849.4 -677,419,354.2 35.0 Median age for Asian residents32.6 37.5 -1,541,125,539.6 Median age for Native Hawaiian / Pacific Islander residents-790,901,136.6 -760,942,760.2 27.5 Median age for Other race residents16.3 37.3 41.2 Median age for Two or more races residents30.9 45.9 43.8 Median age for White alone residents43.5 46.3 30.4 Median age for Hispanic or Latino residents25.7 33.9
Owner/renter occupied households by race in Milford Mill
House owners and renters - White residents 635 58.4% Owner occupied453 41.6% Renter occupiedHouse owners and renters - Black or African American residents 4,780 48.5% Owner occupied5,075 51.5% Renter occupiedHouse owners and renters - Asian residents 97 25.9% Owner occupied277 74.1% Renter occupiedHouse owners and renters - Native Hawaiian / Pacific Islander residents 8 100.0% Owner occupiedHouse owners and renters - Other race residents 93 40.8% Owner occupied134 59.2% Renter occupiedHouse owners and renters - Two or more races residents 416 58.3% Owner occupied297 41.7% Renter occupiedHouse owners and renters - White alone residents 611 63.6% Owner occupied350 36.4% Renter occupiedHouse owners and renters - Hispanic or Latino residents 249 47.5% Owner occupied276 52.5% Renter occupied
Language usage in Milford Mill
English speakers - Total 84.1% of residents of Milford Mill speak English at home.
5.9% of residents speak Spanish at home 984 57.1% Speak English very well739 42.9% Speak English less than very well9.8% of residents speak other language at home 1,985 69.4% Speak English very well877 30.6% Speak English less than very well
English speakers - Born in the United States 96.1% of residents of Milford Mill speak English at home.
3.5% of residents speak Spanish at home 181 92.8% Speak English very well14 7.2% Speak English less than very well1.3% of residents speak other language at home 46 63.0% Speak English very well27 37.0% Speak English less than very well
English speakers - Native, born elsewhere 72.8% of residents of Milford Mill speak English at home.
24.0% of residents speak Spanish at home 189 93.1% Speak English very well14 6.9% Speak English less than very well5.0% of residents speak other language at home 24 57.1% Speak English very well18 42.9% Speak English less than very well
English speakers - Foreign-born 34.5% of residents of Milford Mill speak English at home.
17.0% of residents speak Spanish at home 198 22.0% Speak English very well704 78.0% Speak English less than very well49.7% of residents speak other language at home 1,852 70.0% Speak English very well793 30.0% Speak English less than very well
White (Caucasian) - Speak another language Native:
12.4% (278)Foreign-born:
97.4% (231)
Black or African American - Speak only English Native:
99.3% (20,408)Foreign-born:
47.8% (1,751)
Black or African American - Speak another language Native:
1.1% (222)Foreign-born:
52.8% (1,933)
Asian - Speak only English Native:
21.1% (41)Foreign-born:
19.1% (100)
Asian - Speak another language Native:
78.5% (154)Foreign-born:
81.7% (429)
Other race - Speak another language Native:
53.9% (339)Foreign-born:
100.0% (629)
Two or more races - Speak only English Native:
82.2% (1,007)Foreign-born:
32.3% (112)
Two or more races - Speak another language Native:
13.8% (170)Foreign-born:
63.7% (222)
White alone - Speak another language Native:
6.6% (131)Foreign-born:
100.0% (187)
Hispanic or Latino - Speak only English Native:
38.5% (439)Foreign-born:
1.5% (12)
Hispanic or Latino - Speak another language Native:
56.2% (642)Foreign-born:
98.6% (796)
Foreign-born residents in Milford Mill 5,401 residents are foreign born (8.5% Africa , 5.4% Latin America ).
This city:
17.2%Maryland:
15.7%
Marital status for residents in Milford Mill Marital status - White (Caucasian) population 15 years and over
Males 45.5% Never married44.2% Now married0.0% Separated4.2% Widowed6.1% DivorcedFemales 29.0% Never married42.7% Now married0.0% Separated9.5% Widowed18.7% DivorcedWomen who gave birth in the past 12 months Now married:
100.0% (16)Unmarried:
0.0% (0)
Women who did not give birth in the past 12 months Now married:
50.1% (319)Unmarried:
49.9% (318)
Marital status - Black or African American population 15 years and over
Males 48.9% Never married36.0% Now married1.9% Separated3.1% Widowed10.2% DivorcedFemales 45.1% Never married25.8% Now married4.0% Separated7.7% Widowed17.3% DivorcedWomen who gave birth in the past 12 months Now married:
3.3% (14)Unmarried:
96.7% (410)
Women who did not give birth in the past 12 months Now married:
26.4% (1,695)Unmarried:
73.6% (4,715)
Marital status - Asian population 15 years and over
Males 10.6% Never married89.4% Now married0.0% Separated0.0% Widowed0.0% DivorcedFemales 32.4% Never married64.5% Now married0.0% Separated3.2% Widowed0.0% DivorcedWomen who did not give birth in the past 12 months Now married:
67.4% (155)Unmarried:
32.6% (75)
Marital status - Other race population 15 years and over
Males 83.2% Never married16.8% Now married0.0% Separated0.0% Widowed0.0% DivorcedFemales 59.5% Never married40.5% Now married0.0% Separated0.0% Widowed0.0% DivorcedWomen who did not give birth in the past 12 months Now married:
26.6% (110)Unmarried:
73.4% (303)
Marital status - Two or more races population 15 years and over
Males 62.4% Never married25.7% Now married0.0% Separated11.8% Widowed0.0% DivorcedFemales 41.4% Never married26.4% Now married5.8% Separated0.0% Widowed26.4% DivorcedWomen who did not give birth in the past 12 months Now married:
9.9% (36)Unmarried:
90.1% (324)
Marital status - White alone, not Hispanic / Latino population 15 years and over
Males 44.0% Never married45.1% Now married0.0% Separated3.3% Widowed7.6% DivorcedFemales 26.7% Never married41.7% Now married0.0% Separated10.7% Widowed20.9% DivorcedWomen who gave birth in the past 12 months Now married:
100.0% (16)Unmarried:
0.0% (0)
Women who did not give birth in the past 12 months Now married:
49.7% (257)Unmarried:
50.3% (260)
Marital status - Hispanic or Latino population 15 years and over
Males 57.7% Never married39.6% Now married0.0% Separated2.8% Widowed0.0% DivorcedFemales 51.1% Never married44.6% Now married0.0% Separated0.0% Widowed4.3% DivorcedWomen who did not give birth in the past 12 months Now married:
30.4% (204)Unmarried:
69.6% (466)
Ancestries in Milford Mill
2,014 9.8% Nigerian879 4.3% American613 3.0% Ethiopian521 2.5% African399 1.9% Jamaican292 1.4% Ghanaian271 1.3% Trinidadian and Tobagonian191 0.9% Italian141 0.7% Irish104 0.5% German61 0.3% Iranian56 0.3% British West Indian52 0.3% West Indian49 0.2% English35 0.2% European25 0.1% Eastern European23 0.1% Haitian22 0.1% Moroccan19 0.09% Arab19 0.09% Barbadian15 0.07% Canadian15 0.07% Russian10 0.05% Czech9 0.04% Brazilian9 0.04% Scottish5 0.02% New Zealander3 0.01% Guyanese
Geographical mobility in Milford Mill Same house 1 year ago 2,057 79.4% White (Caucasian)21,758 84.2% Black or African American691 76.4% Asian9 100.0% Native Hawaiian / Pacific Islander1,137 94.8% Other race1,369 87.6% Two or more races1,743 76.9% White alone, not Hispanic / Latino2,010 99.2% Hispanic or LatinoMoved within same county 227 8.8% White / Caucasian2,024 7.8% Black or African American30 3.3% Asian123 7.9% Two or more races239 10.6% White alone, not Hispanic / Latino18 0.9% Hispanic or LatinoMoved within same state 202 7.8% White / Caucasian827 3.2% Black or African American43 4.8% Asian46 2.9% Two or more races184 8.1% White alone, not Hispanic / Latino27 1.4% Hispanic or LatinoMoved from different state 91 3.5% White / Caucasian609 2.4% Black or African American78 8.6% Asian91 4.0% White alone, not Hispanic / LatinoMoved from abroad 566 2.2% Black or African American101 11.2% Asian89 7.4% Other race108 5.3% Hispanic or Latino
Children Nativity (place of birth) in Milford Mill
Children under 6 years - Living with two parents Both parents native 606 97.2% Native17 2.8% Foreign-bornBoth parents foreign-born 380 82.3% Native82 17.7% Foreign-bornOne native, one foreign-born parent 136 100.0% NativeChildren under 6 years - Living with one parent Native parent 675 100.0% NativeForeign-born parent 302 94.8% Native17 5.2% Foreign-bornChildren 6 to 17 years - Living with two parents Both parents native 1,162 100.0% NativeBoth parents foreign-born 577 62.6% Native344 37.4% Foreign-bornOne native, one foreign-born parent 303 100.0% NativeChildren 6 to 17 years - Living with one parent Native parent 1,114 98.8% Native14 1.2% Foreign-bornForeign-born parent 702 66.9% Native347 33.1% Foreign-born
Grandparents responsible for own grandchildren in Milford Mill
Grandparents (30 to 59 years) White / Caucasian 8 100.0% Not responsible for grandchildrenBlack or African American 28 8.0% Responsible for grandchildren322 92.0% Not responsible for grandchildrenWhite alone, not Hispanic / Latino 7 100.0% Not responsible for grandchildrenGrandparents (60 years and over) White / Caucasian 104 100.0% Not responsible for grandchildrenBlack or African American 221 46.5% Responsible for grandchildren254 53.5% Not responsible for grandchildrenWhite alone, not Hispanic / Latino 108 100.0% Not responsible for grandchildren