Metropolitan Government, TN (Tennessee) Houses and Residents
| Metropolitan Government: | $434,700 |
| Tennessee: | $284,800 |
Total population: 620,916 (Urban population: 543,955, Rural population: 25,936 (486 farm, 25,450 nonfarm))
Houses: 252,977 (237,405 occupied: 131,384 owner occupied, 106,021 renter occupied)
| % of renters here: | 45% |
| State: | 33% |
Housing density: 504 houses/condos per square mile
Median price asked for vacant for-sale houses and condos in 2022 in this county: $876,649.
Median contract rent in 2022: $1,310 (lower quartile is $991, upper quartile is $1,730)
Median rent asked for vacant for-rent units in 2022: $1,339
Median gross rent in Metropolitan Government, TN in 2022: $1,463
Housing units in Metropolitan Government with a mortgage: 83,416 (9,691 second mortgage, 8,009 home equity loan, 342 both second mortgage and home equity loan)
Houses without a mortgage: 32,597
Compare current foreclosures near Metropolitan Government, TN:
| Photo | Address | Area | Beds / Baths | Price | Details |
|---|---|---|---|---|---|

|
#1
Delta Ave # B
Nashville, TN 37208
|
960 sq. feet
|
1 baths 2 beds |
show details | |

|
#2
Londonview Pl
Antioch, TN 37013
|
1,377 sq. feet
|
2 baths 3 beds |
show details | |

|
#3
Adair Rd
Nashville, TN 37214
|
1,600 sq. feet
|
2 baths 3 beds |
show details | |

|
#4
Chippendale Dr
Hendersonville, TN 37075
|
1,819 sq. feet
|
1 baths 4 beds |
show details | |

|
#5
Brickdale Ln
Nashville, TN 37207
|
- sq. feet
|
1 baths 3 beds |
show details | |

|
#6
Union St
Old Hickory, TN 37138
|
- sq. feet
|
2 baths 3 beds |
show details | |

|
#7
Augusta Dr
Hermitage, TN 37076
|
1,866 sq. feet
|
2 baths 4 beds |
show details | |

|
#8
High Rigger Dr
Nashville, TN 37217
|
1,996 sq. feet
|
3 baths 3 beds |
show details | |

|
#9
Windcrest Trl
Antioch, TN 37013
|
2,408 sq. feet
|
3 baths 4 beds |
show details | |

|
#10
Benton Smith Rd
Nashville, TN 37215
|
2,284 sq. feet
|
2 baths 3 beds |
show details |
| Photo | Address | Area | Beds / Baths | Price | Details |
|---|---|---|---|---|---|

|
#11
Shandale Dr
Madison, TN 37115
|
1,310 sq. feet
|
2 baths 3 beds |
show details | |

|
#12
Hardys Ct
Whites Creek, TN 37189
|
- sq. feet
|
2 baths 5 beds |
show details | |

|
#13
Millstream Dr
Nashville, TN 37218
|
2,051 sq. feet
|
3 baths 3 beds |
show details | |

|
#14
New Sawyer Brown Rd
Nashville, TN 37221
|
1,050 sq. feet
|
2 baths 4 beds |
show details | |

|
#15
Colo Trl
Antioch, TN 37013
|
2,284 sq. feet
|
1 baths 2 beds |
show details | |

|
#16
Murff Acres Rd
Ashland City, TN 37015
|
- sq. feet
|
2 baths 3 beds |
show details | |

|
#17
Williams Valley Dr
Madison, TN 37115
|
1,076 sq. feet
|
2 baths 3 beds |
show details | |

|
#18
Capitol View Dr
Nashville, TN 37207
|
1,896 sq. feet
|
2 baths 4 beds |
show details | |

|
#19
3rd Ave N
Nashville, TN 37208
|
1,222 sq. feet
|
2 baths 3 beds |
show details | |

|
#20
Cato Ridge Dr
Nashville, TN 37218
|
2,309 sq. feet
|
3 baths 4 beds |
show details |
| Photo | Address | Area | Beds / Baths | Price | Details |
|---|---|---|---|---|---|

|
#21
Libby Ln
Hermitage, TN 37076
|
1,118 sq. feet
|
2 baths 3 beds |
show details | |

|
#22
Alexander Cir
Nashville, TN 37208
|
993 sq. feet
|
2 baths 3 beds |
show details | |

|
#23
Gillespie Dr
Antioch, TN 37013
|
988 sq. feet
|
1 baths 3 beds |
show details | |

|
#24
Mount Hood Dr
Antioch, TN 37013
|
1,636 sq. feet
|
3 baths 4 beds |
show details | |

|
#25
Baton Rouge Dr
Hermitage, TN 37076
|
1,989 sq. feet
|
2 baths 3 beds |
show details | |

|
#26
Saunders Ave
Nashville, TN 37216
|
1,734 sq. feet
|
1 baths 2 beds |
show details | |

|
#27
S Lakeridge Pl
Nashville, TN 37214
|
- sq. feet
|
2 baths 3 beds |
show details | |

|
#28
N New Hope Rd
Hermitage, TN 37076
|
2,619 sq. feet
|
2 baths 4 beds |
show details | |

|
#29
Heritage Cir
Madison, TN 37115
|
1,380 sq. feet
|
1 baths 3 beds |
show details | |

|
#30
Tammany Dr
Nashville, TN 37206
|
1,584 sq. feet
|
2 baths 3 beds |
show details |
| Photo | Address | Area | Beds / Baths | Price | Details |
|---|---|---|---|---|---|

|
#31
Kinsington Dr
Nashville, TN 37216
|
1,244 sq. feet
|
3 baths 2 beds |
show details | |

|
#32
Ravine Dr
Nashville, TN 37217
|
2,172 sq. feet
|
3 baths 3 beds |
show details | |

|
#33
Nickleby Down
Brentwood, TN 37027
|
2,687 sq. feet
|
4 baths 3 beds |
show details | |

|
#34
Bournemouth Ln
Hermitage, TN 37076
|
5,075 sq. feet
|
4 baths 4 beds |
show details | |

|
#35
Iverson Ave
Nashville, TN 37216
|
2,386 sq. feet
|
3 baths 4 beds |
show details | |

|
#36
Harbor Dr
Hendersonville, TN 37075
|
2,998 sq. feet
|
3 baths 3 beds |
show details | |

|
#37
Jenna Lee Cir
Madison, TN 37115
|
1,202 sq. feet
|
2 baths 2 beds |
show details | |

|
#38
Laurel Oak Dr
Antioch, TN 37013
|
1,214 sq. feet
|
2 baths 3 beds |
show details | |

|
#39
Pima Rd
Madison, TN 37115
|
1,581 sq. feet
|
1 baths 3 beds |
show details | |

|
#40
Cimarron Way
Antioch, TN 37013
|
1,387 sq. feet
|
1 baths 3 beds |
show details |
| Photo | Address | Area | Beds / Baths | Price | Details |
|---|---|---|---|---|---|

|
#41
Brentmeadow Cir
Madison, TN 37115
|
1,316 sq. feet
|
2 baths 3 beds |
show details | |

|
#42
Hillcrest Dr
Madison, TN 37115
|
1,166 sq. feet
|
1 baths 3 beds |
show details | |

|
#43
Brentmeadow Cir
Madison, TN 37115
|
956 sq. feet
|
2 baths 3 beds |
show details | |

|
#44
Fawn Creek Pass
Nashville, TN 37214
|
1,498 sq. feet
|
2 baths 3 beds |
show details | |

|
#45
Barclay Square Dr
Antioch, TN 37013
|
1,602 sq. feet
|
1 baths 3 beds |
show details | |

|
#46
Bonnamere Dr
Hermitage, TN 37076
|
1,325 sq. feet
|
1 baths 3 beds |
show details | |

|
#47
Pinwheel Ct
Antioch, TN 37013
|
2,542 sq. feet
|
3 baths 3 beds |
show details | |

|
#48
Cadogan Ct
Antioch, TN 37013
|
3,497 sq. feet
|
3 baths 3 beds |
show details | |

|
#49
Craftwood Dr
Antioch, TN 37013
|
1,937 sq. feet
|
2 baths 3 beds |
show details | |

|
Check over 1 million property listings on Foreclosure.com!
|
browse all offers | |||

Household type by relationship:
Households: 600,811- In family households: 454,544 (88,937 male householders, 56,229 female householders)
95,093 spouses, 156,428 children (146,751 natural, 3,595 adopted, 6,082 stepchildren), 13,723 grandchildren, 8,927 brothers or sisters, 5,523 parents, foster children, 10,609 other relatives, 16,003 non-relatives
- In nonfamily households: 146,267 (52,098 male householders (38,614 living alone)), 62,235 female householders (50,889 living alone)), 31,934 nonrelatives
- In group quarters: 25,870 (9,226 institutionalized population)
69,657 married couples with children.
40,462 single-parent households (6,197 men, 34,265 women).
90.2% of residents of Metropolitan Government speak English at home.
4.9% of residents speak Spanish at home (47% speak English very well, 16% speak English well, 24% speak English not well, 13% don't speak English at all).
2.4% of residents speak other Indo-European language at home (65% speak English very well, 20% speak English well, 13% speak English not well, 2% don't speak English at all).
1.5% of residents speak Asian or Pacific Island language at home (43% speak English very well, 32% speak English well, 21% speak English not well, 4% don't speak English at all).
0.9% of residents speak other language at home (57% speak English very well, 29% speak English well, 11% speak English not well, 2% don't speak English at all).
Foreign born population: 89,518 (12.6%)
(35.2% of them are naturalized citizens)
| Here: | 6.3 |
| State: | 6.5 |
| Here: | 4.0 |
| State: | 4.4 |

- Bedrooms in owner-occupied houses and condos in Metropolitan Government, Tennessee
- 212no bedroom
- 3,4341 bedroom
- 31,7742 bedrooms
- 68,8283 bedrooms
- 23,2094 bedrooms
- 3,9275+ bedrooms

- Bedrooms in renter-occupied apartments in Metropolitan Government, Tennessee
- 4,393no bedroom
- 36,4301 bedroom
- 46,7972 bedrooms
- 15,3443 bedrooms
- 2,6644 bedrooms
- 3935+ bedrooms

- Cars and other vehicles available in Metropolitan Government in owner-occupied houses/condos
- 4,333no vehicle
- 41,3601 vehicle
- 59,5282 vehicles
- 19,4843 vehicles
- 5,0494 vehicles
- 1,6305+ vehicles

- Cars and other vehicles available in Metropolitan Government in renter-occupied apartments
- 16,419no vehicle
- 54,7981 vehicle
- 28,1822 vehicles
- 5,0343 vehicles
- 1,1844 vehicles
- 4045+ vehicles

- Rooms in owner-occupied houses in Metropolitan Government, Tennessee
- 611 room
- 8642 rooms
- 3,4013 rooms
- 11,2904 rooms
- 27,5695 rooms
- 32,4816 rooms
- 23,9347 rooms
- 15,5898 rooms
- 16,1959+ rooms

- Rooms in renter-occupied apartments in Metropolitan Government, Tennessee
- 3,6861 room
- 11,0732 rooms
- 23,4243 rooms
- 32,8434 rooms
- 20,8895 rooms
- 8,8456 rooms
- 2,9687 rooms
- 1,3738 rooms
- 9209+ rooms


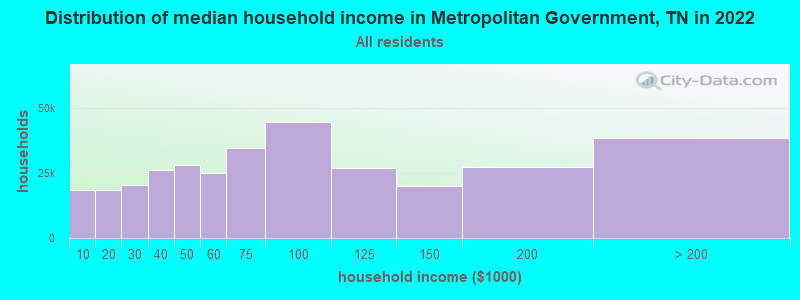
Metropolitan Government, TN household income distribution

- 18,594Less than $10,000
- 18,365$10,000 to $19,999
- 20,166$20,000 to $29,999
- 26,136$30,000 to $39,999
- 28,153$40,000 to $49,999
- 25,065$50,000 to $59,999
- 34,394$60,000 to $74,999
- 44,520$75,000 to $99,999
- 26,896$100,000 to $124,999
- 19,898$125,000 to $149,999
- 27,078$150,000 to $199,999
- 38,526$200,000 or more
Percentage of workers working in this county: 84.6%
Number of people working at home: 86,729 (21.8% of all workers)
Travel time to work (commute)
- Less than 5 minutes: 5,637
- 5 to 9 minutes: 23,893
- 10 to 14 minutes: 37,962
- 15 to 19 minutes: 52,349
- 20 to 24 minutes: 55,587
- 25 to 29 minutes: 19,747
- 30 to 34 minutes: 46,424
- 35 to 39 minutes: 5,721
- 40 to 44 minutes: 6,151
- 45 to 59 minutes: 12,834
- 60 to 89 minutes: 6,240
- 90 or more minutes: 4,568
Means of transportation to work:
- Drove a car alone: 224,843 (78.6%)
- Carpooled: 38,111 (13.3%)
- Bus or trolley bus: 4,654 (1.6%)
- Subway or elevated: 34 (0.0%)
- Railroad: 7 (0.0%)
- Ferryboat: 9 (0.0%)
- Taxi: 334 (0.1%)
- Motorcycle: 217 (0.1%)
- Bicycle: 405 (0.1%)
- Walked: 6,679 (2.3%)
- Other means: 1,820 (0.6%)
- Worked at home: 8,867 (3.1%)


- Year of entry for the foreign-born population in Metropolitan Government, Tennessee
- 17,7211995 to March 2000
- 8,8521990 to 1994
- 4,6061985 to 1989
- 3,0721980 to 1984
- 1,7831975 to 1979
- 9751970 to 1974
- 8281965 to 1969
- 1,759Before 1965
Most common places of birth for foreign-born residents (%):
| Metropolitan Government: | 26.6% (10,523) |
| Tennessee: | 28.1% (44,682) |
| Metropolitan Government: | 4.7% (1,853) |
| Tennessee: | 1.7% (2,766) |
| Metropolitan Government: | 3.5% (1,390) |
| Tennessee: | 3.7% (5,949) |
| Metropolitan Government: | 3.4% (1,357) |
| Tennessee: | 4.8% (7,701) |
| Metropolitan Government: | 3.2% (1,257) |
| Tennessee: | 2.3% (3,669) |
| Metropolitan Government: | 3.0% (1,192) |
| Tennessee: | 1.3% (2,006) |
| Metropolitan Government: | 3.0% (1,185) |
| Tennessee: | 3.8% (6,106) |
| Metropolitan Government: | 2.7% (1,069) |
| Tennessee: | 4.4% (6,981) |
| Metropolitan Government: | 2.4% (937) |
| Tennessee: | 1.1% (1,777) |
| Metropolitan Government: | 2.2% (878) |
| Tennessee: | 2.7% (4,288) |
| Metropolitan Government: | 2.2% (858) |
| Tennessee: | 5.2% (8,316) |
| Metropolitan Government: | 2.2% (856) |
| Tennessee: | 0.9% (1,385) |
| Metropolitan Government: | 2.1% (850) |
| Tennessee: | 1.8% (2,843) |
| Metropolitan Government: | 2.0% (790) |
| Tennessee: | 1.0% (1,540) |
| Metropolitan Government: | 1.9% (770) |
| Tennessee: | 3.6% (5,726) |
| Metropolitan Government: | 1.9% (749) |
| Tennessee: | 2.3% (3,660) |
| Metropolitan Government: | 1.5% (612) |
| Tennessee: | 2.6% (4,078) |
Place of birth for U.S.-born residents:
- This state: 329,289
- Other state: 196,176
- Northeast: 24,812
- Midwest: 55,826
- South: 97,813
- West: 17,725
47% of Metropolitan Government residents lived in the same house 5 years ago.
Out of people who lived in different houses, 57% lived in this county.
Out of people who lived in different counties, 36% lived in Tennessee.
Education attainment for males 25 years and older:
- No schooling: 1,808
- Nursery to 4th grade: 879
- 5th and 6th grade: 2,593
- 7th and 8th grade: 5,347
- 9th grade: 4,356
- 10th grade: 5,489
- 11th grade: 6,113
- 12th grade, no diploma: 7,390
- High school graduate (or equivalency): 42,050
- Less than 1 year of college: 9,001
- Some college more than 1 year, no degree: 28,477
- Associate degree: 7,660
- Bachelor's degree: 37,104
- Master's degree: 10,643
- Professional school degree: 6,149
- Doctorate degree: 3,385

Education attainment for females 25 years and older:
- No schooling: 1,559
- Nursery to 4th grade: 778
- 5th and 6th grade: 2,175
- 7th and 8th grade: 6,510
- 9th grade: 4,894
- 10th grade: 6,627
- 11th grade: 6,452
- 12th grade, no diploma: 6,831
- High school graduate (or equivalency): 51,055
- Less than 1 year of college: 13,700
- Some college more than 1 year, no degree: 30,149
- Associate degree: 10,696
- Bachelor's degree: 38,844
- Master's degree: 14,133
- Professional school degree: 3,249
- Doctorate degree: 1,638


Housing units in structures:
- One, detached: 133,369
- One, attached: 17,560
- Two: 15,218
- 3 or 4: 10,063
- 5 to 9: 17,900
- 10 to 19: 22,771
- 20 to 49: 11,570
- 50 or more: 20,330
- Mobile homes: 4,170
- Boats, RVs, vans, etc.: 26
Median worth of mobile homes: $69,200
Housing units lacking complete kitchen facilities: 0.7%

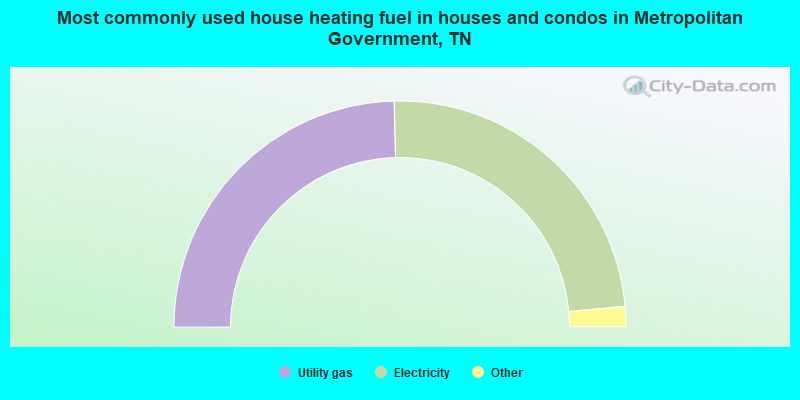
- 49.2%Utility gas
- 47.9%Electricity
- 1.9%Bottled, tank, or LP gas
- 0.4%Fuel oil, kerosene, etc.
- 0.4%Wood
- 0.1%No fuel used
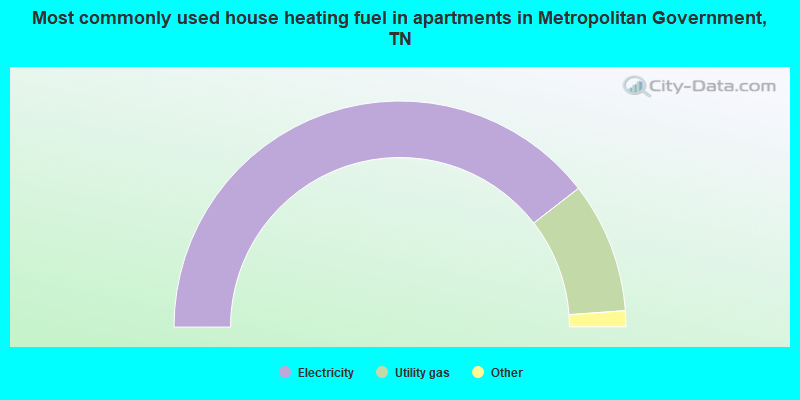
- 79.0%Electricity
- 18.7%Utility gas
- 0.9%Bottled, tank, or LP gas
- 0.6%No fuel used
- 0.6%Fuel oil, kerosene, etc.
Private vs. public school enrollment:
| Here: | 17.3% |
| Tennessee: | 9.5% |
| Here: | 17.9% |
| Tennessee: | 10.4% |
| Here: | 45.9% |
| Tennessee: | 22.8% |


