Races in Metropolitan Government, Tennessee (TN) Detailed Stats
Ancestries, Foreign-born residents, place of birth
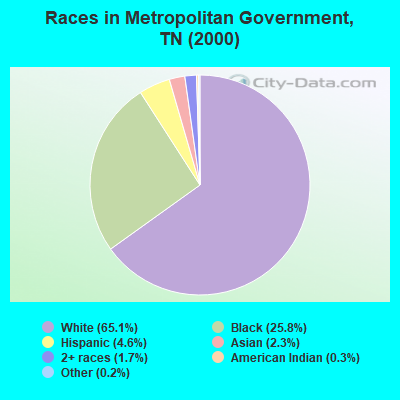
Race distribution in Metropolitan Government

- 371,15065.1%White alone
- 146,93925.8%Black alone
- 26,0914.6%Hispanic
- 13,1862.3%Asian alone
- 9,7261.7%Two or more races
- 1,4970.3%American Indian alone
- 9380.2%Other race alone
- 3640.06%Native Hawaiian and Other
Pacific Islander alone
2000
2022
-
- 4,505,93079.2%White alone
- 928,20416.3%Black alone
- 123,8382.2%Hispanic
- 54,8241.0%Two or more races
- 56,0771.0%Asian alone
- 13,8200.2%American Indian alone
- 4,7800.08%Other race alone
- 1,8100.03%Native Hawaiian and Other
Pacific Islander alone

-
- 5,070,02671.9%White alone
- 1,089,73815.5%Black alone
- 442,6296.3%Hispanic
- 279,3814.0%Two or more races
- 131,8171.9%Asian alone
- 26,9720.4%Other race alone
- 6,3870.09%American Indian alone
- 4,3890.06%Native Hawaiian and Other
Pacific Islander alone

Income and house value in Metropolitan Government
- Median household income in 2022
- $83,642White non-Hispanic householders
- $52,066Black householders
- $56,726American Indian and Alaska Native householders
- $74,858Asian householders
- $148,657Native Hawaiian and other Pacific Islander householders
- $45,625Some other race householders
- $59,566Two or more races householders
- $54,527Hispanic or Latino race householders
- Median 2022 house value
- $472,384White Non-Hispanic householders
- $334,970Black or African American householders
- $352,480American Indian or Alaska Native householders
- $472,003Asian householders
- $577,823Native Hawaiian and other Pacific Islander householders
- $360,092Some other race householders
- $405,770Two or more races householders
- $371,131Hispanic or Latino householders
Household income for White non-Hispanic householders

Household income for Black householders

Household income for American Indian and Alaska Native householders

Household income for Asian householders

Household income for Native Hawaiian and other Pacific Islander householders

Household income for Two or more races householders

Household income for Hispanic or Latino race householders

Zip code: 37210