Meridian, ID (Idaho) Houses and Residents
| Meridian: | $571,100 |
| Idaho: | $432,500 |
Total population: 87,743 (Urban population: 34,858, Rural population: 0)
Houses: 51,518 (48,434 occupied: 34,227 owner occupied, 14,207 renter occupied)
| % of renters here: | 29% |
| State: | 28% |
Housing density: 4,370 houses/condos per square mile
Median price asked for vacant for-sale houses and condos in 2022: $2,239,713.
Median contract rent in 2022: $1,679 (lower quartile is $1,290, upper quartile is $1,974)
Median rent asked for vacant for-rent units in 2022: $5,701
Median gross rent in Meridian, ID in 2022: $1,789
Housing units in Meridian with a mortgage: 24,763 (2,674 second mortgage, 458 home equity loan, 2,014 both second mortgage and home equity loan)
Houses without a mortgage: 695
Median household income for houses/condos with a mortgage: $121,199
Median household income for apartments without a mortgage: $72,706
Median monthly housing costs: $1,571
Compare current foreclosures in Meridian, ID:
| Photo | Address | Area | Beds / Baths | Price | Details |
|---|---|---|---|---|---|

|
#1
E Mahoney St
Meridian, ID 83646
|
2,623 sq. feet
|
2 baths 4 beds |
$599,900
|
show details |

|
#2
S Andros Way
Meridian, ID 83642
|
4,682 sq. feet
|
4 baths 5 beds |
$875,000
|
show details |

|
#3
S Bosch Way
Meridian, ID 83642
|
2,508 sq. feet
|
3 baths 4 beds |
show details | |

|
#4
N. O Conner Ave
Meridian, ID 83646
|
3,321 sq. feet
|
3 baths 5 beds |
show details | |

|
#5
N Morpheus Way
Meridian, ID 83646
|
3,562 sq. feet
|
3 baths 5 beds |
show details | |

|
#6
N Haven Cove Ave
Meridian, ID 83642
|
1,430 sq. feet
|
2 baths 3 beds |
show details | |

|
#7
N Teare Ave
Meridian, ID 83646
|
1,856 sq. feet
|
2 baths 4 beds |
show details | |

|
#8
N Spurwing Way
Meridian, ID 83646
|
2,217 sq. feet
|
2 baths 4 beds |
show details | |

|
#9
E Clarene Ct
Meridian, ID 83646
|
2,318 sq. feet
|
2 baths 3 beds |
show details | |

|
#10
N Crestley Ave
Meridian, ID 83642
|
1,312 sq. feet
|
2 baths 3 beds |
show details |
| Photo | Address | Area | Beds / Baths | Price | Details |
|---|---|---|---|---|---|

|
#11
S Labrador Pl
Meridian, ID 83642
|
1,795 sq. feet
|
2 baths 3 beds |
show details | |

|
#12
W Patel Dr
Meridian, ID 83646
|
1,806 sq. feet
|
3 baths 4 beds |
show details | |

|
#13
S Ice Bear Way
Meridian, ID 83642
|
2,021 sq. feet
|
3 baths 4 beds |
show details | |

|
#14
W Willard St
Meridian, ID 83642
|
1,607 sq. feet
|
2 baths 3 beds |
show details | |

|
#15
E Claybourne Dr
Meridian, ID 83646
|
1,524 sq. feet
|
2 baths 3 beds |
show details | |

|
#16
N Glennfield Way
Meridian, ID 83646
|
1,865 sq. feet
|
2 baths 3 beds |
show details | |

|
#17
S Labrador Pl
Meridian, ID 83642
|
1,750 sq. feet
|
2 baths 4 beds |
show details | |

|
#18
W Indian Rocks St
Meridian, ID 83646
|
1,427 sq. feet
|
2 baths 3 beds |
show details | |

|
#19
W Wave Dr
Meridian, ID 83642
|
1,481 sq. feet
|
2 baths 3 beds |
show details | |

|
#20
W Forecast St
Meridian, ID 83642
|
2,678 sq. feet
|
3 baths 4 beds |
show details |
| Photo | Address | Area | Beds / Baths | Price | Details |
|---|---|---|---|---|---|

|
#21
N Crestmont Dr
Meridian, ID 83646
|
1,098 sq. feet
|
1 baths 3 beds |
show details | |

|
#22
E Mercutio Dr
Meridian, ID 83642
|
3,050 sq. feet
|
2 baths 4 beds |
show details | |

|
#23
N Silverleaf Way
Meridian, ID 83646
|
1,956 sq. feet
|
2 baths 3 beds |
show details | |

|
#24
N Valam Ave
Meridian, ID 83646
|
1,610 sq. feet
|
2 baths 3 beds |
show details | |

|
#25
W Los Flores Dr
Meridian, ID 83646
|
3,082 sq. feet
|
2 baths 4 beds |
show details | |

|
#26
W Barrett St
Meridian, ID 83642
|
865 sq. feet
|
1 baths 2 beds |
show details | |

|
#27
E Bentley Dr
Meridian, ID 83642
|
1,754 sq. feet
|
1 baths 4 beds |
show details | |

|
#28
W Grand Teton Dr
Meridian, ID 83646
|
2,512 sq. feet
|
4 baths 4 beds |
show details | |

|
#29
W Snyder Dr
Meridian, ID 83642
|
1,383 sq. feet
|
2 baths 3 beds |
show details | |

|
#30
W Alderstone St
Meridian, ID 83646
|
2,616 sq. feet
|
2 baths 4 beds |
show details |
| Photo | Address | Area | Beds / Baths | Price | Details |
|---|---|---|---|---|---|

|
#31
N Mendelson Ave
Meridian, ID 83646
|
2,673 sq. feet
|
2 baths 4 beds |
show details | |

|
#32
W Forecast St
Meridian, ID 83642
|
1,546 sq. feet
|
2 baths 4 beds |
show details | |

|
#33
W Everest St
Meridian, ID 83646
|
- sq. feet
|
- baths - beds |
show details | |

|
#34
E Ada St
Meridian, ID 83642
|
- sq. feet
|
- baths - beds |
show details | |

|
#35
E Beamer Ct
Meridian, ID 83642
|
- sq. feet
|
- baths - beds |
show details | |

|
#36
E Franklin Rd # C104
Meridian, ID 83642
|
- sq. feet
|
- baths - beds |
show details | |

|
#37
E Collingwood St
Meridian, ID 83642
|
- sq. feet
|
- baths - beds |
show details | |

|
#38
E Wakely Ct
Meridian, ID 83646
|
- sq. feet
|
- baths - beds |
show details | |

|
#39
E Ashlar Dr
Meridian, ID 83642
|
- sq. feet
|
- baths - beds |
show details | |

|
#40
W State St # 110
Meridian, ID 83642
|
- sq. feet
|
- baths - beds |
show details |
| Photo | Address | Area | Beds / Baths | Price | Details |
|---|---|---|---|---|---|

|
#41
W Chair Lift Ln
Meridian, ID 83642
|
- sq. feet
|
- baths - beds |
show details | |

|
#42
E Adelaide St
Meridian, ID 83642
|
- sq. feet
|
- baths - beds |
show details | |

|
#43
W Waukesha St
Meridian, ID 83646
|
- sq. feet
|
- baths - beds |
show details | |

|
#44
E Decameron Ln
Meridian, ID 83642
|
- sq. feet
|
- baths - beds |
show details | |

|
#45
N Elsinore Ave, Apt E201
Meridian, ID 83646
|
- sq. feet
|
- baths - beds |
show details | |

|
#46
S Natural Way
Meridian, ID 83642
|
- sq. feet
|
- baths - beds |
show details | |

|
#47
S Ruby Rapids Pl
Meridian, ID 83642
|
- sq. feet
|
- baths - beds |
show details | |

|
#48
E Fairview Ave # A102
Meridian, ID 83642
|
- sq. feet
|
- baths - beds |
show details | |

|
#49
W Idaho Ave
Meridian, ID 83642
|
- sq. feet
|
- baths - beds |
show details | |

|
Check over 1 million property listings on Foreclosure.com!
|
browse all offers | |||

Latest news about housing in Meridian, ID collected exclusively by city-data.com from local newspapers, TV, and radio stations


Median year apartment built: 2007
Household type by relationship:
Households: 129,730- Male householders: 26,433 (5,182 living alone), Female householders: 22,001 (5,782 living alone)
28,019 spouses (27,858 opposite-sex spouses), 3,503 unmarried partners, (3,277 opposite-sex unmarried partners), 39,442 children (36,800 natural, 666 adopted, 1,976 stepchildren), 601 grandchildren, 792 brothers or sisters, 1,872 parents, 458 foster children, 1,445 other relatives, 4,338 non-relatives
- In group quarters: 826
Size of family households: 13,001 2-persons, 8,440 3-persons, 6,932 4-persons, 3,372 5-persons, 1,322 6-persons, 651 7-or-more-persons.
Size of nonfamily households: 10,964 1-person, 2,813 2-persons, 882 3-persons, 57 4-persons.
25,496 married couples with children.
5,651 single-parent households (887 men, 4,764 women).
92.5% of residents of Meridian speak English at home.
3.9% of residents speak Spanish at home (69% speak English very well, 11% speak English well, 16% speak English not well, 4% don't speak English at all).
1.2% of residents speak other Indo-European language at home (73% speak English very well, 16% speak English well, 9% speak English not well, 2% don't speak English at all).
1.3% of residents speak Asian or Pacific Island language at home (56% speak English very well, 28% speak English well, 10% speak English not well, 7% don't speak English at all).
0.9% of residents speak other language at home (80% speak English very well, 18% speak English well, 1% speak English not well, 1% don't speak English at all).
Foreign born population: 7,530 (5.8%)
(44.7% of them are naturalized citizens)
| Here: | 6.7 |
| State: | 6.5 |
| Here: | 4.5 |
| State: | 4.4 |

- Bedrooms in owner-occupied houses and condos in Meridian, Idaho
- 0no bedroom
- 961 bedroom
- 1,8232 bedrooms
- 16,3413 bedrooms
- 11,4284 bedrooms
- 4,5395+ bedrooms

- Bedrooms in renter-occupied apartments in Meridian, Idaho
- 564no bedroom
- 1,7881 bedroom
- 5,1262 bedrooms
- 3,8083 bedrooms
- 2,7444 bedrooms
- 1775+ bedrooms

- Cars and other vehicles available in Meridian in owner-occupied houses/condos
- 739no vehicle
- 5,8251 vehicle
- 16,0982 vehicles
- 8,2943 vehicles
- 2,7104 vehicles
- 5615+ vehicles

- Cars and other vehicles available in Meridian in renter-occupied apartments
- 904no vehicle
- 5,8461 vehicle
- 5,1872 vehicles
- 1,9623 vehicles
- 2484 vehicles
- 605+ vehicles

- Rooms in owner-occupied houses in Meridian, Idaho
- 01 room
- 02 rooms
- 2863 rooms
- 2,7664 rooms
- 4,6855 rooms
- 8,1496 rooms
- 5,6327 rooms
- 5,8238 rooms
- 6,8869+ rooms

- Rooms in renter-occupied apartments in Meridian, Idaho
- 5641 room
- 9592 rooms
- 1,9033 rooms
- 3,8694 rooms
- 1,9085 rooms
- 1,2506 rooms
- 1,6487 rooms
- 1,4578 rooms
- 6499+ rooms


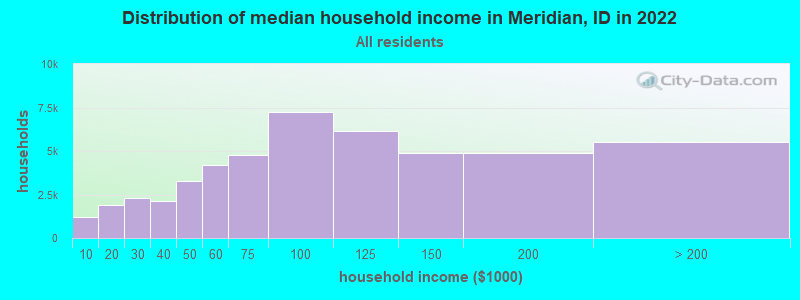
Meridian, ID household income distribution

- 1,197Less than $10,000
- 1,919$10,000 to $19,999
- 2,315$20,000 to $29,999
- 2,114$30,000 to $39,999
- 3,255$40,000 to $49,999
- 4,187$50,000 to $59,999
- 4,742$60,000 to $74,999
- 7,233$75,000 to $99,999
- 6,178$100,000 to $124,999
- 4,885$125,000 to $149,999
- 4,913$150,000 to $199,999
- 5,496$200,000 or more
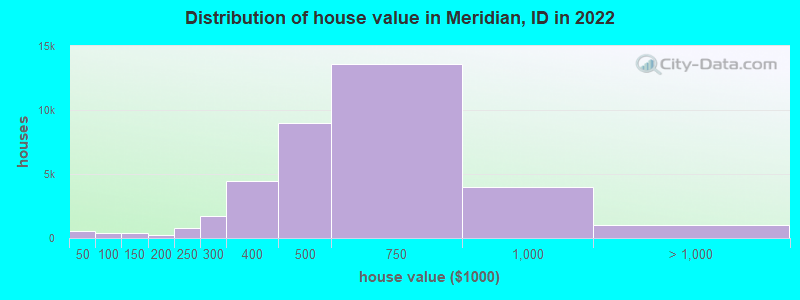
Home value of owner - occupied houses in 2022 in Meridian, ID
-
- 155Less than $10,000
- 43$10,000 to $14,999
- 118$15,000 to $19,999
- 56$20,000 to $24,999
- 80$25,000 to $29,999
- 75$30,000 to $34,999
- 50$40,000 to $49,999
- 212$50,000 to $59,999
- 76$70,000 to $79,999
- 29$80,000 to $89,999
- 15$90,000 to $99,999
- 378$100,000 to $124,999
- 18$125,000 to $149,999
- 125$150,000 to $174,999
- 142$175,000 to $199,999
- 783$200,000 to $249,999
- 1,750$250,000 to $299,999
- 4,447$300,000 to $399,999
- 8,982$400,000 to $499,999
- 13,613$500,000 to $749,999
- 3,946$750,000 to $999,999
- 406$1,000,000 to $1,499,999
- 212$1,500,000 to $1,999,999
- 402$2,000,000 or more
Rent paid by renters in 2022 in Meridian, ID
-
- 11$150 to $199
- 61$200 to $249
- 9$300 to $349
- 8$350 to $399
- 45$400 to $449
- 30$450 to $499
- 177$500 to $549
- 31$550 to $599
- 137$600 to $649
- 7$650 to $699
- 55$700 to $749
- 253$750 to $799
- 318$800 to $899
- 270$900 to $999
- 1,337$1,000 to $1,249
- 2,466$1,250 to $1,499
- 4,282$1,500 to $1,999
- 1,115$2,000 to $2,499
- 510$2,500 to $2,999
- 21$3,000 to $3,499
- 252$3,500 or more
- 268No cash rent


Percentage of workers working in this county: 90.0%
Number of people working at home: 12,378 (19.3% of all workers)
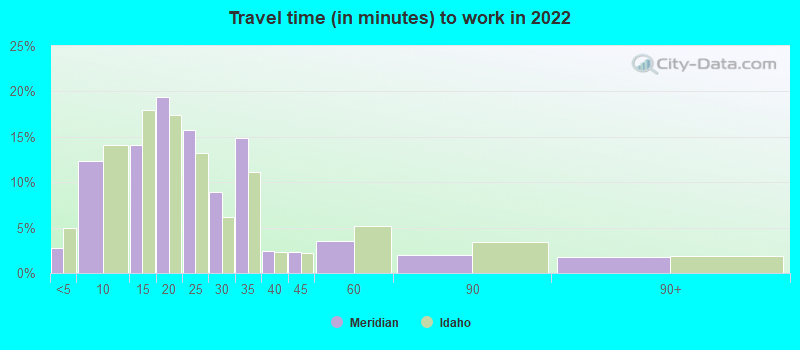
Travel time to work (commute)
- Less than 5 minutes: 1,933
- 5 to 9 minutes: 6,488
- 10 to 14 minutes: 6,271
- 15 to 19 minutes: 9,415
- 20 to 24 minutes: 10,599
- 25 to 29 minutes: 4,599
- 30 to 34 minutes: 8,770
- 35 to 39 minutes: 998
- 40 to 44 minutes: 802
- 45 to 59 minutes: 1,181
- 60 to 89 minutes: 513
- 90 or more minutes: 1,042
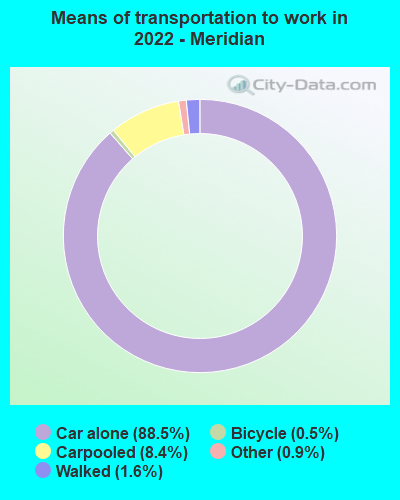
Means of transportation to work:
- Drove a car alone: 46,814 (71.5%)
- Carpooled: 4,923 (7.5%)
- Bus: 63 (0.1%)
- Subway or elevated rail: 16 (0.0%)
- Taxi: 623 (1.0%)
- Bicycle: 218 (0.3%)
- Walked: 678 (1.0%)
- Worked at home: 12,378 (18.9%)

- Unemployment by race in 2022
- Unemployment rate for White non-Hispanic residents
- 2.3%Males
- 2.0%Females
- Unemployment rate for Black residents
- 21.2%Females
- Unemployment rate for American Indian and Alaska Native residents
- 0.6%Males
- Unemployment rate for Asian residents
- 1.8%Males
- 9.5%Females
- Unemployment rate for other race residents
- 1.8%Males
- 1.1%Females
- Unemployment rate for two or more race residents
- 2.5%Males
- 2.5%Females
- Unemployment rate for Hispanic or Latino residents
- 0.6%Males

- Year of entry for the foreign-born population in Meridian, Idaho
- 2,3632010 or later
- 1,3272000 to 2009
- 1,2141990 to 1999
- 3031980 to 1989
- 1381970 to 1979
- 271Before 1970

First ancestries reported:
- English: 13,560 (25.8%)
- American: 4,910 (9.3%)
- German: 4,867 (9.2%)
- Irish: 3,894 (7.4%)
- European: 3,398 (6.5%)
- Italian: 1,070 (2.0%)
- Scottish: 917 (1.7%)
- Swedish: 809 (1.5%)
- Norwegian: 734 (1.4%)
- Dutch: 539 (1.0%)
- French: 365 (0.7%)
- British: 360 (0.7%)
- Canadian: 349 (0.7%)
- Ukrainian: 329 (0.6%)
- Basque: 294 (0.6%)
- Scandinavian: 294 (0.6%)
- Welsh: 282 (0.5%)
- Danish: 259 (0.5%)
- Polish: 218 (0.4%)
- Yugoslavian: 216 (0.4%)
- Scotch-Irish: 203 (0.4%)
- Portuguese: 170 (0.3%)
- Czech: 161 (0.3%)
- Israeli: 157 (0.3%)
- Eastern European: 156 (0.3%)
- French Canadian: 154 (0.3%)
- Greek: 153 (0.3%)
- Haitian: 142 (0.3%)
- African: 135 (0.3%)
- Swiss: 127 (0.2%)
- Iranian: 123 (0.2%)
- Czechoslovakian: 113 (0.2%)
- Romanian: 112 (0.2%)
- Russian: 108 (0.2%)
- Hungarian: 106 (0.2%)
- Belgian: 103 (0.2%)
- Northern European: 100 (0.2%)
- Croatian: 85 (0.2%)
- Slovak: 69 (0.1%)
- Lithuanian: 63 (0.1%)
- Icelander: 57 (0.1%)
- Finnish: 49 (0.09%)
- Lebanese: 48 (0.09%)
- Jamaican: 40 (0.08%)
- Cajun: 21 (0.04%)
- Austrian: 20 (0.04%)
- Slavic: 12 (0.02%)
- Egyptian: 11 (0.02%)
- Somali: 10 (0.02%)
Most common places of birth for foreign-born residents (%):
| Meridian: | 18.8% (1,114) |
| Idaho: | 49.9% (53,107) |
| Meridian: | 9.3% (553) |
| Idaho: | 5.2% (5,503) |
| Meridian: | 7.3% (434) |
| Idaho: | 0.5% (577) |
| Meridian: | 4.7% (279) |
| Idaho: | 1.7% (1,802) |
| Meridian: | 4.2% (250) |
| Idaho: | 2.4% (2,535) |
| Meridian: | 3.6% (214) |
| Idaho: | 0.9% (956) |
| Meridian: | 3.6% (211) |
| Idaho: | 1.2% (1,289) |
| Meridian: | 3.5% (209) |
| Idaho: | 0.4% (384) |
| Meridian: | 3.2% (192) |
| Idaho: | 1.2% (1,257) |
| Meridian: | 2.8% (167) |
| Idaho: | 1.2% (1,274) |
| Meridian: | 2.6% (156) |
| Idaho: | 0.5% (547) |
| Meridian: | 2.5% (146) |
| Idaho: | 2.1% (2,219) |
| Meridian: | 2.4% (145) |
| Idaho: | 0.3% (286) |
| Meridian: | 2.3% (138) |
| Idaho: | 2.1% (2,230) |
| Meridian: | 2.1% (125) |
| Idaho: | 0.7% (771) |
| Meridian: | 2.0% (120) |
| Idaho: | 0.6% (622) |
| Meridian: | 1.9% (110) |
| Idaho: | 0.6% (675) |
| Meridian: | 1.8% (105) |
| Idaho: | 2.0% (2,143) |
Place of birth for U.S.-born residents:
- This state: 49,062
- Other state: 71,453
- Northeast: 4,700
- Midwest: 10,747
- South: 8,515
- West: 47,491
85.0% of Meridian residents lived in the same house 1 years ago.
Out of people who lived in different houses, 35.5% lived in this county.
Out of people who lived in different counties, 21.4% lived in Idaho.
| Meridian: | 85.0% |
| State average: | 85.1% |
Education attainment for males 25 years and older:
- No schooling: 476
- Nursery to 4th grade: 0
- 5th and 6th grade: 0
- 7th and 8th grade: 30
- 9th grade: 0
- 10th grade: 168
- 11th grade: 308
- 12th grade, no diploma: 475
- High school graduate (or equivalency): 8,871
- Less than 1 year of college: 3,215
- Some college more than 1 year, no degree: 5,256
- Associate degree: 2,795
- Bachelor's degree: 12,464
- Master's degree: 5,475
- Professional school degree: 1,384
- Doctorate degree: 1,190

Education attainment for females 25 years and older:
- No schooling: 283
- Nursery to 4th grade: 0
- 5th and 6th grade: 0
- 7th and 8th grade: 48
- 9th grade: 115
- 10th grade: 427
- 11th grade: 55
- 12th grade, no diploma: 571
- High school graduate (or equivalency): 9,214
- Less than 1 year of college: 3,404
- Some college more than 1 year, no degree: 7,447
- Associate degree: 3,663
- Bachelor's degree: 13,607
- Master's degree: 3,876
- Professional school degree: 480
- Doctorate degree: 784


Housing units in structures:
- One, detached: 40,288
- One, attached: 1,904
- Two: 471
- 3 or 4: 2,442
- 5 to 9: 1,192
- 10 to 19: 1,648
- 20 to 49: 1,317
- 50 or more: 1,923
- Mobile homes: 273
- Boats, RVs, vans, etc.: 60
Housing units lacking complete kitchen facilities in 2022: 1.3%
House/condo owner moved in on average 6 years ago
Renter moved in on average 1 years ago

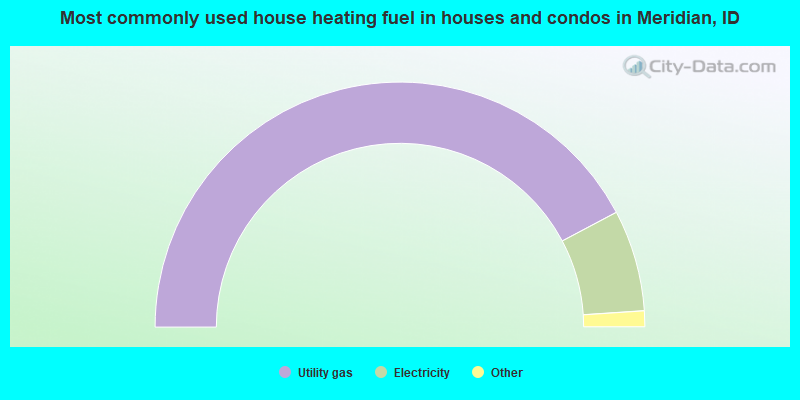
- 84.5%Utility gas
- 13.4%Electricity
- 1.1%Wood
- 0.6%Bottled, tank, or LP gas
- 0.2%No fuel used
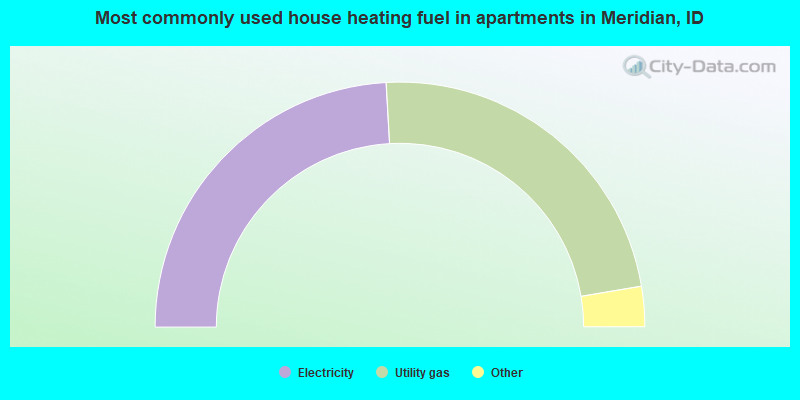
- 48.2%Electricity
- 46.5%Utility gas
- 3.5%Bottled, tank, or LP gas
- 1.2%Fuel oil, kerosene, etc.
- 0.6%No fuel used
Private vs. public school enrollment:
| Here: | 9.8% |
| Idaho: | 13.5% |
| Here: | 6.6% |
| Idaho: | 8.5% |
| Here: | 17.5% |
| Idaho: | 30.0% |


