Races in Meridian, Idaho (ID) Detailed Stats
Data:
Races - White alone (%)
Races - White alone (% change since 2000)
Races - Black alone (%)
Races - Black alone (% change since 2000)
Races - American Indian alone (%)
Races - American Indian alone (% change since 2000)
Races - Asian alone (%)
Races - Asian alone (% change since 2000)
Races - Hispanic (%)
Races - Hispanic (% change since 2000)
Races - Native Hawaiian and Other Pacific Islander alone (%)
Races - Native Hawaiian and Other Pacific Islander alone (% change since 2000)
Races - Two or more races(%)
Races - Two or more races(% change since 2000)
Races - Other race alone (%)
Races - Other race alone (% change since 2000)
Racial diversity
Place of birth - Born in state of residence (%)
Place of birth - Born in state of residence (%) - White
Place of birth - Born in state of residence (%) - Black or African American
Place of birth - Born in state of residence (%) - Asian
Place of birth - Born in state of residence (%) - Hispanic or Latino
Place of birth - Born in state of residence (%) - American Indian and Alaska Native
Place of birth - Born in state of residence (%) - Multirace
Place of birth - Born in state of residence (%) - Other Race
Place of birth - Born in other state (%)
Place of birth - Born in other state (%) - White
Place of birth - Born in other state (%) - Black or African American
Place of birth - Born in other state (%) - Asian
Place of birth - Born in other state (%) - Hispanic or Latino
Place of birth - Born in other state (%) - American Indian and Alaska Native
Place of birth - Born in other state (%) - Multirace
Place of birth - Born in other state (%) - Other Race
Place of birth - Native, outside of US (%)
Place of birth - Native, outside of US (%) - White
Place of birth - Native, outside of US (%) - Black or African American
Place of birth - Native, outside of US (%) - Asian
Place of birth - Native, outside of US (%) - Hispanic or Latino
Place of birth - Native, outside of US (%) - American Indian and Alaska Native
Place of birth - Native, outside of US (%) - Multirace
Place of birth - Native, outside of US (%) - Other Race
Place of birth - Foreign born (%)
Place of birth - Foreign born (%) - White
Place of birth - Foreign born (%) - Black or African American
Place of birth - Foreign born (%) - Asian
Place of birth - Foreign born (%) - Hispanic or Latino
Place of birth - Foreign born (%) - American Indian and Alaska Native
Place of birth - Foreign born (%) - Multirace
Place of birth - Foreign born (%) - Other Race
Residents speaking English at home (%)
Residents speaking English at home - Born in the United States (%)
Residents speaking English at home - Native, born elsewhere (%)
Residents speaking English at home - Foreign born (%)
Residents speaking Spanish at home (%)
Residents speaking Spanish at home - Born in the United States (%)
Residents speaking Spanish at home - Native, born elsewhere (%)
Residents speaking Spanish at home - Foreign born (%)
Residents speaking other language at home (%)
Residents speaking other language at home - Born in the United States (%)
Residents speaking other language at home - Native, born elsewhere (%)
Residents speaking other language at home - Foreign born (%)
Marital status - Never married (%)
Marital status - Now married (%)
Marital status - Separated (%)
Marital status - Widowed (%)
Marital status - Divorced (%)
Ancestries Reported - Arab (%)
Ancestries Reported - Czech (%)
Ancestries Reported - Danish (%)
Ancestries Reported - Dutch (%)
Ancestries Reported - English (%)
Ancestries Reported - French (%)
Ancestries Reported - French Canadian (%)
Ancestries Reported - German (%)
Ancestries Reported - Greek (%)
Ancestries Reported - Hungarian (%)
Ancestries Reported - Irish (%)
Ancestries Reported - Italian (%)
Ancestries Reported - Lithuanian (%)
Ancestries Reported - Norwegian (%)
Ancestries Reported - Polish (%)
Ancestries Reported - Portuguese (%)
Ancestries Reported - Russian (%)
Ancestries Reported - Scotch-Irish (%)
Ancestries Reported - Scottish (%)
Ancestries Reported - Slovak (%)
Ancestries Reported - Subsaharan African (%)
Ancestries Reported - Swedish (%)
Ancestries Reported - Swiss (%)
Ancestries Reported - Ukrainian (%)
Ancestries Reported - United States (%)
Ancestries Reported - Welsh (%)
Ancestries Reported - West Indian (%)
Ancestries Reported - Other (%)
Geographical mobility - Same house 1 year ago (%)
Geographical mobility - Same house 1 year ago (%) - White
Geographical mobility - Same house 1 year ago (%) - Black or African American
Geographical mobility - Same house 1 year ago (%) - Asian
Geographical mobility - Same house 1 year ago (%) - Hispanic or Latino
Geographical mobility - Same house 1 year ago (%) - American Indian and Alaska Native
Geographical mobility - Same house 1 year ago (%) - Multirace
Geographical mobility - Same house 1 year ago (%) - Other Race
Geographical mobility - Moved within same county (%)
Geographical mobility - Moved within same county (%) - White
Geographical mobility - Moved within same county (%) - Black or African American
Geographical mobility - Moved within same county (%) - Asian
Geographical mobility - Moved within same county (%) - Hispanic or Latino
Geographical mobility - Moved within same county (%) - American Indian and Alaska Native
Geographical mobility - Moved within same county (%) - Multirace
Geographical mobility - Moved within same county (%) - Other Race
Geographical mobility - Moved from different county within same state (%)
Geographical mobility - Moved from different county within same state (%) - White
Geographical mobility - Moved from different county within same state (%) - Black or African American
Geographical mobility - Moved from different county within same state (%) - Asian
Geographical mobility - Moved from different county within same state (%) - Hispanic or Latino
Geographical mobility - Moved from different county within same state (%) - American Indian and Alaska Native
Geographical mobility - Moved from different county within same state (%) - Multirace
Geographical mobility - Moved from different county within same state (%) - Other Race
Geographical mobility - Moved from different state (%)
Geographical mobility - Moved from different state (%) - White
Geographical mobility - Moved from different state (%) - Black or African American
Geographical mobility - Moved from different state (%) - Asian
Geographical mobility - Moved from different state (%) - Hispanic or Latino
Geographical mobility - Moved from different state (%) - American Indian and Alaska Native
Geographical mobility - Moved from different state (%) - Multirace
Geographical mobility - Moved from different state (%) - Other Race
Geographical mobility - Moved from abroad (%)
Geographical mobility - Moved from abroad (%) - White
Geographical mobility - Moved from abroad (%) - Black or African American
Geographical mobility - Moved from abroad (%) - Asian
Geographical mobility - Moved from abroad (%) - Hispanic or Latino
Geographical mobility - Moved from abroad (%) - American Indian and Alaska Native
Geographical mobility - Moved from abroad (%) - Multirace
Geographical mobility - Moved from abroad (%) - Other Race
Place of birth for the foreign-born population - Ireland (%)
Place of birth for the foreign-born population - Denmark (%)
Place of birth for the foreign-born population - Norway (%)
Place of birth for the foreign-born population - Sweden (%)
Place of birth for the foreign-born population - United Kingdom (%)
Place of birth for the foreign-born population - England (%)
Place of birth for the foreign-born population - Scotland (%)
Place of birth for the foreign-born population - Other Northern Europe (%)
Place of birth for the foreign-born population - Austria (%)
Place of birth for the foreign-born population - Belgium (%)
Place of birth for the foreign-born population - France (%)
Place of birth for the foreign-born population - Germany (%)
Place of birth for the foreign-born population - Netherlands (%)
Place of birth for the foreign-born population - Switzerland (%)
Place of birth for the foreign-born population - Other Western Europe (%)
Place of birth for the foreign-born population - Greece (%)
Place of birth for the foreign-born population - Italy (%)
Place of birth for the foreign-born population - Portugal (%)
Place of birth for the foreign-born population - Spain (%)
Place of birth for the foreign-born population - Other Southern Europe (%)
Place of birth for the foreign-born population - Albania (%)
Place of birth for the foreign-born population - Belarus (%)
Place of birth for the foreign-born population - Bosnia and Herzegovina (%)
Place of birth for the foreign-born population - Bulgaria (%)
Place of birth for the foreign-born population - Croatia (%)
Place of birth for the foreign-born population - Czechoslovakia (%)
Place of birth for the foreign-born population - Hungary (%)
Place of birth for the foreign-born population - Latvia (%)
Place of birth for the foreign-born population - Lithuania (%)
Place of birth for the foreign-born population - North Macedonia (Macedonia) (%)
Place of birth for the foreign-born population - Moldova (%)
Place of birth for the foreign-born population - Poland (%)
Place of birth for the foreign-born population - Romania (%)
Place of birth for the foreign-born population - Russia (%)
Place of birth for the foreign-born population - Serbia (%)
Place of birth for the foreign-born population - Ukraine (%)
Place of birth for the foreign-born population - Other Eastern Europe (%)
Place of birth for the foreign-born population - China (%)
Place of birth for the foreign-born population - Hong Kong (%)
Place of birth for the foreign-born population - Taiwan (%)
Place of birth for the foreign-born population - Japan (%)
Place of birth for the foreign-born population - Korea (%)
Place of birth for the foreign-born population - Other Eastern Asia (%)
Place of birth for the foreign-born population - Afghanistan (%)
Place of birth for the foreign-born population - Bangladesh (%)
Place of birth for the foreign-born population - India (%)
Place of birth for the foreign-born population - Iran (%)
Place of birth for the foreign-born population - Kazakhstan (%)
Place of birth for the foreign-born population - Nepal (%)
Place of birth for the foreign-born population - Pakistan (%)
Place of birth for the foreign-born population - Sri Lanka (%)
Place of birth for the foreign-born population - Uzbekistan (%)
Place of birth for the foreign-born population - Other South Central Asia (%)
Place of birth for the foreign-born population - Burma (%)
Place of birth for the foreign-born population - Cambodia (%)
Place of birth for the foreign-born population - Indonesia (%)
Place of birth for the foreign-born population - Laos (%)
Place of birth for the foreign-born population - Malaysia (%)
Place of birth for the foreign-born population - Philippines (%)
Place of birth for the foreign-born population - Singapore (%)
Place of birth for the foreign-born population - Thailand (%)
Place of birth for the foreign-born population - Vietnam (%)
Place of birth for the foreign-born population - Other South Eastern Asia (%)
Place of birth for the foreign-born population - Armenia (%)
Place of birth for the foreign-born population - Iraq (%)
Place of birth for the foreign-born population - Israel (%)
Place of birth for the foreign-born population - Jordan (%)
Place of birth for the foreign-born population - Kuwait (%)
Place of birth for the foreign-born population - Lebanon (%)
Place of birth for the foreign-born population - Saudi Arabia (%)
Place of birth for the foreign-born population - Syria (%)
Place of birth for the foreign-born population - Turkey (%)
Place of birth for the foreign-born population - Yemen (%)
Place of birth for the foreign-born population - Other Western Asia (%)
Place of birth for the foreign-born population - Eritrea (%)
Place of birth for the foreign-born population - Ethiopia (%)
Place of birth for the foreign-born population - Kenya (%)
Place of birth for the foreign-born population - Somalia (%)
Place of birth for the foreign-born population - Uganda (%)
Place of birth for the foreign-born population - Zimbabwe (%)
Place of birth for the foreign-born population - Other Eastern Africa (%)
Place of birth for the foreign-born population - Cameroon (%)
Place of birth for the foreign-born population - Congo (%)
Place of birth for the foreign-born population - Democratic Republic of Congo (Zaire) (%)
Place of birth for the foreign-born population - Other Middle Africa (%)
Place of birth for the foreign-born population - Egypt (%)
Place of birth for the foreign-born population - Morocco (%)
Place of birth for the foreign-born population - Sudan (%)
Place of birth for the foreign-born population - Other Northern Africa (%)
Place of birth for the foreign-born population - South Africa (%)
Place of birth for the foreign-born population - Other Southern Africa (%)
Place of birth for the foreign-born population - Cabo Verde (%)
Place of birth for the foreign-born population - Ghana (%)
Place of birth for the foreign-born population - Liberia (%)
Place of birth for the foreign-born population - Nigeria (%)
Place of birth for the foreign-born population - Senegal (%)
Place of birth for the foreign-born population - Sierra Leone (%)
Place of birth for the foreign-born population - Other Western Africa (%)
Place of birth for the foreign-born population - Australia (%)
Place of birth for the foreign-born population - New Zealand (%)
Place of birth for the foreign-born population - Fiji (%)
Place of birth for the foreign-born population - Micronesia (%)
Place of birth for the foreign-born population - Bahamas (%)
Place of birth for the foreign-born population - Barbados (%)
Place of birth for the foreign-born population - Cuba (%)
Place of birth for the foreign-born population - Dominica (%)
Place of birth for the foreign-born population - Dominican Republic (%)
Place of birth for the foreign-born population - Grenada (%)
Place of birth for the foreign-born population - Haiti (%)
Place of birth for the foreign-born population - Jamaica (%)
Place of birth for the foreign-born population - St. Vincent and the Grenadines (%)
Place of birth for the foreign-born population - Trinidad and Tobago (%)
Place of birth for the foreign-born population - West Indies (%)
Place of birth for the foreign-born population - Other Caribbean (%)
Place of birth for the foreign-born population - Belize (%)
Place of birth for the foreign-born population - Costa Rica (%)
Place of birth for the foreign-born population - El Salvador (%)
Place of birth for the foreign-born population - Guatemala (%)
Place of birth for the foreign-born population - Honduras (%)
Place of birth for the foreign-born population - Mexico (%)
Place of birth for the foreign-born population - Nicaragua (%)
Place of birth for the foreign-born population - Panama (%)
Place of birth for the foreign-born population - Other Central America (%)
Place of birth for the foreign-born population - Argentina (%)
Place of birth for the foreign-born population - Bolivia (%)
Place of birth for the foreign-born population - Brazil (%)
Place of birth for the foreign-born population - Chile (%)
Place of birth for the foreign-born population - Colombia (%)
Place of birth for the foreign-born population - Ecuador (%)
Place of birth for the foreign-born population - Guyana (%)
Place of birth for the foreign-born population - Peru (%)
Place of birth for the foreign-born population - Uruguay (%)
Place of birth for the foreign-born population - Venezuela (%)
Place of birth for the foreign-born population - Other South America (%)
Place of birth for the foreign-born population - Canada (%)
Place of birth for the foreign-born population - Other Northern America (%)
Place of birth for the foreign-born population - Other (%)
Latest news about races in Meridian, ID collected exclusively by city-data.com from local newspapers, TV, and radio stations
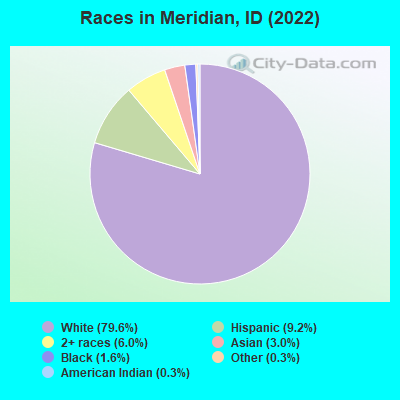
According to 2022 data, the most numerous races in Meridian, ID are White alone (103,277 residents), Hispanic (11,938 residents), and Two or more races (7,737 residents). 92.0% of Meridian residents speak English at home. 4.7% of Meridian, ID residents are foreign-born (1.8% born in Latin America, 1.4% born in Asia, 0.8% born in Europe), which is 5.5% less than the foreign-born rate of 5.0% across the entire state of Idaho.
Race distribution in Meridian
2000 2022
1,139,291 88.0% White alone 101,690 7.9% Hispanic 18,261 1.4% Two or more races 15,789 1.2% American Indian alone 11,641 0.9% Asian alone 4,889 0.4% Black alone 1,192 0.09% Other race alone 1,200 0.09% Native Hawaiian and Other
1,531,219 79.0% White alone 261,921 13.5% Hispanic 81,112 4.2% Two or more races 25,174 1.3% Asian alone 15,825 0.8% American Indian alone 11,868 0.6% Black alone 8,752 0.5% Other race alone 3,162 0.2% Native Hawaiian and Other
Income and house value in Meridian Median household income in 2022 $92,617 White non-Hispanic householders$53,659 Black householders$54,536 American Indian and Alaska Native householders$102,146 Asian householders$92,878 Some other race householders$81,218 Two or more races householders$80,975 Hispanic or Latino race householdersMedian 2022 house value $578,250 White Non-Hispanic householders$614,004 Black or African American householders$536,300 American Indian or Alaska Native householders $569,669 Asian householders$405,204 Native Hawaiian and other Pacific Islander householders$544,404 Some other race householders$573,483 Two or more races householders$548,694 Hispanic or Latino householders
Median age by race in Meridian
40.9 Median age for White residents40.3 41.9 33.5 Median age for Black or African American residents34.6 29.9 24.2 Median age for American Indian / Alaska Native residents37.4 20.9 40.7 Median age for Asian residents47.3 39.9 -666,666,666.0 Median age for Native Hawaiian / Pacific Islander residents-666,666,666.0 -666,666,666.0 29.6 Median age for Other race residents39.2 22.3 21.1 Median age for Two or more races residents16.8 25.7 41.6 Median age for White alone residents40.6 42.5 25.3 Median age for Hispanic or Latino residents23.5 26.6
Owner/renter occupied households by race in Meridian
House owners and renters - White residents 29,764 71.9% Owner occupied11,613 28.1% Renter occupiedHouse owners and renters - Black or African American residents 182 67.0% Owner occupied90 33.0% Renter occupiedHouse owners and renters - American Indian / Alaska Native residents 230 63.5% Owner occupied132 36.5% Renter occupiedHouse owners and renters - Asian residents 1,042 75.2% Owner occupied344 24.8% Renter occupiedHouse owners and renters - Native Hawaiian / Pacific Islander residents 8 15.3% Owner occupied44 84.7% Renter occupiedHouse owners and renters - Other race residents 427 61.1% Owner occupied272 38.9% Renter occupiedHouse owners and renters - Two or more races residents 2,535 61.8% Owner occupied1,567 38.2% Renter occupiedHouse owners and renters - White alone residents 29,572 72.5% Owner occupied11,209 27.5% Renter occupiedHouse owners and renters - Hispanic or Latino residents 1,848 53.6% Owner occupied1,597 46.4% Renter occupied
Language usage in Meridian
English speakers - Total 92.0% of residents of Meridian speak English at home.
3.9% of residents speak Spanish at home 2,937 61.9% Speak English very well1,809 38.1% Speak English less than very well4.1% of residents speak other language at home 3,558 71.3% Speak English very well1,434 28.7% Speak English less than very well
English speakers - Born in the United States 97.3% of residents of Meridian speak English at home.
1.2% of residents speak Spanish at home 612 75.7% Speak English very well196 24.3% Speak English less than very well1.5% of residents speak other language at home 1,040 100.0% Speak English very well
English speakers - Native, born elsewhere 57.0% of residents of Meridian speak English at home.
39.4% of residents speak Spanish at home 450 67.8% Speak English very well214 32.2% Speak English less than very well3.6% of residents speak other language at home 60 100.0% Speak English very well
English speakers - Foreign-born 27.1% of residents of Meridian speak English at home.
28.3% of residents speak Spanish at home 924 43.6% Speak English very well1,197 56.4% Speak English less than very well44.6% of residents speak other language at home 1,975 59.2% Speak English very well1,361 40.8% Speak English less than very well
White (Caucasian) - Speak only English Native:
97.8% (96,916)Foreign-born:
52.4% (865)
White (Caucasian) - Speak another language Native:
2.2% (2,187)Foreign-born:
47.6% (786)
Black or African American - Speak only English Native:
62.2% (625)Foreign-born:
11.9% (64)
Black or African American - Speak another language Native:
28.0% (281)Foreign-born:
64.2% (345)
American Indian / Alaska Native - Speak another language Native:
7.7% (35)Foreign-born:
98.9% (42)
Asian - Speak only English Native:
79.8% (719)Foreign-born:
15.5% (420)
Asian - Speak another language Native:
20.2% (182)Foreign-born:
84.5% (2,282)
Other race - Speak only English Native:
74.3% (953)Foreign-born:
10.4% (98)
Other race - Speak another language Native:
25.7% (329)Foreign-born:
89.6% (842)
Two or more races - Speak only English Native:
89.7% (9,787)Foreign-born:
18.2% (225)
Two or more races - Speak another language Native:
10.3% (1,128)Foreign-born:
81.8% (1,011)
White alone - Speak only English Native:
97.8% (94,690)Foreign-born:
53.8% (865)
White alone - Speak another language Native:
2.2% (2,092)Foreign-born:
46.2% (742)
Hispanic or Latino - Speak only English Native:
83.0% (6,737)Foreign-born:
13.5% (323)
Hispanic or Latino - Speak another language Native:
17.0% (1,384)Foreign-born:
86.5% (2,072)
Foreign-born residents in Meridian 5,926 residents are foreign born (1.8% Latin America , 1.4% Asia , 0.8% Europe ).
Marital status for residents in Meridian Marital status - White (Caucasian) population 15 years and over
Males 24.0% Never married62.0% Now married0.2% Separated4.1% Widowed9.7% DivorcedFemales 19.2% Never married56.5% Now married1.5% Separated9.5% Widowed13.3% DivorcedWomen who gave birth in the past 12 months Now married:
89.0% (1,074)Unmarried:
11.0% (133)
Women who did not give birth in the past 12 months Now married:
56.4% (13,220)Unmarried:
43.6% (10,222)
Marital status - Black or African American population 15 years and over
Males 54.2% Never married37.6% Now married3.6% Separated0.0% Widowed4.6% DivorcedFemales 66.5% Never married27.7% Now married0.0% Separated1.4% Widowed4.5% DivorcedWomen who gave birth in the past 12 months Now married:
100.0% (88)Unmarried:
0.0% (0)
Women who did not give birth in the past 12 months Now married:
12.7% (73)Unmarried:
87.3% (505)
Marital status - American Indian / Alaska Native population 15 years and over
Males 22.3% Never married30.9% Now married0.0% Separated0.0% Widowed46.8% DivorcedFemales 45.8% Never married25.0% Now married0.0% Separated4.8% Widowed24.4% DivorcedWomen who gave birth in the past 12 months Now married:
100.0% (14)Unmarried:
0.0% (0)
Women who did not give birth in the past 12 months Now married:
28.0% (34)Unmarried:
72.0% (88)
Marital status - Asian population 15 years and over
Males 26.4% Never married68.1% Now married0.0% Separated0.0% Widowed5.5% DivorcedFemales 14.2% Never married55.0% Now married1.0% Separated19.7% Widowed10.1% DivorcedWomen who did not give birth in the past 12 months Now married:
60.9% (440)Unmarried:
39.1% (282)
Marital status - Native Hawaiian / Pacific Islander population 15 years and over
Males 0.0% Never married100.0% Now married0.0% Separated0.0% Widowed0.0% DivorcedFemales 100.0% Never married0.0% Now married0.0% Separated0.0% Widowed0.0% DivorcedWomen who did not give birth in the past 12 months Now married:
0.0% (0)Unmarried:
100.0% (117)
Marital status - Other race population 15 years and over
Males 22.5% Never married60.4% Now married4.9% Separated2.7% Widowed9.6% DivorcedFemales 29.1% Never married62.7% Now married3.2% Separated0.1% Widowed5.0% DivorcedWomen who gave birth in the past 12 months Now married:
100.0% (48)Unmarried:
0.0% (0)
Women who did not give birth in the past 12 months Now married:
62.0% (674)Unmarried:
38.0% (412)
Marital status - Two or more races population 15 years and over
Males 49.6% Never married40.9% Now married3.1% Separated1.0% Widowed5.4% DivorcedFemales 28.7% Never married55.8% Now married0.0% Separated13.2% Widowed2.2% DivorcedWomen who gave birth in the past 12 months Now married:
100.0% (380)Unmarried:
0.0% (0)
Women who did not give birth in the past 12 months Now married:
47.3% (1,130)Unmarried:
52.7% (1,258)
Marital status - White alone, not Hispanic / Latino population 15 years and over
Males 23.8% Never married62.4% Now married0.2% Separated4.2% Widowed9.5% DivorcedFemales 18.8% Never married56.6% Now married1.4% Separated9.7% Widowed13.4% DivorcedWomen who gave birth in the past 12 months Now married:
89.0% (1,074)Unmarried:
11.0% (133)
Women who did not give birth in the past 12 months Now married:
56.4% (12,609)Unmarried:
43.6% (9,748)
Marital status - Hispanic or Latino population 15 years and over
Males 42.0% Never married44.8% Now married3.7% Separated0.0% Widowed9.5% DivorcedFemales 33.4% Never married58.5% Now married1.0% Separated3.7% Widowed3.4% DivorcedWomen who gave birth in the past 12 months Now married:
100.0% (427)Unmarried:
0.0% (0)
Women who did not give birth in the past 12 months Now married:
49.6% (1,629)Unmarried:
50.4% (1,654)
Ancestries in Meridian
13,560 25.8% English4,910 9.3% American4,867 9.2% German3,894 7.4% Irish3,398 6.5% European1,070 2.0% Italian917 1.7% Scottish809 1.5% Swedish734 1.4% Norwegian539 1.0% Dutch365 0.7% French360 0.7% British349 0.7% Canadian329 0.6% Ukrainian294 0.6% Basque294 0.6% Scandinavian282 0.5% Welsh259 0.5% Danish218 0.4% Polish216 0.4% Yugoslavian203 0.4% Scotch-Irish170 0.3% Portuguese161 0.3% Czech157 0.3% Israeli156 0.3% Eastern European154 0.3% French Canadian153 0.3% Greek142 0.3% Haitian135 0.3% African127 0.2% Swiss123 0.2% Iranian113 0.2% Czechoslovakian112 0.2% Romanian108 0.2% Russian106 0.2% Hungarian103 0.2% Belgian100 0.2% Northern European85 0.2% Croatian69 0.1% Slovak63 0.1% Lithuanian57 0.1% Icelander49 0.09% Finnish48 0.09% Lebanese40 0.08% Jamaican21 0.04% Cajun20 0.04% Austrian12 0.02% Slavic11 0.02% Egyptian10 0.02% Somali
Geographical mobility in Meridian Same house 1 year ago 89,811 85.2% White (Caucasian)1,300 76.6% Black or African American650 88.0% American Indian / Alaska Native2,869 95.1% Asian58 45.1% Native Hawaiian / Pacific Islander2,335 76.2% Other race11,616 86.9% Two or more races88,281 86.1% White alone, not Hispanic / Latino9,249 79.8% Hispanic or LatinoMoved within same county 7,153 6.8% White / Caucasian428 25.2% Black or African American28 3.7% American Indian / Alaska Native50 1.6% Asian263 8.6% Other race810 6.1% Two or more races6,881 6.7% White alone, not Hispanic / Latino752 6.5% Hispanic or LatinoMoved within same state 1,873 1.8% White / Caucasian1 0.1% Black or African American25 3.3% American Indian / Alaska Native205 6.7% Other race486 3.6% Two or more races921 0.9% White alone, not Hispanic / Latino1,149 9.9% Hispanic or LatinoMoved from different state 6,568 6.2% White / Caucasian51 3.0% Black or African American25 3.4% American Indian / Alaska Native91 3.0% Asian71 55.0% Native Hawaiian / Pacific Islander89 2.9% Other race347 2.6% Two or more races6,384 6.2% White alone, not Hispanic / Latino402 3.5% Hispanic or LatinoMoved from abroad 63 0.1% White38 1.3% Asian29 0.9% Other race113 0.8% Two or more races63 0.1% White alone, not Hispanic / Latino36 0.3% Hispanic or Latino
Children Nativity (place of birth) in Meridian
Children under 6 years - Living with two parents Both parents native 6,180 100.0% NativeBoth parents foreign-born 284 98.4% Native5 1.6% Foreign-bornOne native, one foreign-born parent 292 90.7% Native30 9.3% Foreign-bornChildren under 6 years - Living with one parent Native parent 1,166 100.0% NativeForeign-born parent 20 100.0% NativeChildren 6 to 17 years - Living with two parents Both parents native 18,113 99.6% Native75 0.4% Foreign-bornBoth parents foreign-born 466 65.4% Native246 34.6% Foreign-bornOne native, one foreign-born parent 927 100.0% NativeChildren 6 to 17 years - Living with one parent Native parent 3,441 100.0% NativeForeign-born parent 156 52.4% Native142 47.6% Foreign-born
Grandparents responsible for own grandchildren in Meridian
Grandparents (30 to 59 years) White / Caucasian 515 78.3% Responsible for grandchildren143 21.7% Not responsible for grandchildrenAsian 80 100.0% Responsible for grandchildrenTwo or more races 430 100.0% Responsible for grandchildrenWhite alone, not Hispanic / Latino 554 79.1% Responsible for grandchildren146 20.9% Not responsible for grandchildrenHispanic or Latino 273 100.0% Responsible for grandchildrenGrandparents (60 years and over) White / Caucasian 80 8.7% Responsible for grandchildren840 91.3% Not responsible for grandchildrenAsian 97 100.0% Not responsible for grandchildrenTwo or more races 47 100.0% Not responsible for grandchildrenWhite alone, not Hispanic / Latino 74 8.0% Responsible for grandchildren846 92.0% Not responsible for grandchildrenHispanic or Latino 49 100.0% Not responsible for grandchildren