Maryland City, MD (Maryland) Houses and Residents
Estimated median house or condo value in 2022: $388,461 (it was $130,100 in 2000 )
Maryland City:
$388,461Maryland:
$398,100
Lower value quartile - upper value quartile: $322,242 - $462,762Mean price in 2022: Detached houses: $401,566 Here:
$401,566State:
$526,819
Townhouses or other attached units: $379,321 Here:
$379,321State:
$328,305
In 5-or-more-unit structures: $250,591 Here:
$250,591State:
$350,378
Mobile homes: $34,559 Here:
$34,559State:
$89,353
Total population: 16,093 (Urban population: 6,760, Rural population: 0)
Houses: 7,427 (7,243 occupied: 4,625 owner occupied, 2,663 renter occupied )
% of renters here:
37%State:
32%
Housing density: 2,837 houses/condos per square mile
Median price asked for vacant for-sale houses and condos in 2022: $1,077,785.
Median contract rent in 2022: $1,931 (lower quartile is $1,432, upper quartile is over $2,000)
Median rent asked for vacant for-rent units in 2022: $6,506
Median gross rent in Maryland City, MD in 2022: over $2,000
Housing units in Maryland City with a mortgage: 3,512 (245 second mortgage, 46 home equity loan, 190 both second mortgage and home equity loan )Houses without a mortgage: 24
Median household income for houses/condos with a mortgage: $134,906
Median household income for apartments without a mortgage: $76,278
Median monthly housing costs: $1,951
Data:
Median house or condo value ($)
Median house or condo value ($ change since 2000)
Median house or condo value ($) - White
Median house or condo value ($) - Black or African American
Median house or condo value ($) - Asian
Median house or condo value ($) - Hispanic or Latino
Median house or condo value ($) - American Indian and Alaska Native
Median house or condo value ($) - Multirace
Median house or condo value ($) - Other Race
Median price asked for mobile homes ($)
Household density (households per square mile)
Mean house or condo value by units in structure - 1, detached ($)
Mean house or condo value by units in structure - 1, attached ($)
Mean house or condo value by units in structure - 2 ($)
Mean house or condo value by units in structure by units in structure - 3 or 4 ($)
Mean house or condo value by units in structure - 5 or more ($)
Mean house or condo value by units in structure - Boat, RV, van, etc. ($)
Mean house or condo value by units in structure - Mobile home ($)
Median contract rent ($)
Median contract rent - Lower quartile ($)
Median contract rent - Upper quartile ($)
Median gross rent ($)
Urban houses (%)
Rural houses (%)
Houses occupied (%)
Houses occupied (% change since 2000)
Houses owner occupied (%)
Houses owner occupied (% change since 2000)
Houses renter occupied (%)
Houses renter occupied (% change since 2000)
Vacant housing units - For rent (%)
Vacant housing units - For rent (% change since 2000)
Vacant housing units - For sale only (%)
Vacant housing units - For sale only (% change since 2000)
Vacant housing units - Rented or sold, not occupied (%)
Vacant housing units - Rented or sold, not occupied (% change since 2000)
Vacant housing units - For seasonal, recreational, or occasional use (%)
Vacant housing units - For seasonal, recreational, or occasional use (% change since 2000)
Vacant housing units - For migrant workers (%)
Vacant housing units - For migrant workers (% change since 2000)
Vacant housing units - Other vacant (%)
Vacant housing units - Other vacant (% change since 2000)
Median monthly housing costs ($)
Median household income for houses/condos with a mortgage ($)
Median household income for houses/condos without a mortgage ($)
Median household income ($)
Median household income ($) - White
Median household income ($) - Black or African American
Median household income ($) - Asian
Median household income ($) - Hispanic or Latino
Median household income ($) - American Indian and Alaska Native
Median household income ($) - Multirace
Median household income ($) - Other Race
Mortgage status - with mortgage (%)
Mortgage status - with second mortgage (%)
Mortgage status - with home equity loan (%)
Mortgage status - with both second mortgage and home equity loan (%)
Mortgage status - without a mortgage (%)
Median year house/condo built
Median year apartment built
Household type by relationship - Male householder living alone (%)
Household type by relationship - Male householder not living alone (%)
Household type by relationship - Female householder living alone (%)
Household type by relationship - Female householder not living alone (%)
Household type by relationship - Opposite-Sex spouse (%)
Household type by relationship - Same-Sex spouse (%)
Household type by relationship - Opposite-Sex unmarried partner (%)
Household type by relationship - Same-Sex unmarried partner (%)
Household type by relationship - In group quarters (%)
Size of family households - 2-person household (%)
Size of family households - 3-person household (%)
Size of family households - 4-person household (%)
Size of family households - 5-person household (%)
Size of family households - 6-person household (%)
Size of family households - 7-or-more-person household (%)
Size of nonfamily households - 1-person household (%)
Size of nonfamily households - 2-person household (%)
Size of nonfamily households - 3-person household (%)
Size of nonfamily households - 4-person household (%)
Size of nonfamily households - 5-person household (%)
Size of nonfamily households - 6-person household (%)
Size of nonfamily households - 7-or-moreperson household (%)
Year house built - Built 2010 or later (%)
Year house built - Built 2000 to 2009 (%)
Year house built - Built 1990 to 1999 (%)
Year house built - Built 1980 to 1989 (%)
Year house built - Built 1970 to 1979 (%)
Year house built - Built 1960 to 1969 (%)
Year house built - Built 1950 to 1959 (%)
Year house built - Built 1940 to 1949 (%)
Year house built - Built 1939 or earlier (%)
Median number of rooms in houses and condos
Median number of rooms in apartments
Median number of bedrooms in owner occupied houses
Mean number of bedrooms in owner occupied houses
Median number of bedrooms in renter occupied houses
Mean number of bedrooms in renter occupied houses
Median number of vehichles in owner occupied houses
Mean number of vehichles in owner occupied houses
Median number of vehichles in renter occupied houses
Mean number of vehichles in renter occupied houses
Rooms in owner-occupied houses - 1 room (%)
Rooms in owner-occupied houses - 2 rooms (%)
Rooms in owner-occupied houses - 3 rooms (%)
Rooms in owner-occupied houses - 4 rooms (%)
Rooms in owner-occupied houses - 5 rooms (%)
Rooms in owner-occupied houses - 6 rooms (%)
Rooms in owner-occupied houses - 7 rooms (%)
Rooms in owner-occupied houses - 8 rooms (%)
Rooms in owner-occupied houses - 9+ rooms (%)
Rooms in renter-occupied houses - 1 room (%)
Rooms in renter-occupied houses - 2 rooms (%)
Rooms in renter-occupied houses - 3 rooms (%)
Rooms in renter-occupied houses - 4 rooms (%)
Rooms in renter-occupied houses - 5 rooms (%)
Rooms in renter-occupied houses - 6 rooms (%)
Rooms in renter-occupied houses - 7 rooms (%)
Rooms in renter-occupied houses - 8 rooms (%)
Rooms in renter-occupied houses - 9+ rooms (%)
Bedrooms in owner-occupied houses - no bedrooms (%)
Bedrooms in owner-occupied houses - 1 bedroom (%)
Bedrooms in owner-occupied houses - 2 bedrooms (%)
Bedrooms in owner-occupied houses - 3 bedrooms (%)
Bedrooms in owner-occupied houses - 4 bedrooms (%)
Bedrooms in owner-occupied houses - 5+ bedrooms (%)
Bedrooms in renter-occupied houses - no bedrooms (%)
Bedrooms in renter-occupied houses - 1 bedroom (%)
Bedrooms in renter-occupied houses - 2 bedrooms (%)
Bedrooms in renter-occupied houses - 3 bedrooms (%)
Bedrooms in renter-occupied houses - 4 bedrooms (%)
Bedrooms in renter-occupied houses - 5+ bedrooms (%)
Vehicles available in owner-occupied houses - no vehicle available (%)
Vehicles available in owner-occupied houses - 1 vehicle available(%)
Vehicles available in owner-occupied houses - 2 Vehicles available (%)
Vehicles available in owner-occupied houses - 3 Vehicles available (%)
Vehicles available in owner-occupied houses - 4 Vehicles available (%)
Vehicles available in owner-occupied houses - 5+ Vehicles available (%)
Vehicles available in renter-occupied houses - no vehicle available (%)
Vehicles available in renter-occupied houses - 1 vehicle available (%)
Vehicles available in renter-occupied houses - 2 Vehicles available (%)
Vehicles available in renter-occupied houses - 3 Vehicles available (%)
Vehicles available in renter-occupied houses - 4 Vehicles available (%)
Vehicles available in renter-occupied houses - 5+ Vehicles available (%)
Housing units in structures - 1, detached (%)
Housing units in structures - 1, attached (%)
Housing units in structures - 2 (%)
Housing units in structures - 3 or 4 (%)
Housing units in structures - 5 to 9 (%)
Housing units in structures - 10 to 19 (%)
Housing units in structures - 20 to 49 (%)
Housing units in structures - 50 or more (%)
Housing units in structures - Mobile home (%)
Housing units in structures - Boat, RV, van, etc. (%)
Housing units in structures - Owners - 1, detached (%)
Housing units in structures - Owners - 1, attached (%)
Housing units in structures - Owners - 2 (%)
Housing units in structures - Owners - 3 or 4 (%)
Housing units in structures - Owners - 5 to 9 (%)
Housing units in structures - Owners - 10 to 19 (%)
Housing units in structures - Owners - 20 to 49 (%)
Housing units in structures - Owners - 50 or more (%)
Housing units in structures - Owners - Mobile home (%)
Housing units in structures - Owners - Boat, RV, van, etc. (%)
Housing units in structures - Renters - 1, detached (%)
Housing units in structures - Renters - 1, attached (%)
Housing units in structures - Renters - 2 (%)
Housing units in structures - Renters - 3 or 4 (%)
Housing units in structures - Renters - 5 to 9 (%)
Housing units in structures - Renters - 10 to 19 (%)
Housing units in structures - Renters - 20 to 49 (%)
Housing units in structures - Renters - 50 or more (%)
Housing units in structures - Renters - Mobile home (%)
Housing units in structures - Renters - Boat, RV, van, etc. (%)
House/condo owner moved in on average (years ago)
Renter moved in on average (years ago)
Year householder moved into unit - Moved in 1999 to March 2000 (%)
Year householder moved into unit - Moved in 1999 to March 2000 (%) - White
Year householder moved into unit - Moved in 1999 to March 2000 (%) - Black or African American
Year householder moved into unit - Moved in 1999 to March 2000 (%) - Asian
Year householder moved into unit - Moved in 1999 to March 2000 (%) - Hispanic or Latino
Year householder moved into unit - Moved in 1999 to March 2000 (%) - American Indian and Alaska Native
Year householder moved into unit - Moved in 1999 to March 2000 (%) - Multirace
Year householder moved into unit - Moved in 1999 to March 2000 (%) - Other Race
Year householder moved into unit - Moved in 1995 to 1998 (%)
Year householder moved into unit - Moved in 1995 to 1998 (%) - White
Year householder moved into unit - Moved in 1995 to 1998 (%) - Black or African American
Year householder moved into unit - Moved in 1995 to 1998 (%) - Asian
Year householder moved into unit - Moved in 1995 to 1998 (%) - Hispanic or Latino
Year householder moved into unit - Moved in 1995 to 1998 (%) - American Indian and Alaska Native
Year householder moved into unit - Moved in 1995 to 1998 (%) - Multirace
Year householder moved into unit - Moved in 1995 to 1998 (%) - Other Race
Year householder moved into unit - Moved in 1990 to 1994 (%)
Year householder moved into unit - Moved in 1990 to 1994 (%) - White
Year householder moved into unit - Moved in 1990 to 1994 (%) - Black or African American
Year householder moved into unit - Moved in 1990 to 1994 (%) - Asian
Year householder moved into unit - Moved in 1990 to 1994 (%) - Hispanic or Latino
Year householder moved into unit - Moved in 1990 to 1994 (%) - American Indian and Alaska Native
Year householder moved into unit - Moved in 1990 to 1994 (%) - Multirace
Year householder moved into unit - Moved in 1990 to 1994 (%) - Other Race
Year householder moved into unit - Moved in 1980 to 1989 (%)
Year householder moved into unit - Moved in 1980 to 1989 (%) - White
Year householder moved into unit - Moved in 1980 to 1989 (%) - Black or African American
Year householder moved into unit - Moved in 1980 to 1989 (%) - Asian
Year householder moved into unit - Moved in 1980 to 1989 (%) - Hispanic or Latino
Year householder moved into unit - Moved in 1980 to 1989 (%) - American Indian and Alaska Native
Year householder moved into unit - Moved in 1980 to 1989 (%) - Multirace
Year householder moved into unit - Moved in 1980 to 1989 (%) - Other Race
Year householder moved into unit - Moved in 1970 to 1979 (%)
Year householder moved into unit - Moved in 1970 to 1979 (%) - White
Year householder moved into unit - Moved in 1970 to 1979 (%) - Black or African American
Year householder moved into unit - Moved in 1970 to 1979 (%) - Asian
Year householder moved into unit - Moved in 1970 to 1979 (%) - Hispanic or Latino
Year householder moved into unit - Moved in 1970 to 1979 (%) - American Indian and Alaska Native
Year householder moved into unit - Moved in 1970 to 1979 (%) - Multirace
Year householder moved into unit - Moved in 1970 to 1979 (%) - Other Race
Year householder moved into unit - Moved in 1969 or earlier (%)
Year householder moved into unit - Moved in 1969 or earlier (%) - White
Year householder moved into unit - Moved in 1969 or earlier (%) - Black or African American
Year householder moved into unit - Moved in 1969 or earlier (%) - Asian
Year householder moved into unit - Moved in 1969 or earlier (%) - Hispanic or Latino
Year householder moved into unit - Moved in 1969 or earlier (%) - American Indian and Alaska Native
Year householder moved into unit - Moved in 1969 or earlier (%) - Multirace
Year householder moved into unit - Moved in 1969 or earlier (%) - Other Race
Housing units lacking complete plumbing facilities (%)
Housing units lacking complete kitchen facilities (%)
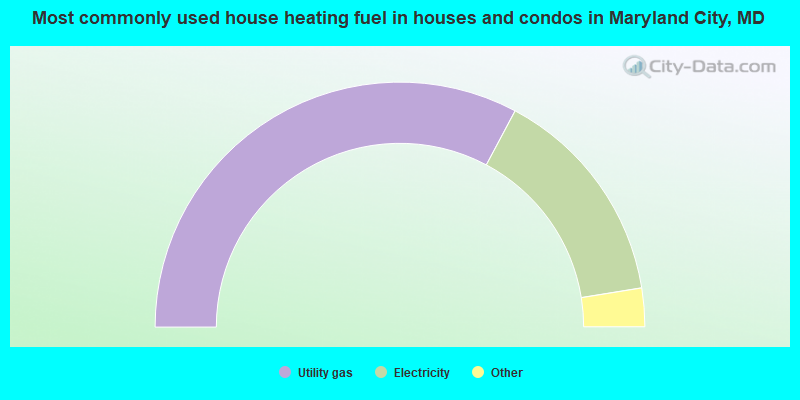
House heating fuel used in houses and condos - Utility gas (%)
House heating fuel used in houses and condos - Bottled, tank, or LP gas (%)
House heating fuel used in houses and condos - Electricity (%)
House heating fuel used in houses and condos - Fuel oil, kerosene, etc. (%)
House heating fuel used in houses and condos - Coal or coke (%)
House heating fuel used in houses and condos - Wood (%)
House heating fuel used in houses and condos - Solar energy (%)
House heating fuel used in houses and condos - Other fuel (%)
House heating fuel used in houses and condos - No fuel used (%)
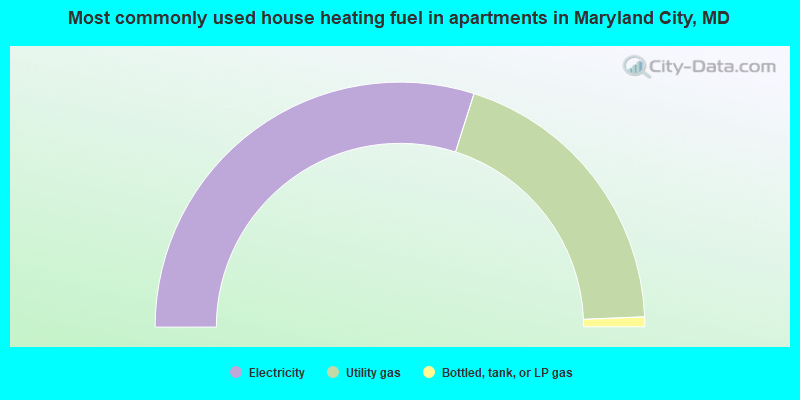
House heating fuel used in apartments - Utility gas (%)
House heating fuel used in apartments - Bottled, tank, or LP gas (%)
House heating fuel used in apartments - Electricity (%)
House heating fuel used in apartments - Fuel oil, kerosene, etc. (%)
House heating fuel used in apartments - Coal or coke (%)
House heating fuel used in apartments - Wood (%)
House heating fuel used in apartments - Solar energy (%)
House heating fuel used in apartments - Other fuel (%)
House heating fuel used in apartments - No fuel used (%)
Median year house/condo built: 1994Median year apartment built: 1991Household type by relationship:
Households: 18,506
Male householders: 3,574 (1,254 living alone ), Female householders: 3,630 (992 living alone )2,963 spouses (2,963 opposite-sex spouses ), 628 unmarried partners , (628 opposite-sex unmarried partners ), 5,496 children (5,212 natural , 230 adopted , 54 stepchildren ), 366 grandchildren , 245 brothers or sisters , 444 parents , 0 foster children , 475 other relatives , 642 non-relatives In group quarters: 38
Size of family households: 1,636 2-persons , 1,400 3-persons , 876 4-persons , 460 5-persons , 93 6-persons , 49 7-or-more-persons .
Size of nonfamily households: 2,354 1-person , 343 2-persons , 89 3-persons .
1,964 married couples with children. single-parent households (443 men , 1,393 women ).
74.6% of residents of Maryland City speak English at home. of residents speak Spanish at home (60% speak English very well , 11% speak English well , 17% speak English not well , 12% don't speak English at all ).of residents speak other Indo-European language at home (55% speak English very well , 9% speak English well , 23% speak English not well , 13% don't speak English at all ).of residents speak Asian or Pacific Island language at home (42% speak English very well , 27% speak English well , 23% speak English not well , 8% don't speak English at all ).of residents speak other language at home (95% speak English very well , 5% speak English not well ).
Foreign born population: 4,472 (24.2%)of them are naturalized citizens )
Median number of rooms in houses and condos:
Median number of rooms in apartments
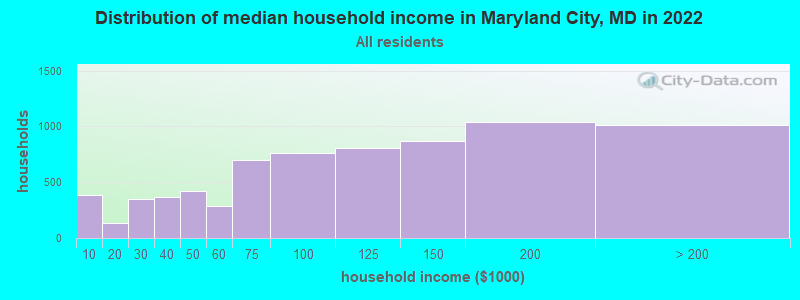
Maryland City, MD household income distribution 390 Less than $10,000133 $10,000 to $19,999349 $20,000 to $29,999366 $30,000 to $39,999418 $40,000 to $49,999283 $50,000 to $59,999696 $60,000 to $74,999765 $75,000 to $99,999808 $100,000 to $124,999867 $125,000 to $149,9991,040 $150,000 to $199,9991,009 $200,000 or more
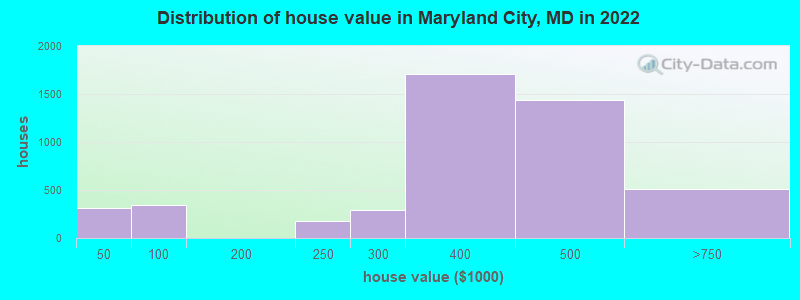
Home value of owner - occupied houses in 2022 in Maryland City, MD 78 Less than $10,00027 $35,000 to $39,999211 $40,000 to $49,999133 $50,000 to $59,999175 $200,000 to $249,999295 $250,000 to $299,9991,707 $300,000 to $399,9991,434 $400,000 to $499,999493 $500,000 to $749,99920 $1,000,000 to $1,499,999Rent paid by renters in 2022 in Maryland City, MD 35 $150 to $19935 $900 to $999268 $1,000 to $1,249187 $1,250 to $1,499764 $1,500 to $1,9991,093 $2,000 to $2,49944 $2,500 to $2,99934 No cash rent
Percentage of workers working in this county: 41.3%Number of people working at home: 2,035 (19.7% of all workers )
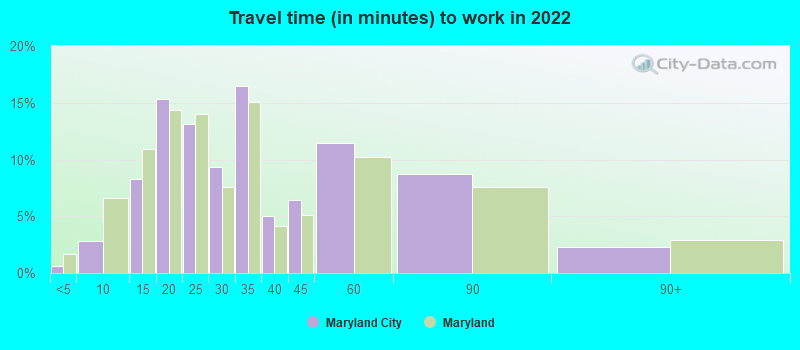
Travel time to work (commute)
Less than 5 minutes: 05 to 9 minutes: 51310 to 14 minutes: 88715 to 19 minutes: 1,02120 to 24 minutes: 97925 to 29 minutes: 87630 to 34 minutes: 1,32535 to 39 minutes: 38140 to 44 minutes: 35345 to 59 minutes: 1,03160 to 89 minutes: 75290 or more minutes: 216
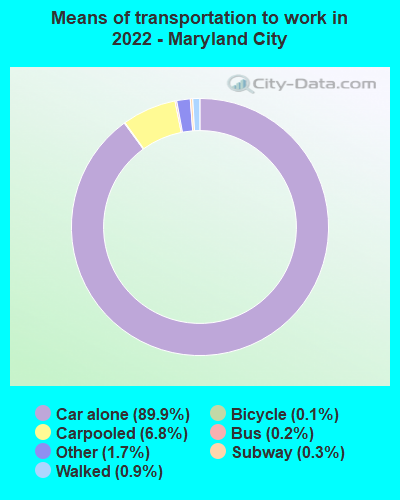
Means of transportation to work:
Drove a car alone: 16,649 (79.2%)Carpooled: 1,273 (6.1%)Bus : 23 (0.1%)Long-distance train or commuter rail : 30 (0.1%)Taxi: 385 (1.8%)Bicycle: 20 (0.1%)Walked: 172 (0.8%)Worked at home: 2,035 (9.7%)
Unemployment by race in 2022
Unemployment rate for White non-Hispanic residents 14.9% Males1.7% FemalesUnemployment rate for Black residents 13.0% Males3.7% FemalesUnemployment rate for Asian residents 1.9% FemalesUnemployment rate for other race residents 10.0% MalesUnemployment rate for two or more race residents 14.1% Males38.5% FemalesUnemployment rate for Hispanic or Latino residents 3.8% Males5.0% Females
Year of entry for the foreign-born population in Maryland City, Maryland
1,940 2010 or later 1,695 2000 to 2009 339 1990 to 1999 273 1980 to 1989 55 1970 to 1979 131 Before 1970
First ancestries reported:
African: 603 (5.1%)
Irish: 570 (4.8%)
Nigerian: 474 (4.0%)
German: 367 (3.1%)
American: 340 (2.9%)
Jamaican: 320 (2.7%)
Ghanaian: 279 (2.3%)
Sierra Leonean: 169 (1.4%)
European: 131 (1.1%)
Italian: 103 (0.9%)
English: 98 (0.8%)
Greek: 74 (0.6%)
West Indian: 50 (0.4%)
Polish: 40 (0.3%)
Bahamian: 39 (0.3%)
British West Indian: 39 (0.3%)
Trinidadian and Tobagonian: 27 (0.2%)
Welsh: 24 (0.2%)
French Canadian: 19 (0.2%)
Senegalese: 18 (0.2%)
Canadian: 17 (0.1%)
Guyanese: 11 (0.09%)
Scotch-Irish: 8 (0.07%)
Slovak: 3 (0.03%) Most common places of birth for foreign-born residents (%): Mexico Maryland City:
14.2% (657)Maryland:
3.5% (34,065)
El Salvador Maryland City:
10.9% (504)Maryland:
12.0% (115,412)
Guatemala Maryland City:
8.9% (409)Maryland:
4.4% (42,350)
Nigeria Maryland City:
8.1% (373)Maryland:
4.6% (44,825)
Cameroon Maryland City:
8.0% (371)Maryland:
2.5% (23,969)
Jamaica Maryland City:
6.4% (296)Maryland:
2.8% (27,444)
Ghana Maryland City:
6.1% (283)Maryland:
1.8% (17,774)
India Maryland City:
3.7% (171)Maryland:
6.4% (61,725)
Nepal Maryland City:
3.1% (141)Maryland:
1.1% (10,205)
Germany Maryland City:
2.5% (114)Maryland:
1.2% (11,265)
Jordan Maryland City:
2.4% (112)Maryland:
0.1% (1,277)
Peru Maryland City:
2.3% (108)Maryland:
1.8% (17,161)
South Africa Maryland City:
2.1% (99)Maryland:
0.3% (3,203)
Venezuela Maryland City:
2.0% (91)Maryland:
0.5% (4,901)
China, excluding Hong Kong and Taiwan Maryland City:
1.9% (87)Maryland:
4.6% (44,742)
Panama Maryland City:
1.8% (82)Maryland:
0.3% (2,848)
Sierra Leone Maryland City:
1.8% (81)Maryland:
1.1% (10,233)
Belize Maryland City:
1.7% (77)Maryland:
0.0% (476)
Vietnam Maryland City:
1.6% (76)Maryland:
1.9% (18,716)
Place of birth for U.S.-born residents:
This state: 6,836Other state: 6,654Northeast: 1,804Midwest: 894South: 3,183West: 789 81.7% of Maryland City residents lived in the same house 1 years ago.
Out of people who lived in different houses, 12.2% lived in this county.
Out of people who lived in different counties, 90.2% lived in Maryland.
Maryland City:
81.7%State average:
88.5%
Education attainment for males 25 years and older:
No schooling: 103Nursery to 4th grade: 05th and 6th grade: 07th and 8th grade: 09th grade: 010th grade: 011th grade: 2612th grade, no diploma: 158High school graduate (or equivalency): 1,570Less than 1 year of college: 171Some college more than 1 year, no degree: 821Associate degree: 292Bachelor's degree: 1,940Master's degree: 783Professional school degree: 44Doctorate degree: 242
Education attainment for females 25 years and older:
No schooling: 195Nursery to 4th grade: 115th and 6th grade: 337th and 8th grade: 99th grade: 010th grade: 5211th grade: 26312th grade, no diploma: 59High school graduate (or equivalency): 899Less than 1 year of college: 361Some college more than 1 year, no degree: 607Associate degree: 524Bachelor's degree: 1,975Master's degree: 1,128Professional school degree: 238Doctorate degree: 127
Housing units in structures:
One, detached: 2,385One, attached: 2,684Two: 1243 or 4: 1285 to 9: 70610 to 19: 54920 to 49: 14050 or more: 463Mobile homes: 242Median worth of mobile homes: $47,349
Housing units lacking complete plumbing facilities in 2022: 3.5%Housing units lacking complete kitchen facilities in 2022: 3.5%House/condo owner moved in on average 11 years ago
Renter moved in on average 1 years ago
Private vs. public school enrollment:
Students in private schools in grades 1 to 8 (elementary and middle school): 487 Students in private schools in grades 9 to 12 (high school): 160 Students in private undergraduate colleges: 116