Races in Maryland City, Maryland (MD) Detailed Stats
Data:
Races - White alone (%)
Races - White alone (% change since 2000)
Races - Black alone (%)
Races - Black alone (% change since 2000)
Races - American Indian alone (%)
Races - American Indian alone (% change since 2000)
Races - Asian alone (%)
Races - Asian alone (% change since 2000)
Races - Hispanic (%)
Races - Hispanic (% change since 2000)
Races - Native Hawaiian and Other Pacific Islander alone (%)
Races - Native Hawaiian and Other Pacific Islander alone (% change since 2000)
Races - Two or more races(%)
Races - Two or more races(% change since 2000)
Races - Other race alone (%)
Races - Other race alone (% change since 2000)
Racial diversity
Place of birth - Born in state of residence (%)
Place of birth - Born in state of residence (%) - White
Place of birth - Born in state of residence (%) - Black or African American
Place of birth - Born in state of residence (%) - Asian
Place of birth - Born in state of residence (%) - Hispanic or Latino
Place of birth - Born in state of residence (%) - American Indian and Alaska Native
Place of birth - Born in state of residence (%) - Multirace
Place of birth - Born in state of residence (%) - Other Race
Place of birth - Born in other state (%)
Place of birth - Born in other state (%) - White
Place of birth - Born in other state (%) - Black or African American
Place of birth - Born in other state (%) - Asian
Place of birth - Born in other state (%) - Hispanic or Latino
Place of birth - Born in other state (%) - American Indian and Alaska Native
Place of birth - Born in other state (%) - Multirace
Place of birth - Born in other state (%) - Other Race
Place of birth - Native, outside of US (%)
Place of birth - Native, outside of US (%) - White
Place of birth - Native, outside of US (%) - Black or African American
Place of birth - Native, outside of US (%) - Asian
Place of birth - Native, outside of US (%) - Hispanic or Latino
Place of birth - Native, outside of US (%) - American Indian and Alaska Native
Place of birth - Native, outside of US (%) - Multirace
Place of birth - Native, outside of US (%) - Other Race
Place of birth - Foreign born (%)
Place of birth - Foreign born (%) - White
Place of birth - Foreign born (%) - Black or African American
Place of birth - Foreign born (%) - Asian
Place of birth - Foreign born (%) - Hispanic or Latino
Place of birth - Foreign born (%) - American Indian and Alaska Native
Place of birth - Foreign born (%) - Multirace
Place of birth - Foreign born (%) - Other Race
Residents speaking English at home (%)
Residents speaking English at home - Born in the United States (%)
Residents speaking English at home - Native, born elsewhere (%)
Residents speaking English at home - Foreign born (%)
Residents speaking Spanish at home (%)
Residents speaking Spanish at home - Born in the United States (%)
Residents speaking Spanish at home - Native, born elsewhere (%)
Residents speaking Spanish at home - Foreign born (%)
Residents speaking other language at home (%)
Residents speaking other language at home - Born in the United States (%)
Residents speaking other language at home - Native, born elsewhere (%)
Residents speaking other language at home - Foreign born (%)
Marital status - Never married (%)
Marital status - Now married (%)
Marital status - Separated (%)
Marital status - Widowed (%)
Marital status - Divorced (%)
Ancestries Reported - Arab (%)
Ancestries Reported - Czech (%)
Ancestries Reported - Danish (%)
Ancestries Reported - Dutch (%)
Ancestries Reported - English (%)
Ancestries Reported - French (%)
Ancestries Reported - French Canadian (%)
Ancestries Reported - German (%)
Ancestries Reported - Greek (%)
Ancestries Reported - Hungarian (%)
Ancestries Reported - Irish (%)
Ancestries Reported - Italian (%)
Ancestries Reported - Lithuanian (%)
Ancestries Reported - Norwegian (%)
Ancestries Reported - Polish (%)
Ancestries Reported - Portuguese (%)
Ancestries Reported - Russian (%)
Ancestries Reported - Scotch-Irish (%)
Ancestries Reported - Scottish (%)
Ancestries Reported - Slovak (%)
Ancestries Reported - Subsaharan African (%)
Ancestries Reported - Swedish (%)
Ancestries Reported - Swiss (%)
Ancestries Reported - Ukrainian (%)
Ancestries Reported - United States (%)
Ancestries Reported - Welsh (%)
Ancestries Reported - West Indian (%)
Ancestries Reported - Other (%)
Geographical mobility - Same house 1 year ago (%)
Geographical mobility - Same house 1 year ago (%) - White
Geographical mobility - Same house 1 year ago (%) - Black or African American
Geographical mobility - Same house 1 year ago (%) - Asian
Geographical mobility - Same house 1 year ago (%) - Hispanic or Latino
Geographical mobility - Same house 1 year ago (%) - American Indian and Alaska Native
Geographical mobility - Same house 1 year ago (%) - Multirace
Geographical mobility - Same house 1 year ago (%) - Other Race
Geographical mobility - Moved within same county (%)
Geographical mobility - Moved within same county (%) - White
Geographical mobility - Moved within same county (%) - Black or African American
Geographical mobility - Moved within same county (%) - Asian
Geographical mobility - Moved within same county (%) - Hispanic or Latino
Geographical mobility - Moved within same county (%) - American Indian and Alaska Native
Geographical mobility - Moved within same county (%) - Multirace
Geographical mobility - Moved within same county (%) - Other Race
Geographical mobility - Moved from different county within same state (%)
Geographical mobility - Moved from different county within same state (%) - White
Geographical mobility - Moved from different county within same state (%) - Black or African American
Geographical mobility - Moved from different county within same state (%) - Asian
Geographical mobility - Moved from different county within same state (%) - Hispanic or Latino
Geographical mobility - Moved from different county within same state (%) - American Indian and Alaska Native
Geographical mobility - Moved from different county within same state (%) - Multirace
Geographical mobility - Moved from different county within same state (%) - Other Race
Geographical mobility - Moved from different state (%)
Geographical mobility - Moved from different state (%) - White
Geographical mobility - Moved from different state (%) - Black or African American
Geographical mobility - Moved from different state (%) - Asian
Geographical mobility - Moved from different state (%) - Hispanic or Latino
Geographical mobility - Moved from different state (%) - American Indian and Alaska Native
Geographical mobility - Moved from different state (%) - Multirace
Geographical mobility - Moved from different state (%) - Other Race
Geographical mobility - Moved from abroad (%)
Geographical mobility - Moved from abroad (%) - White
Geographical mobility - Moved from abroad (%) - Black or African American
Geographical mobility - Moved from abroad (%) - Asian
Geographical mobility - Moved from abroad (%) - Hispanic or Latino
Geographical mobility - Moved from abroad (%) - American Indian and Alaska Native
Geographical mobility - Moved from abroad (%) - Multirace
Geographical mobility - Moved from abroad (%) - Other Race
Place of birth for the foreign-born population - Ireland (%)
Place of birth for the foreign-born population - Denmark (%)
Place of birth for the foreign-born population - Norway (%)
Place of birth for the foreign-born population - Sweden (%)
Place of birth for the foreign-born population - United Kingdom (%)
Place of birth for the foreign-born population - England (%)
Place of birth for the foreign-born population - Scotland (%)
Place of birth for the foreign-born population - Other Northern Europe (%)
Place of birth for the foreign-born population - Austria (%)
Place of birth for the foreign-born population - Belgium (%)
Place of birth for the foreign-born population - France (%)
Place of birth for the foreign-born population - Germany (%)
Place of birth for the foreign-born population - Netherlands (%)
Place of birth for the foreign-born population - Switzerland (%)
Place of birth for the foreign-born population - Other Western Europe (%)
Place of birth for the foreign-born population - Greece (%)
Place of birth for the foreign-born population - Italy (%)
Place of birth for the foreign-born population - Portugal (%)
Place of birth for the foreign-born population - Spain (%)
Place of birth for the foreign-born population - Other Southern Europe (%)
Place of birth for the foreign-born population - Albania (%)
Place of birth for the foreign-born population - Belarus (%)
Place of birth for the foreign-born population - Bosnia and Herzegovina (%)
Place of birth for the foreign-born population - Bulgaria (%)
Place of birth for the foreign-born population - Croatia (%)
Place of birth for the foreign-born population - Czechoslovakia (%)
Place of birth for the foreign-born population - Hungary (%)
Place of birth for the foreign-born population - Latvia (%)
Place of birth for the foreign-born population - Lithuania (%)
Place of birth for the foreign-born population - North Macedonia (Macedonia) (%)
Place of birth for the foreign-born population - Moldova (%)
Place of birth for the foreign-born population - Poland (%)
Place of birth for the foreign-born population - Romania (%)
Place of birth for the foreign-born population - Russia (%)
Place of birth for the foreign-born population - Serbia (%)
Place of birth for the foreign-born population - Ukraine (%)
Place of birth for the foreign-born population - Other Eastern Europe (%)
Place of birth for the foreign-born population - China (%)
Place of birth for the foreign-born population - Hong Kong (%)
Place of birth for the foreign-born population - Taiwan (%)
Place of birth for the foreign-born population - Japan (%)
Place of birth for the foreign-born population - Korea (%)
Place of birth for the foreign-born population - Other Eastern Asia (%)
Place of birth for the foreign-born population - Afghanistan (%)
Place of birth for the foreign-born population - Bangladesh (%)
Place of birth for the foreign-born population - India (%)
Place of birth for the foreign-born population - Iran (%)
Place of birth for the foreign-born population - Kazakhstan (%)
Place of birth for the foreign-born population - Nepal (%)
Place of birth for the foreign-born population - Pakistan (%)
Place of birth for the foreign-born population - Sri Lanka (%)
Place of birth for the foreign-born population - Uzbekistan (%)
Place of birth for the foreign-born population - Other South Central Asia (%)
Place of birth for the foreign-born population - Burma (%)
Place of birth for the foreign-born population - Cambodia (%)
Place of birth for the foreign-born population - Indonesia (%)
Place of birth for the foreign-born population - Laos (%)
Place of birth for the foreign-born population - Malaysia (%)
Place of birth for the foreign-born population - Philippines (%)
Place of birth for the foreign-born population - Singapore (%)
Place of birth for the foreign-born population - Thailand (%)
Place of birth for the foreign-born population - Vietnam (%)
Place of birth for the foreign-born population - Other South Eastern Asia (%)
Place of birth for the foreign-born population - Armenia (%)
Place of birth for the foreign-born population - Iraq (%)
Place of birth for the foreign-born population - Israel (%)
Place of birth for the foreign-born population - Jordan (%)
Place of birth for the foreign-born population - Kuwait (%)
Place of birth for the foreign-born population - Lebanon (%)
Place of birth for the foreign-born population - Saudi Arabia (%)
Place of birth for the foreign-born population - Syria (%)
Place of birth for the foreign-born population - Turkey (%)
Place of birth for the foreign-born population - Yemen (%)
Place of birth for the foreign-born population - Other Western Asia (%)
Place of birth for the foreign-born population - Eritrea (%)
Place of birth for the foreign-born population - Ethiopia (%)
Place of birth for the foreign-born population - Kenya (%)
Place of birth for the foreign-born population - Somalia (%)
Place of birth for the foreign-born population - Uganda (%)
Place of birth for the foreign-born population - Zimbabwe (%)
Place of birth for the foreign-born population - Other Eastern Africa (%)
Place of birth for the foreign-born population - Cameroon (%)
Place of birth for the foreign-born population - Congo (%)
Place of birth for the foreign-born population - Democratic Republic of Congo (Zaire) (%)
Place of birth for the foreign-born population - Other Middle Africa (%)
Place of birth for the foreign-born population - Egypt (%)
Place of birth for the foreign-born population - Morocco (%)
Place of birth for the foreign-born population - Sudan (%)
Place of birth for the foreign-born population - Other Northern Africa (%)
Place of birth for the foreign-born population - South Africa (%)
Place of birth for the foreign-born population - Other Southern Africa (%)
Place of birth for the foreign-born population - Cabo Verde (%)
Place of birth for the foreign-born population - Ghana (%)
Place of birth for the foreign-born population - Liberia (%)
Place of birth for the foreign-born population - Nigeria (%)
Place of birth for the foreign-born population - Senegal (%)
Place of birth for the foreign-born population - Sierra Leone (%)
Place of birth for the foreign-born population - Other Western Africa (%)
Place of birth for the foreign-born population - Australia (%)
Place of birth for the foreign-born population - New Zealand (%)
Place of birth for the foreign-born population - Fiji (%)
Place of birth for the foreign-born population - Micronesia (%)
Place of birth for the foreign-born population - Bahamas (%)
Place of birth for the foreign-born population - Barbados (%)
Place of birth for the foreign-born population - Cuba (%)
Place of birth for the foreign-born population - Dominica (%)
Place of birth for the foreign-born population - Dominican Republic (%)
Place of birth for the foreign-born population - Grenada (%)
Place of birth for the foreign-born population - Haiti (%)
Place of birth for the foreign-born population - Jamaica (%)
Place of birth for the foreign-born population - St. Vincent and the Grenadines (%)
Place of birth for the foreign-born population - Trinidad and Tobago (%)
Place of birth for the foreign-born population - West Indies (%)
Place of birth for the foreign-born population - Other Caribbean (%)
Place of birth for the foreign-born population - Belize (%)
Place of birth for the foreign-born population - Costa Rica (%)
Place of birth for the foreign-born population - El Salvador (%)
Place of birth for the foreign-born population - Guatemala (%)
Place of birth for the foreign-born population - Honduras (%)
Place of birth for the foreign-born population - Mexico (%)
Place of birth for the foreign-born population - Nicaragua (%)
Place of birth for the foreign-born population - Panama (%)
Place of birth for the foreign-born population - Other Central America (%)
Place of birth for the foreign-born population - Argentina (%)
Place of birth for the foreign-born population - Bolivia (%)
Place of birth for the foreign-born population - Brazil (%)
Place of birth for the foreign-born population - Chile (%)
Place of birth for the foreign-born population - Colombia (%)
Place of birth for the foreign-born population - Ecuador (%)
Place of birth for the foreign-born population - Guyana (%)
Place of birth for the foreign-born population - Peru (%)
Place of birth for the foreign-born population - Uruguay (%)
Place of birth for the foreign-born population - Venezuela (%)
Place of birth for the foreign-born population - Other South America (%)
Place of birth for the foreign-born population - Canada (%)
Place of birth for the foreign-born population - Other Northern America (%)
Place of birth for the foreign-born population - Other (%)
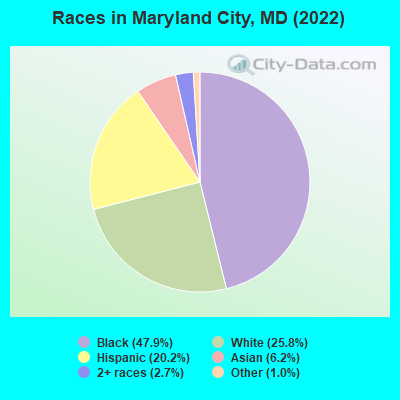
According to 2022 data, the most numerous races in Maryland City, MD are White alone (4,778 residents), Black alone (8,859 residents), and Hispanic (3,745 residents). 74.9% of Maryland City residents speak English at home. 25.0% of Maryland City, MD residents are foreign-born (12.6% born in Latin America, 6.1% born in Africa, 4.3% born in Asia), which is 35.9% greater than the foreign-born rate of 16.0% across the entire state of Maryland.
Race distribution in Maryland City
2000 2022
3,286,547 62.1% White alone 1,464,735 27.7% Black alone 227,916 4.3% Hispanic 209,738 4.0% Asian alone 82,946 1.6% Two or more races 13,312 0.3% American Indian alone 9,379 0.2% Other race alone 1,913 0.04% Native Hawaiian and Other
2,906,492 47.1% White alone 1,800,914 29.2% Black alone 705,842 11.4% Hispanic 401,818 6.5% Asian alone 291,317 4.7% Two or more races 46,930 0.8% Other race alone 8,930 0.1% American Indian alone 2,417 0.04% Native Hawaiian and Other
Income and house value in Maryland City Median household income in 2022 $82,352 White non-Hispanic householders$113,217 Black householders$66,004 American Indian and Alaska Native householders$99,024 Asian householders$94,460 Some other race householders$66,248 Hispanic or Latino race householdersMedian 2022 house value $402,494 White Non-Hispanic householders$398,911 Black or African American householders $410,556 Asian householders$410,556 Some other race householders$414,438 Two or more races householders$397,717 Hispanic or Latino householders
Median age by race in Maryland City
33.2 Median age for White residents29.3 36.0 37.6 Median age for Black or African American residents41.7 35.6 38.0 Median age for American Indian / Alaska Native residents43.3 40.4 33.0 Median age for Asian residents36.2 32.4 -534,101,824.6 Median age for Native Hawaiian / Pacific Islander residents-720,061,021.4 -760,942,760.2 33.6 Median age for Other race residents34.3 32.3 23.5 Median age for Two or more races residents24.6 22.4 39.1 Median age for White alone residents32.6 44.4 24.8 Median age for Hispanic or Latino residents28.0 22.1
Owner/renter occupied households by race in Maryland City
House owners and renters - White residents 1,791 78.6% Owner occupied488 21.4% Renter occupiedHouse owners and renters - Black or African American residents 2,191 56.8% Owner occupied1,667 43.2% Renter occupiedHouse owners and renters - American Indian / Alaska Native residents 44 23.1% Owner occupied146 76.9% Renter occupiedHouse owners and renters - Asian residents 380 96.2% Owner occupied15 3.8% Renter occupiedHouse owners and renters - Other race residents 345 47.2% Owner occupied385 52.8% Renter occupiedHouse owners and renters - Two or more races residents 133 49.1% Owner occupied138 50.9% Renter occupiedHouse owners and renters - White alone residents 1,552 75.7% Owner occupied497 24.3% Renter occupiedHouse owners and renters - Hispanic or Latino residents 629 58.6% Owner occupied444 41.4% Renter occupied
Language usage in Maryland City
English speakers - Total 74.9% of residents of Maryland City speak English at home.
16.3% of residents speak Spanish at home 1,744 61.7% Speak English very well1,082 38.3% Speak English less than very well9.5% of residents speak other language at home 1,171 71.4% Speak English very well469 28.6% Speak English less than very well
English speakers - Born in the United States 95.3% of residents of Maryland City speak English at home.
2.9% of residents speak Spanish at home 182 97.3% Speak English very well5 2.7% Speak English less than very well1.5% of residents speak other language at home 99 100.0% Speak English very well
English speakers - Native, born elsewhere 43.6% of residents of Maryland City speak English at home.
59.2% of residents speak Spanish at home 386 100.0% Speak English very well4.6% of residents speak other language at home 30 100.0% Speak English very well
English speakers - Foreign-born 26.2% of residents of Maryland City speak English at home.
41.5% of residents speak Spanish at home 692 37.2% Speak English very well1,169 62.8% Speak English less than very well31.1% of residents speak other language at home 1,020 73.2% Speak English very well373 26.8% Speak English less than very well
White (Caucasian) - Speak only English Native:
94.7% (4,541)Foreign-born:
12.8% (50)
White (Caucasian) - Speak another language Native:
4.6% (220)Foreign-born:
78.9% (306)
Black or African American - Speak only English Native:
97.5% (6,337)Foreign-born:
53.3% (954)
Black or African American - Speak another language Native:
2.0% (128)Foreign-born:
43.6% (781)
American Indian / Alaska Native - Speak another language Native:
100.0% (40)Foreign-born:
98.5% (770)
Asian - Speak only English Native:
24.4% (44)Foreign-born:
3.9% (32)
Asian - Speak another language Native:
79.6% (145)Foreign-born:
96.9% (792)
Other race - Speak only English Native:
60.5% (435)Foreign-born:
12.6% (130)
Other race - Speak another language Native:
36.3% (261)Foreign-born:
80.2% (828)
Two or more races - Speak only English Native:
50.4% (474)Foreign-born:
51.4% (99)
Two or more races - Speak another language Native:
65.2% (614)Foreign-born:
59.5% (114)
White alone - Speak only English Native:
99.1% (4,503)Foreign-born:
34.9% (53)
White alone - Speak another language Native:
1.0% (45)Foreign-born:
65.1% (99)
Hispanic or Latino - Speak only English Native:
37.2% (530)Foreign-born:
6.3% (117)
Hispanic or Latino - Speak another language Native:
62.0% (885)Foreign-born:
94.8% (1,759)
Foreign-born residents in Maryland City 4,621 residents are foreign born (12.6% Latin America , 6.1% Africa , 4.3% Asia ).
This city:
25.0%Maryland:
15.7%
Marital status for residents in Maryland City Marital status - White (Caucasian) population 15 years and over
Males 51.6% Never married40.3% Now married0.5% Separated0.0% Widowed7.6% DivorcedFemales 23.7% Never married41.3% Now married6.5% Separated9.0% Widowed19.5% DivorcedWomen who gave birth in the past 12 months Now married:
100.0% (16)Unmarried:
0.0% (0)
Women who did not give birth in the past 12 months Now married:
36.5% (384)Unmarried:
63.5% (668)
Marital status - Black or African American population 15 years and over
Males 37.0% Never married43.5% Now married10.9% Separated0.0% Widowed8.6% DivorcedFemales 48.0% Never married35.7% Now married0.0% Separated2.5% Widowed13.7% DivorcedWomen who gave birth in the past 12 months Now married:
40.4% (61)Unmarried:
59.6% (90)
Women who did not give birth in the past 12 months Now married:
32.7% (848)Unmarried:
67.3% (1,742)
Marital status - American Indian / Alaska Native population 15 years and over
Males 58.0% Never married42.0% Now married0.0% Separated0.0% Widowed0.0% DivorcedFemales 15.6% Never married64.9% Now married0.0% Separated19.5% Widowed0.0% DivorcedWomen who gave birth in the past 12 months Now married:
100.0% (97)Unmarried:
0.0% (0)
Women who did not give birth in the past 12 months Now married:
68.0% (102)Unmarried:
32.0% (48)
Marital status - Asian population 15 years and over
Males 22.0% Never married76.1% Now married0.0% Separated0.0% Widowed2.0% DivorcedFemales 6.8% Never married89.0% Now married0.0% Separated0.0% Widowed4.3% DivorcedWomen who did not give birth in the past 12 months Now married:
89.9% (274)Unmarried:
10.1% (31)
Marital status - Other race population 15 years and over
Males 36.5% Never married63.5% Now married0.0% Separated0.0% Widowed0.0% DivorcedFemales 32.3% Never married43.0% Now married16.2% Separated0.0% Widowed8.5% DivorcedWomen who did not give birth in the past 12 months Now married:
64.7% (346)Unmarried:
35.3% (189)
Marital status - Two or more races population 15 years and over
Males 72.1% Never married27.9% Now married0.0% Separated0.0% Widowed0.0% DivorcedFemales 58.9% Never married31.5% Now married0.0% Separated0.0% Widowed9.6% DivorcedWomen who did not give birth in the past 12 months Now married:
24.7% (131)Unmarried:
75.3% (400)
Marital status - White alone, not Hispanic / Latino population 15 years and over
Males 46.3% Never married44.7% Now married0.5% Separated0.0% Widowed8.5% DivorcedFemales 18.0% Never married45.0% Now married5.5% Separated10.0% Widowed21.5% DivorcedWomen who gave birth in the past 12 months Now married:
100.0% (8)Unmarried:
0.0% (0)
Women who did not give birth in the past 12 months Now married:
40.6% (363)Unmarried:
59.4% (531)
Marital status - Hispanic or Latino population 15 years and over
Males 50.7% Never married48.1% Now married0.0% Separated0.0% Widowed1.1% DivorcedFemales 45.1% Never married40.2% Now married10.9% Separated3.6% Widowed0.2% DivorcedWomen who gave birth in the past 12 months Now married:
100.0% (83)Unmarried:
0.0% (0)
Women who did not give birth in the past 12 months Now married:
47.3% (483)Unmarried:
52.7% (538)
Ancestries in Maryland City
603 5.1% African570 4.8% Irish474 4.0% Nigerian367 3.1% German340 2.9% American320 2.7% Jamaican279 2.3% Ghanaian169 1.4% Sierra Leonean131 1.1% European103 0.9% Italian98 0.8% English74 0.6% Greek50 0.4% West Indian40 0.3% Polish39 0.3% Bahamian39 0.3% British West Indian27 0.2% Trinidadian and Tobagonian24 0.2% Welsh19 0.2% French Canadian18 0.2% Senegalese17 0.1% Canadian11 0.09% Guyanese8 0.07% Scotch-Irish3 0.03% Slovak
Geographical mobility in Maryland City Same house 1 year ago 4,345 76.6% White (Caucasian)7,653 88.5% Black or African American644 74.1% American Indian / Alaska Native911 79.4% Asian1,123 66.3% Other race1,210 98.1% Two or more races4,071 85.3% White alone, not Hispanic / Latino2,426 64.7% Hispanic or LatinoMoved within same county 194 3.4% White / Caucasian216 24.8% American Indian / Alaska Native81 7.1% Asian6 0.3% Other race194 4.1% White alone, not Hispanic / Latino142 3.8% Hispanic or LatinoMoved within same state 826 14.6% White / Caucasian1,075 12.4% Black or African American69 6.0% Asian545 32.1% Other race66 5.3% Two or more races253 5.3% White alone, not Hispanic / Latino845 22.6% Hispanic or LatinoMoved from different state 266 4.7% White / Caucasian17 0.2% Black or African American261 5.5% White alone, not Hispanic / Latino9 0.2% Hispanic or LatinoMoved from abroad 113 6.7% Other race135 3.6% Hispanic or Latino
Children Nativity (place of birth) in Maryland City
Children under 6 years - Living with two parents Both parents native 435 100.0% NativeBoth parents foreign-born 405 100.0% NativeOne native, one foreign-born parent 137 100.0% NativeChildren under 6 years - Living with one parent Native parent 275 100.0% NativeForeign-born parent 196 71.0% Native80 29.0% Foreign-bornChildren 6 to 17 years - Living with two parents Both parents native 333 100.0% NativeBoth parents foreign-born 469 73.6% Native168 26.4% Foreign-bornOne native, one foreign-born parent 190 100.0% NativeChildren 6 to 17 years - Living with one parent Native parent 718 100.0% NativeForeign-born parent 482 64.9% Native261 35.1% Foreign-born
Grandparents responsible for own grandchildren in Maryland City
Grandparents (30 to 59 years) White / Caucasian 10 100.0% Not responsible for grandchildrenWhite alone, not Hispanic / Latino 10 100.0% Not responsible for grandchildren
Grandparents (60 years and over) White / Caucasian 25 100.0% Not responsible for grandchildrenWhite alone, not Hispanic / Latino 26 100.0% Not responsible for grandchildren