Martha Lake, WA (Washington) Houses and Residents
| Martha Lake: | $812,215 |
| Washington: | $569,500 |
Mean price in 2022:
Detached houses: $616,519
Here: $616,519 State: $734,307 Townhouses or other attached units: $580,499
Here: $580,499 State: $657,697 In 2-unit structures: $345,216
Here: $345,216 State: $534,634 In 3-to-4-unit structures: $193,966
Here: $193,966 State: $510,239 In 5-or-more-unit structures: $364,288
Here: $364,288 State: $503,183 Mobile homes: $50,340
Here: $50,340 State: $218,362
Total population: 15,473 (Urban population: 12,640, Rural population: 0)
Houses: 8,257 (8,221 occupied: 5,262 owner occupied, 2,891 renter occupied)
| % of renters here: | 35% |
| State: | 36% |
Housing density: 1,735 houses/condos per square mile
Median price asked for vacant for-sale houses and condos in 2022 in this county: $628,500.
Median contract rent in 2022: $1,908 (lower quartile is $1,712, upper quartile is over $2,000)
Median rent asked for vacant for-rent units in 2022: $14,205
Median gross rent in Martha Lake, WA in 2022: over $2,000
Housing units in Martha Lake with a mortgage: 4,056 (307 second mortgage, 0 home equity loan, 239 both second mortgage and home equity loan)
Houses without a mortgage: 183
Median household income for houses/condos with a mortgage: $160,642
Median household income for apartments without a mortgage: $108,743
Median monthly housing costs: $2,162
Compare current foreclosures near Martha Lake, WA:
| Photo | Address | Area | Beds / Baths | Price | Details |
|---|---|---|---|---|---|

|
#1
100th St SW Apt B206
Everett, WA 98204
|
856 sq. feet
|
2 baths 2 beds |
show details | |

|
#2
4th Ave W Apt 6a
Everett, WA 98204
|
1,346 sq. feet
|
3 baths 2 beds |
show details | |

|
#3
Rucker Ave Apt 9
Everett, WA 98201
|
879 sq. feet
|
1 baths 2 beds |
show details | |

|
#4
3rd Dr SE
Bothell, WA 98012
|
1,957 sq. feet
|
2 baths 4 beds |
show details | |

|
#5
N Ridge Dr
Snohomish, WA 98290
|
2,033 sq. feet
|
3 baths 3 beds |
show details | |

|
#6
4th Ave W
Everett, WA 98204
|
1,206 sq. feet
|
2 baths 2 beds |
show details | |

|
#7
58th Ln NE
Kenmore, WA 98028
|
2,700 sq. feet
|
2 baths 3 beds |
show details | |

|
#8
64th Pl NE
Marysville, WA 98270
|
1,132 sq. feet
|
1 baths 3 beds |
show details | |

|
#9
93rd St SW
Everett, WA 98204
|
1,022 sq. feet
|
1 baths 3 beds |
show details | |

|
#10
67th Pl W
Mountlake Terrace, WA 98043
|
2,194 sq. feet
|
2 baths 5 beds |
show details |
| Photo | Address | Area | Beds / Baths | Price | Details |
|---|---|---|---|---|---|

|
#11
28th Dr SE
Everett, WA 98208
|
2,370 sq. feet
|
2 baths 4 beds |
show details | |

|
#12
W Casino Rd Apt 63
Everett, WA 98204
|
1,203 sq. feet
|
2 baths 2 beds |
show details | |

|
#13
20th Ave SE
Bothell, WA 98021
|
1,552 sq. feet
|
2 baths 3 beds |
show details | |

|
#14
51st Ave NE
Seattle, WA 98115
|
2,450 sq. feet
|
2 baths 4 beds |
show details | |

|
#15
63rd Pl NE
Marysville, WA 98270
|
2,082 sq. feet
|
2 baths 4 beds |
show details | |

|
#16
2nd Ave NW
Seattle, WA 98177
|
1,660 sq. feet
|
2 baths 3 beds |
show details | |

|
#17
1st Ave NE
Seattle, WA 98115
|
1,110 sq. feet
|
1 baths 4 beds |
show details | |

|
#18
Interurban Blvd
Snohomish, WA 98296
|
1,156 sq. feet
|
1 baths 3 beds |
show details | |

|
#19
91st Ave W
Edmonds, WA 98026
|
1,504 sq. feet
|
1 baths 3 beds |
show details | |

|
#20
Woods Creek Rd
Monroe, WA 98272
|
2,496 sq. feet
|
2 baths 4 beds |
show details |
| Photo | Address | Area | Beds / Baths | Price | Details |
|---|---|---|---|---|---|

|
#21
13th Ave NW
Seattle, WA 98117
|
1,490 sq. feet
|
2 baths 3 beds |
show details | |

|
#22
199th St SW
Bothell, WA 98012
|
2,846 sq. feet
|
2 baths 4 beds |
show details | |

|
#23
148th St SW
Edmonds, WA 98026
|
2,227 sq. feet
|
1 baths 4 beds |
show details | |

|
#24
17th St NE
Lake Stevens, WA 98258
|
1,368 sq. feet
|
2 baths 3 beds |
show details | |

|
#25
N 161st Pl Unit A308 Aka 700 N 160th St Unit A308
Seattle, WA 98133
|
- sq. feet
|
1 baths 1 beds |
show details | |

|
#26
59th Ave SE
Snohomish, WA 98296
|
2,641 sq. feet
|
2 baths 5 beds |
show details | |

|
#27
Storm Lake Rd
Snohomish, WA 98290
|
2,323 sq. feet
|
3 baths 3 beds |
show details | |

|
#28
Harrison Ave
Everett, WA 98201
|
735 sq. feet
|
1 baths 2 beds |
show details | |

|
#29
Herring Street And 4361 Douglas Street
Langley, WA 98260
|
1,191 sq. feet
|
1 baths 2 beds |
show details | |

|
#30
60th Ave NE
Marysville, WA 98270
|
2,474 sq. feet
|
3 baths 4 beds |
show details |
| Photo | Address | Area | Beds / Baths | Price | Details |
|---|---|---|---|---|---|

|
#31
NW 59th St
Seattle, WA 98107
|
1,110 sq. feet
|
1 baths 3 beds |
show details | |

|
#32
NE Woodinville Duvall Rd
Woodinville, WA 98072
|
1,520 sq. feet
|
1 baths 2 beds |
show details | |

|
#33
NE 134th Pl
Kirkland, WA 98034
|
2,893 sq. feet
|
3 baths 4 beds |
show details | |

|
#34
Howard Ave NE
Kingston, WA 98346
|
1,008 sq. feet
|
1 baths 2 beds |
show details | |

|
#35
114th Ave NE
Kirkland, WA 98033
|
1,950 sq. feet
|
2 baths 4 beds |
show details | |

|
#36
Oakes Ave
Everett, WA 98201
|
1,360 sq. feet
|
1 baths 4 beds |
show details | |

|
#37
NE 205th St
Kenmore, WA 98028
|
1,210 sq. feet
|
2 baths 3 beds |
show details | |

|
#38
Autumn Ln
Clinton, WA 98236
|
1,940 sq. feet
|
3 baths 2 beds |
show details | |

|
#39
NE 173rd St
Woodinville, WA 98072
|
2,730 sq. feet
|
2 baths 3 beds |
show details | |

|
#40
119th Pl SE
Everett, WA 98208
|
1,296 sq. feet
|
1 baths 3 beds |
show details |
| Photo | Address | Area | Beds / Baths | Price | Details |
|---|---|---|---|---|---|

|
#41
NE 142nd Pl
Kirkland, WA 98034
|
1,830 sq. feet
|
2 baths 3 beds |
show details | |

|
#42
19th Dr SE
Bothell, WA 98012
|
852 sq. feet
|
1 baths 3 beds |
show details | |

|
#43
210th St SE
Snohomish, WA 98296
|
1,580 sq. feet
|
3 baths 3 beds |
show details | |

|
#44
E Lynn St # 98102
Seattle, WA 98102
|
792 sq. feet
|
1 baths - beds |
show details | |

|
#45
8th Ave W
Seattle, WA 98119
|
1,400 sq. feet
|
1 baths 3 beds |
show details | |

|
#46
Cascadian Way
Bothell, WA 98012
|
1,492 sq. feet
|
2 baths 3 beds |
show details | |

|
#47
NE 190th St
Seattle, WA 98155
|
2,070 sq. feet
|
2 baths 5 beds |
show details | |

|
#48
320th Ave NE
Duvall, WA 98019
|
3,140 sq. feet
|
2 baths 3 beds |
show details | |

|
#49
49th Ave SE
Bothell, WA 98012
|
1,756 sq. feet
|
2 baths 3 beds |
show details | |

|
Check over 1 million property listings on Foreclosure.com!
|
browse all offers | |||


 | Looking for apartments in Mukilteo or nearby (27 replies) |
| How much to charge rent? (30 replies) |
| Potentially Moving to Seattle From Texas - Advice Please! (27 replies) |
| Relocating to Seattle!!!! (26 replies) |
| SoCal Transplant - North/East Seattle Suburban Options (12 replies) |
| Martha Lake Park (2 replies) |

Median year apartment built: 1998
Household type by relationship:
Households: 23,588- Male householders: 4,699 (742 living alone), Female householders: 3,379 (575 living alone)
4,892 spouses (4,860 opposite-sex spouses), 762 unmarried partners, (754 opposite-sex unmarried partners), 7,347 children (7,079 natural, 99 adopted, 168 stepchildren), 281 grandchildren, 229 brothers or sisters, 624 parents, 0 foster children, 563 other relatives, 735 non-relatives
- In group quarters: 72
Size of family households: 2,101 2-persons, 1,257 3-persons, 1,168 4-persons, 548 5-persons, 443 6-persons, 247 7-or-more-persons.
Size of nonfamily households: 1,403 1-person, 918 2-persons, 80 3-persons.
4,469 married couples with children.
888 single-parent households (213 men, 675 women).
65.6% of residents of Martha Lake speak English at home.
5.3% of residents speak Spanish at home (44% speak English very well, 49% speak English well, 7% speak English not well).
9.7% of residents speak other Indo-European language at home (53% speak English very well, 36% speak English well, 10% speak English not well).
16.0% of residents speak Asian or Pacific Island language at home (55% speak English very well, 31% speak English well, 14% speak English not well).
4.1% of residents speak other language at home (61% speak English very well, 8% speak English well, 31% speak English not well).
Foreign born population: 6,552 (27.8%)
(44.9% of them are naturalized citizens)
| Here: | 6.5 |
| State: | 6.5 |
| Here: | 4.4 |
| State: | 3.9 |

- Bedrooms in owner-occupied houses and condos in Martha Lake, Washington
- 0no bedroom
- 541 bedroom
- 5282 bedrooms
- 2,6583 bedrooms
- 1,4514 bedrooms
- 5705+ bedrooms

- Bedrooms in renter-occupied apartments in Martha Lake, Washington
- 207no bedroom
- 2311 bedroom
- 1,1902 bedrooms
- 8443 bedrooms
- 3464 bedrooms
- 735+ bedrooms

- Cars and other vehicles available in Martha Lake in owner-occupied houses/condos
- 141no vehicle
- 1,1561 vehicle
- 2,4452 vehicles
- 8853 vehicles
- 2704 vehicles
- 3645+ vehicles

- Cars and other vehicles available in Martha Lake in renter-occupied apartments
- 80no vehicle
- 1,1011 vehicle
- 1,4152 vehicles
- 1603 vehicles
- 1174 vehicles
- 195+ vehicles

- Rooms in owner-occupied houses in Martha Lake, Washington
- 01 room
- 182 rooms
- 503 rooms
- 6554 rooms
- 7225 rooms
- 1,1656 rooms
- 8597 rooms
- 7408 rooms
- 1,0539+ rooms

- Rooms in renter-occupied apartments in Martha Lake, Washington
- 2071 room
- 1142 rooms
- 1813 rooms
- 9884 rooms
- 4645 rooms
- 2536 rooms
- 3477 rooms
- 1608 rooms
- 1799+ rooms


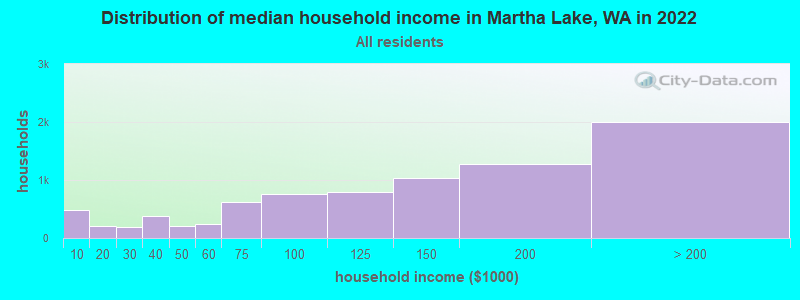
Martha Lake, WA household income distribution

- 491Less than $10,000
- 212$10,000 to $19,999
- 196$20,000 to $29,999
- 372$30,000 to $39,999
- 209$40,000 to $49,999
- 243$50,000 to $59,999
- 628$60,000 to $74,999
- 767$75,000 to $99,999
- 801$100,000 to $124,999
- 1,027$125,000 to $149,999
- 1,271$150,000 to $199,999
- 2,000$200,000 or more
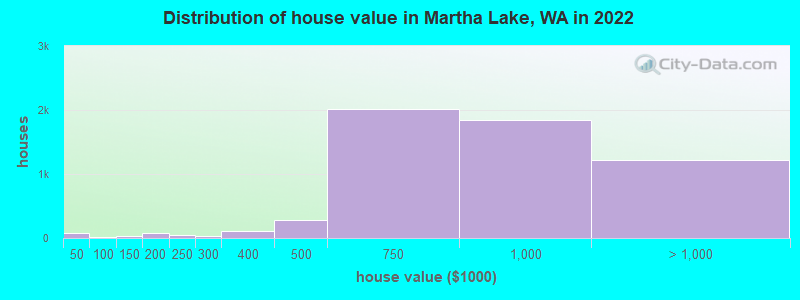
Home value of owner - occupied houses in 2022 in Martha Lake, WA
-
- 47Less than $10,000
- 13$10,000 to $14,999
- 11$35,000 to $39,999
- 22$70,000 to $79,999
- 30$100,000 to $124,999
- 9$125,000 to $149,999
- 83$150,000 to $174,999
- 51$200,000 to $249,999
- 25$250,000 to $299,999
- 103$300,000 to $399,999
- 283$400,000 to $499,999
- 2,017$500,000 to $749,999
- 1,836$750,000 to $999,999
- 1,145$1,000,000 to $1,499,999
- 54$1,500,000 to $1,999,999
- 11$2,000,000 or more
Rent paid by renters in 2022 in Martha Lake, WA
-
- 17$200 to $249
- 34$300 to $349
- 37$650 to $699
- 11$900 to $999
- 63$1,000 to $1,249
- 112$1,250 to $1,499
- 1,776$1,500 to $1,999
- 734$2,000 to $2,499
- 191$2,500 to $2,999
- 58$3,000 to $3,499
- 51No cash rent


Percentage of workers working in this county: 63.0%
Number of people working at home: 3,769 (29.1% of all workers)
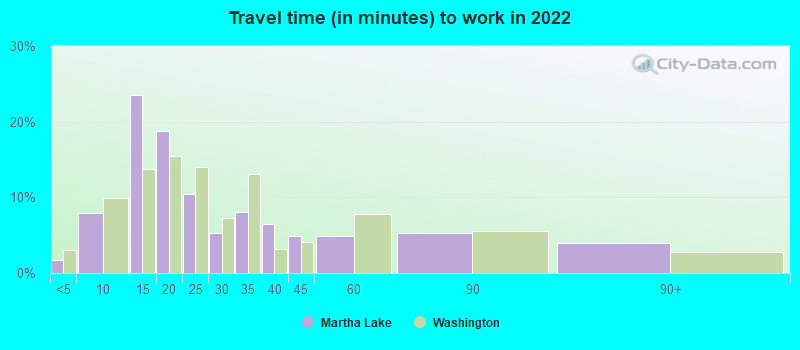
Travel time to work (commute)
- Less than 5 minutes: 52
- 5 to 9 minutes: 498
- 10 to 14 minutes: 961
- 15 to 19 minutes: 1,159
- 20 to 24 minutes: 1,383
- 25 to 29 minutes: 656
- 30 to 34 minutes: 1,621
- 35 to 39 minutes: 430
- 40 to 44 minutes: 623
- 45 to 59 minutes: 967
- 60 to 89 minutes: 906
- 90 or more minutes: 168
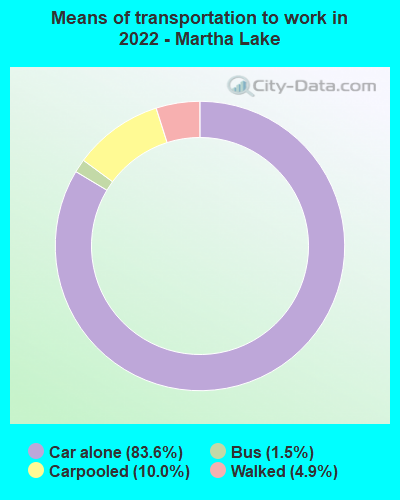
Means of transportation to work:
- Drove a car alone: 1,265 (28.2%)
- Carpooled: 162 (3.6%)
- Bus: 30 (0.7%)
- Walked: 88 (2.0%)
- Worked at home: 3,769 (84.1%)

- Unemployment by race in 2022
- Unemployment rate for White non-Hispanic residents
- 4.1%Males
- 0.7%Females
- Unemployment rate for Black residents
- 18.6%Males
- 65.2%Females
- Unemployment rate for Asian residents
- 1.8%Males
- 3.6%Females
- Unemployment rate for two or more race residents
- 22.8%Females
- Unemployment rate for Hispanic or Latino residents
- 2.3%Males
- 6.2%Females

- Year of entry for the foreign-born population in Martha Lake, Washington
- 3,2662010 or later
- 1,6372000 to 2009
- 1,0391990 to 1999
- 5871980 to 1989
- 1731970 to 1979
- 121Before 1970

First ancestries reported:
- German: 532 (4.4%)
- English: 479 (4.0%)
- American: 421 (3.5%)
- Ukrainian: 378 (3.1%)
- European: 357 (3.0%)
- Irish: 319 (2.6%)
- Russian: 302 (2.5%)
- Norwegian: 233 (1.9%)
- Swedish: 188 (1.6%)
- Italian: 161 (1.3%)
- Egyptian: 142 (1.2%)
- Ugandan: 137 (1.1%)
- Armenian: 134 (1.1%)
- Iranian: 131 (1.1%)
- African: 107 (0.9%)
- Bulgarian: 105 (0.9%)
- Polish: 87 (0.7%)
- Scandinavian: 66 (0.5%)
- Finnish: 64 (0.5%)
- Moroccan: 62 (0.5%)
- Czech: 51 (0.4%)
- Romanian: 39 (0.3%)
- Czechoslovakian: 39 (0.3%)
- French: 27 (0.2%)
- British: 25 (0.2%)
- Liberian: 25 (0.2%)
- Danish: 24 (0.2%)
- Basque: 23 (0.2%)
- Ethiopian: 21 (0.2%)
- Syrian: 20 (0.2%)
- Yugoslavian: 20 (0.2%)
- Latvian: 19 (0.2%)
- Slovak: 15 (0.1%)
- West Indian: 14 (0.1%)
- Northern European: 11 (0.09%)
- Canadian: 9 (0.07%)
- French Canadian: 7 (0.06%)
Most common places of birth for foreign-born residents (%):
| Martha Lake: | 15.0% (975) |
| Washington: | 8.9% (101,353) |
| Martha Lake: | 13.6% (885) |
| Washington: | 7.4% (84,470) |
| Martha Lake: | 7.5% (485) |
| Washington: | 5.4% (62,003) |
| Martha Lake: | 7.2% (468) |
| Washington: | 6.3% (71,661) |
| Martha Lake: | 6.9% (448) |
| Washington: | 21.1% (241,655) |
| Martha Lake: | 6.3% (409) |
| Washington: | 3.1% (35,872) |
| Martha Lake: | 5.6% (367) |
| Washington: | 1.0% (10,993) |
| Martha Lake: | 3.2% (211) |
| Washington: | 4.3% (48,886) |
| Martha Lake: | 2.6% (168) |
| Washington: | 0.3% (3,083) |
| Martha Lake: | 2.0% (130) |
| Washington: | 0.2% (1,754) |
| Martha Lake: | 1.6% (107) |
| Washington: | 0.2% (2,858) |
| Martha Lake: | 1.6% (105) |
| Washington: | 0.2% (1,755) |
| Martha Lake: | 1.6% (103) |
| Washington: | 0.7% (7,568) |
| Martha Lake: | 1.5% (99) |
| Washington: | 0.1% (1,624) |
Place of birth for U.S.-born residents:
- This state: 9,772
- Other state: 6,753
- Northeast: 908
- Midwest: 1,167
- South: 1,288
- West: 3,371
86.5% of Martha Lake residents lived in the same house 1 years ago.
Out of people who lived in different houses, 29.0% lived in this county.
Out of people who lived in different counties, 82.2% lived in Washington.
| Martha Lake: | 86.5% |
| State average: | 85.2% |
Education attainment for males 25 years and older:
- No schooling: 63
- Nursery to 4th grade: 0
- 5th and 6th grade: 94
- 7th and 8th grade: 43
- 9th grade: 262
- 10th grade: 105
- 11th grade: 68
- 12th grade, no diploma: 226
- High school graduate (or equivalency): 1,317
- Less than 1 year of college: 370
- Some college more than 1 year, no degree: 1,091
- Associate degree: 811
- Bachelor's degree: 2,837
- Master's degree: 754
- Professional school degree: 110
- Doctorate degree: 47

Education attainment for females 25 years and older:
- No schooling: 122
- Nursery to 4th grade: 1
- 5th and 6th grade: 187
- 7th and 8th grade: 48
- 9th grade: 24
- 10th grade: 52
- 11th grade: 0
- 12th grade, no diploma: 48
- High school graduate (or equivalency): 1,065
- Less than 1 year of college: 402
- Some college more than 1 year, no degree: 1,127
- Associate degree: 816
- Bachelor's degree: 2,662
- Master's degree: 951
- Professional school degree: 202
- Doctorate degree: 88


Housing units in structures:
- One, detached: 5,109
- One, attached: 509
- Two: 119
- 3 or 4: 352
- 5 to 9: 470
- 10 to 19: 528
- 20 to 49: 472
- 50 or more: 640
- Mobile homes: 44
- Boats, RVs, vans, etc.: 8
Housing units lacking complete kitchen facilities in 2022: 0.4%
House/condo owner moved in on average 7 years ago
Renter moved in on average 2 years ago

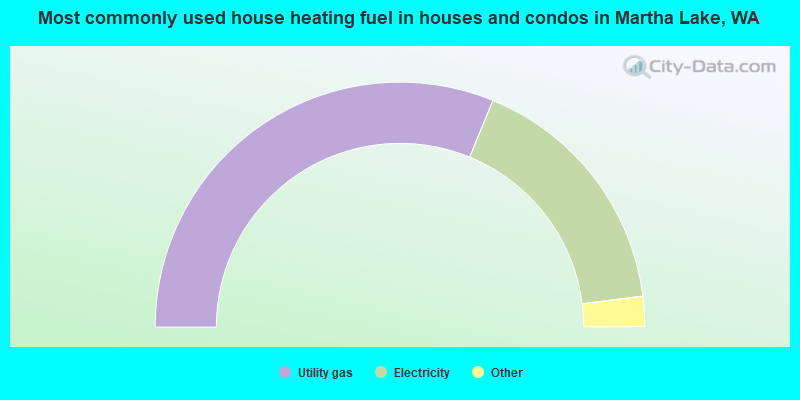
- 62.4%Utility gas
- 33.6%Electricity
- 2.1%Bottled, tank, or LP gas
- 1.7%No fuel used
- 0.1%Wood
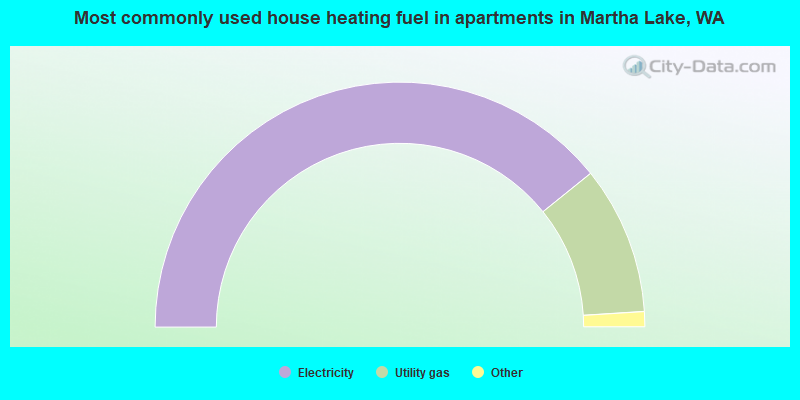
- 78.5%Electricity
- 19.6%Utility gas
- 1.5%Bottled, tank, or LP gas
- 0.3%Solar energy
- 0.2%No fuel used
Private vs. public school enrollment:
| Here: | 14.4% |
| Washington: | 12.4% |
| Here: | 9.2% |
| Washington: | 9.2% |
| Here: | 10.7% |
| Washington: | 16.5% |


