Races in Martha Lake, Washington (WA) Detailed Stats
Data:
Races - White alone (%)
Races - White alone (% change since 2000)
Races - Black alone (%)
Races - Black alone (% change since 2000)
Races - American Indian alone (%)
Races - American Indian alone (% change since 2000)
Races - Asian alone (%)
Races - Asian alone (% change since 2000)
Races - Hispanic (%)
Races - Hispanic (% change since 2000)
Races - Native Hawaiian and Other Pacific Islander alone (%)
Races - Native Hawaiian and Other Pacific Islander alone (% change since 2000)
Races - Two or more races(%)
Races - Two or more races(% change since 2000)
Races - Other race alone (%)
Races - Other race alone (% change since 2000)
Racial diversity
Place of birth - Born in state of residence (%)
Place of birth - Born in state of residence (%) - White
Place of birth - Born in state of residence (%) - Black or African American
Place of birth - Born in state of residence (%) - Asian
Place of birth - Born in state of residence (%) - Hispanic or Latino
Place of birth - Born in state of residence (%) - American Indian and Alaska Native
Place of birth - Born in state of residence (%) - Multirace
Place of birth - Born in state of residence (%) - Other Race
Place of birth - Born in other state (%)
Place of birth - Born in other state (%) - White
Place of birth - Born in other state (%) - Black or African American
Place of birth - Born in other state (%) - Asian
Place of birth - Born in other state (%) - Hispanic or Latino
Place of birth - Born in other state (%) - American Indian and Alaska Native
Place of birth - Born in other state (%) - Multirace
Place of birth - Born in other state (%) - Other Race
Place of birth - Native, outside of US (%)
Place of birth - Native, outside of US (%) - White
Place of birth - Native, outside of US (%) - Black or African American
Place of birth - Native, outside of US (%) - Asian
Place of birth - Native, outside of US (%) - Hispanic or Latino
Place of birth - Native, outside of US (%) - American Indian and Alaska Native
Place of birth - Native, outside of US (%) - Multirace
Place of birth - Native, outside of US (%) - Other Race
Place of birth - Foreign born (%)
Place of birth - Foreign born (%) - White
Place of birth - Foreign born (%) - Black or African American
Place of birth - Foreign born (%) - Asian
Place of birth - Foreign born (%) - Hispanic or Latino
Place of birth - Foreign born (%) - American Indian and Alaska Native
Place of birth - Foreign born (%) - Multirace
Place of birth - Foreign born (%) - Other Race
Residents speaking English at home (%)
Residents speaking English at home - Born in the United States (%)
Residents speaking English at home - Native, born elsewhere (%)
Residents speaking English at home - Foreign born (%)
Residents speaking Spanish at home (%)
Residents speaking Spanish at home - Born in the United States (%)
Residents speaking Spanish at home - Native, born elsewhere (%)
Residents speaking Spanish at home - Foreign born (%)
Residents speaking other language at home (%)
Residents speaking other language at home - Born in the United States (%)
Residents speaking other language at home - Native, born elsewhere (%)
Residents speaking other language at home - Foreign born (%)
Marital status - Never married (%)
Marital status - Now married (%)
Marital status - Separated (%)
Marital status - Widowed (%)
Marital status - Divorced (%)
Ancestries Reported - Arab (%)
Ancestries Reported - Czech (%)
Ancestries Reported - Danish (%)
Ancestries Reported - Dutch (%)
Ancestries Reported - English (%)
Ancestries Reported - French (%)
Ancestries Reported - French Canadian (%)
Ancestries Reported - German (%)
Ancestries Reported - Greek (%)
Ancestries Reported - Hungarian (%)
Ancestries Reported - Irish (%)
Ancestries Reported - Italian (%)
Ancestries Reported - Lithuanian (%)
Ancestries Reported - Norwegian (%)
Ancestries Reported - Polish (%)
Ancestries Reported - Portuguese (%)
Ancestries Reported - Russian (%)
Ancestries Reported - Scotch-Irish (%)
Ancestries Reported - Scottish (%)
Ancestries Reported - Slovak (%)
Ancestries Reported - Subsaharan African (%)
Ancestries Reported - Swedish (%)
Ancestries Reported - Swiss (%)
Ancestries Reported - Ukrainian (%)
Ancestries Reported - United States (%)
Ancestries Reported - Welsh (%)
Ancestries Reported - West Indian (%)
Ancestries Reported - Other (%)
Geographical mobility - Same house 1 year ago (%)
Geographical mobility - Same house 1 year ago (%) - White
Geographical mobility - Same house 1 year ago (%) - Black or African American
Geographical mobility - Same house 1 year ago (%) - Asian
Geographical mobility - Same house 1 year ago (%) - Hispanic or Latino
Geographical mobility - Same house 1 year ago (%) - American Indian and Alaska Native
Geographical mobility - Same house 1 year ago (%) - Multirace
Geographical mobility - Same house 1 year ago (%) - Other Race
Geographical mobility - Moved within same county (%)
Geographical mobility - Moved within same county (%) - White
Geographical mobility - Moved within same county (%) - Black or African American
Geographical mobility - Moved within same county (%) - Asian
Geographical mobility - Moved within same county (%) - Hispanic or Latino
Geographical mobility - Moved within same county (%) - American Indian and Alaska Native
Geographical mobility - Moved within same county (%) - Multirace
Geographical mobility - Moved within same county (%) - Other Race
Geographical mobility - Moved from different county within same state (%)
Geographical mobility - Moved from different county within same state (%) - White
Geographical mobility - Moved from different county within same state (%) - Black or African American
Geographical mobility - Moved from different county within same state (%) - Asian
Geographical mobility - Moved from different county within same state (%) - Hispanic or Latino
Geographical mobility - Moved from different county within same state (%) - American Indian and Alaska Native
Geographical mobility - Moved from different county within same state (%) - Multirace
Geographical mobility - Moved from different county within same state (%) - Other Race
Geographical mobility - Moved from different state (%)
Geographical mobility - Moved from different state (%) - White
Geographical mobility - Moved from different state (%) - Black or African American
Geographical mobility - Moved from different state (%) - Asian
Geographical mobility - Moved from different state (%) - Hispanic or Latino
Geographical mobility - Moved from different state (%) - American Indian and Alaska Native
Geographical mobility - Moved from different state (%) - Multirace
Geographical mobility - Moved from different state (%) - Other Race
Geographical mobility - Moved from abroad (%)
Geographical mobility - Moved from abroad (%) - White
Geographical mobility - Moved from abroad (%) - Black or African American
Geographical mobility - Moved from abroad (%) - Asian
Geographical mobility - Moved from abroad (%) - Hispanic or Latino
Geographical mobility - Moved from abroad (%) - American Indian and Alaska Native
Geographical mobility - Moved from abroad (%) - Multirace
Geographical mobility - Moved from abroad (%) - Other Race
Place of birth for the foreign-born population - Ireland (%)
Place of birth for the foreign-born population - Denmark (%)
Place of birth for the foreign-born population - Norway (%)
Place of birth for the foreign-born population - Sweden (%)
Place of birth for the foreign-born population - United Kingdom (%)
Place of birth for the foreign-born population - England (%)
Place of birth for the foreign-born population - Scotland (%)
Place of birth for the foreign-born population - Other Northern Europe (%)
Place of birth for the foreign-born population - Austria (%)
Place of birth for the foreign-born population - Belgium (%)
Place of birth for the foreign-born population - France (%)
Place of birth for the foreign-born population - Germany (%)
Place of birth for the foreign-born population - Netherlands (%)
Place of birth for the foreign-born population - Switzerland (%)
Place of birth for the foreign-born population - Other Western Europe (%)
Place of birth for the foreign-born population - Greece (%)
Place of birth for the foreign-born population - Italy (%)
Place of birth for the foreign-born population - Portugal (%)
Place of birth for the foreign-born population - Spain (%)
Place of birth for the foreign-born population - Other Southern Europe (%)
Place of birth for the foreign-born population - Albania (%)
Place of birth for the foreign-born population - Belarus (%)
Place of birth for the foreign-born population - Bosnia and Herzegovina (%)
Place of birth for the foreign-born population - Bulgaria (%)
Place of birth for the foreign-born population - Croatia (%)
Place of birth for the foreign-born population - Czechoslovakia (%)
Place of birth for the foreign-born population - Hungary (%)
Place of birth for the foreign-born population - Latvia (%)
Place of birth for the foreign-born population - Lithuania (%)
Place of birth for the foreign-born population - North Macedonia (Macedonia) (%)
Place of birth for the foreign-born population - Moldova (%)
Place of birth for the foreign-born population - Poland (%)
Place of birth for the foreign-born population - Romania (%)
Place of birth for the foreign-born population - Russia (%)
Place of birth for the foreign-born population - Serbia (%)
Place of birth for the foreign-born population - Ukraine (%)
Place of birth for the foreign-born population - Other Eastern Europe (%)
Place of birth for the foreign-born population - China (%)
Place of birth for the foreign-born population - Hong Kong (%)
Place of birth for the foreign-born population - Taiwan (%)
Place of birth for the foreign-born population - Japan (%)
Place of birth for the foreign-born population - Korea (%)
Place of birth for the foreign-born population - Other Eastern Asia (%)
Place of birth for the foreign-born population - Afghanistan (%)
Place of birth for the foreign-born population - Bangladesh (%)
Place of birth for the foreign-born population - India (%)
Place of birth for the foreign-born population - Iran (%)
Place of birth for the foreign-born population - Kazakhstan (%)
Place of birth for the foreign-born population - Nepal (%)
Place of birth for the foreign-born population - Pakistan (%)
Place of birth for the foreign-born population - Sri Lanka (%)
Place of birth for the foreign-born population - Uzbekistan (%)
Place of birth for the foreign-born population - Other South Central Asia (%)
Place of birth for the foreign-born population - Burma (%)
Place of birth for the foreign-born population - Cambodia (%)
Place of birth for the foreign-born population - Indonesia (%)
Place of birth for the foreign-born population - Laos (%)
Place of birth for the foreign-born population - Malaysia (%)
Place of birth for the foreign-born population - Philippines (%)
Place of birth for the foreign-born population - Singapore (%)
Place of birth for the foreign-born population - Thailand (%)
Place of birth for the foreign-born population - Vietnam (%)
Place of birth for the foreign-born population - Other South Eastern Asia (%)
Place of birth for the foreign-born population - Armenia (%)
Place of birth for the foreign-born population - Iraq (%)
Place of birth for the foreign-born population - Israel (%)
Place of birth for the foreign-born population - Jordan (%)
Place of birth for the foreign-born population - Kuwait (%)
Place of birth for the foreign-born population - Lebanon (%)
Place of birth for the foreign-born population - Saudi Arabia (%)
Place of birth for the foreign-born population - Syria (%)
Place of birth for the foreign-born population - Turkey (%)
Place of birth for the foreign-born population - Yemen (%)
Place of birth for the foreign-born population - Other Western Asia (%)
Place of birth for the foreign-born population - Eritrea (%)
Place of birth for the foreign-born population - Ethiopia (%)
Place of birth for the foreign-born population - Kenya (%)
Place of birth for the foreign-born population - Somalia (%)
Place of birth for the foreign-born population - Uganda (%)
Place of birth for the foreign-born population - Zimbabwe (%)
Place of birth for the foreign-born population - Other Eastern Africa (%)
Place of birth for the foreign-born population - Cameroon (%)
Place of birth for the foreign-born population - Congo (%)
Place of birth for the foreign-born population - Democratic Republic of Congo (Zaire) (%)
Place of birth for the foreign-born population - Other Middle Africa (%)
Place of birth for the foreign-born population - Egypt (%)
Place of birth for the foreign-born population - Morocco (%)
Place of birth for the foreign-born population - Sudan (%)
Place of birth for the foreign-born population - Other Northern Africa (%)
Place of birth for the foreign-born population - South Africa (%)
Place of birth for the foreign-born population - Other Southern Africa (%)
Place of birth for the foreign-born population - Cabo Verde (%)
Place of birth for the foreign-born population - Ghana (%)
Place of birth for the foreign-born population - Liberia (%)
Place of birth for the foreign-born population - Nigeria (%)
Place of birth for the foreign-born population - Senegal (%)
Place of birth for the foreign-born population - Sierra Leone (%)
Place of birth for the foreign-born population - Other Western Africa (%)
Place of birth for the foreign-born population - Australia (%)
Place of birth for the foreign-born population - New Zealand (%)
Place of birth for the foreign-born population - Fiji (%)
Place of birth for the foreign-born population - Micronesia (%)
Place of birth for the foreign-born population - Bahamas (%)
Place of birth for the foreign-born population - Barbados (%)
Place of birth for the foreign-born population - Cuba (%)
Place of birth for the foreign-born population - Dominica (%)
Place of birth for the foreign-born population - Dominican Republic (%)
Place of birth for the foreign-born population - Grenada (%)
Place of birth for the foreign-born population - Haiti (%)
Place of birth for the foreign-born population - Jamaica (%)
Place of birth for the foreign-born population - St. Vincent and the Grenadines (%)
Place of birth for the foreign-born population - Trinidad and Tobago (%)
Place of birth for the foreign-born population - West Indies (%)
Place of birth for the foreign-born population - Other Caribbean (%)
Place of birth for the foreign-born population - Belize (%)
Place of birth for the foreign-born population - Costa Rica (%)
Place of birth for the foreign-born population - El Salvador (%)
Place of birth for the foreign-born population - Guatemala (%)
Place of birth for the foreign-born population - Honduras (%)
Place of birth for the foreign-born population - Mexico (%)
Place of birth for the foreign-born population - Nicaragua (%)
Place of birth for the foreign-born population - Panama (%)
Place of birth for the foreign-born population - Other Central America (%)
Place of birth for the foreign-born population - Argentina (%)
Place of birth for the foreign-born population - Bolivia (%)
Place of birth for the foreign-born population - Brazil (%)
Place of birth for the foreign-born population - Chile (%)
Place of birth for the foreign-born population - Colombia (%)
Place of birth for the foreign-born population - Ecuador (%)
Place of birth for the foreign-born population - Guyana (%)
Place of birth for the foreign-born population - Peru (%)
Place of birth for the foreign-born population - Uruguay (%)
Place of birth for the foreign-born population - Venezuela (%)
Place of birth for the foreign-born population - Other South America (%)
Place of birth for the foreign-born population - Canada (%)
Place of birth for the foreign-born population - Other Northern America (%)
Place of birth for the foreign-born population - Other (%)
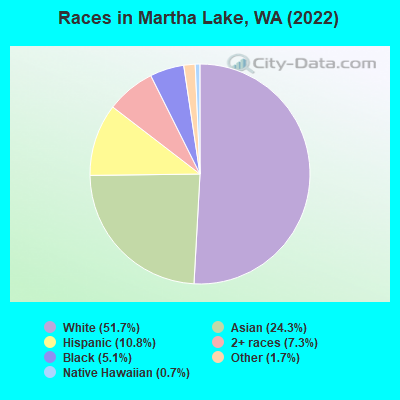
According to 2022 data, the most numerous races in Martha Lake, WA are White alone (12,194 residents), Hispanic (2,538 residents), and Asian alone (5,722 residents). 65.8% of Martha Lake residents speak English at home. 27.6% of Martha Lake, WA residents are foreign-born (17.0% born in Asia, 5.0% born in Europe), which is 45.6% greater than the foreign-born rate of 15.0% across the entire state of Washington.
Race distribution in Martha Lake
2000 2022
4,652,490 78.9% White alone 441,509 7.5% Hispanic 319,401 5.4% Asian alone 184,631 3.1% Black alone 175,926 3.0% Two or more races 85,396 1.4% American Indian alone 22,779 0.4% Native Hawaiian and Other 11,989 0.2% Other race alone
4,941,456 63.5% White alone 1,093,313 14.0% Hispanic 755,832 9.7% Asian alone 523,448 6.7% Two or more races 299,537 3.8% Black alone 69,024 0.9% American Indian alone 52,231 0.7% Native Hawaiian and Other 50,945 0.7% Other race alone
Income and house value in Martha Lake Median household income in 2022 $126,950 White non-Hispanic householders$159,616 Asian householders$73,062 Some other race householders$123,982 Two or more races householders$90,671 Hispanic or Latino race householdersMedian 2022 house value $827,908 White Non-Hispanic householders$621,984 Black or African American householders$534,332 American Indian or Alaska Native householders $860,060 Asian householders$265,635 Some other race householders$895,657 Two or more races householders$945,032 Hispanic or Latino householders
Median age by race in Martha Lake
39.7 Median age for White residents41.5 38.4 21.5 Median age for Black or African American residents18.2 24.5 -644,308,942.4 Median age for American Indian / Alaska Native residents-736,637,511.4 -589,658,965.3 35.4 Median age for Asian residents36.4 34.4 35.3 Median age for Native Hawaiian / Pacific Islander residents52.7 43.9 30.4 Median age for Other race residents35.4 17.1 23.0 Median age for Two or more races residents22.9 25.3 40.3 Median age for White alone residents41.4 39.0 21.4 Median age for Hispanic or Latino residents28.3 20.3
Owner/renter occupied households by race in Martha Lake
House owners and renters - White residents 3,453 67.3% Owner occupied1,674 32.7% Renter occupiedHouse owners and renters - Black or African American residents 98 28.2% Owner occupied249 71.8% Renter occupiedHouse owners and renters - Asian residents 1,481 75.5% Owner occupied482 24.5% Renter occupiedHouse owners and renters - Native Hawaiian / Pacific Islander residents 123 100.0% Renter occupiedHouse owners and renters - Other race residents 31 10.0% Owner occupied278 90.0% Renter occupiedHouse owners and renters - Two or more races residents 207 57.9% Owner occupied151 42.1% Renter occupiedHouse owners and renters - White alone residents 3,434 67.6% Owner occupied1,644 32.4% Renter occupiedHouse owners and renters - Hispanic or Latino residents 156 33.1% Owner occupied315 66.9% Renter occupied
Language usage in Martha Lake
English speakers - Total 65.8% of residents of Martha Lake speak English at home.
5.0% of residents speak Spanish at home 515 46.7% Speak English very well587 53.3% Speak English less than very well29.6% of residents speak other language at home 3,629 55.2% Speak English very well2,944 44.8% Speak English less than very well
English speakers - Born in the United States 93.0% of residents of Martha Lake speak English at home.
3.4% of residents speak Spanish at home 149 67.1% Speak English very well73 32.9% Speak English less than very well3.7% of residents speak other language at home 231 95.1% Speak English very well12 4.9% Speak English less than very well
English speakers - Native, born elsewhere 65.6% of residents of Martha Lake speak English at home.
21.1% of residents speak Spanish at home 64 53.3% Speak English very well56 46.7% Speak English less than very well17.0% of residents speak other language at home 97 100.0% Speak English very well
English speakers - Foreign-born 14.4% of residents of Martha Lake speak English at home.
4.6% of residents speak Spanish at home 174 58.2% Speak English very well125 41.8% Speak English less than very well80.9% of residents speak other language at home 2,581 49.0% Speak English very well2,684 51.0% Speak English less than very well
White (Caucasian) - Speak only English Native:
95.7% (10,106)Foreign-born:
11.7% (166)
White (Caucasian) - Speak another language Native:
4.2% (441)Foreign-born:
87.2% (1,242)
Black or African American - Speak another language Native:
22.5% (178)Foreign-born:
82.3% (213)
Asian - Speak only English Native:
56.8% (820)Foreign-born:
13.4% (527)
Asian - Speak another language Native:
43.2% (624)Foreign-born:
86.6% (3,397)
Other race - Speak only English Native:
8.6% (74)Foreign-born:
52.1% (362)
Other race - Speak another language Native:
95.8% (830)Foreign-born:
62.9% (438)
Two or more races - Speak only English Native:
94.7% (2,043)Foreign-born:
17.7% (13)
Two or more races - Speak another language Native:
5.8% (126)Foreign-born:
82.0% (58)
White alone - Speak only English Native:
96.3% (9,747)Foreign-born:
11.4% (167)
White alone - Speak another language Native:
3.7% (376)Foreign-born:
91.1% (1,335)
Hispanic or Latino - Speak only English Native:
59.4% (1,175)Foreign-born:
42.2% (208)
Hispanic or Latino - Speak another language Native:
40.1% (793)Foreign-born:
60.5% (298)
Foreign-born residents in Martha Lake 6,506 residents are foreign born (17.0% Asia , 5.0% Europe ).
This city:
27.6%Washington:
14.9%
Marital status for residents in Martha Lake Marital status - White (Caucasian) population 15 years and over
Males 31.2% Never married58.3% Now married0.1% Separated1.4% Widowed9.0% DivorcedFemales 28.8% Never married56.4% Now married0.3% Separated4.5% Widowed10.0% DivorcedWomen who gave birth in the past 12 months Now married:
81.3% (102)Unmarried:
18.7% (23)
Women who did not give birth in the past 12 months Now married:
48.8% (1,511)Unmarried:
51.2% (1,587)
Marital status - Black or African American population 15 years and over
Males 49.1% Never married44.6% Now married6.3% Separated0.0% Widowed0.0% DivorcedFemales 39.7% Never married50.2% Now married0.0% Separated0.0% Widowed10.1% DivorcedWomen who gave birth in the past 12 months Now married:
100.0% (24)Unmarried:
0.0% (0)
Women who did not give birth in the past 12 months Now married:
47.1% (112)Unmarried:
52.9% (126)
Marital status - Asian population 15 years and over
Males 17.2% Never married74.4% Now married0.0% Separated0.2% Widowed8.3% DivorcedFemales 24.0% Never married68.3% Now married0.5% Separated3.0% Widowed4.3% DivorcedWomen who gave birth in the past 12 months Now married:
100.0% (32)Unmarried:
0.0% (0)
Women who did not give birth in the past 12 months Now married:
67.5% (1,304)Unmarried:
32.5% (629)
Marital status - Native Hawaiian / Pacific Islander population 15 years and over
Males 47.5% Never married52.5% Now married0.0% Separated0.0% Widowed0.0% DivorcedFemales 0.0% Never married96.4% Now married0.0% Separated3.6% Widowed0.0% DivorcedWomen who did not give birth in the past 12 months Now married:
100.0% (67)Unmarried:
0.0% (0)
Marital status - Other race population 15 years and over
Males 31.0% Never married22.6% Now married0.0% Separated42.6% Widowed3.8% DivorcedFemales 70.7% Never married26.1% Now married0.0% Separated2.6% Widowed0.6% DivorcedWomen who gave birth in the past 12 months Now married:
100.0% (21)Unmarried:
0.0% (0)
Women who did not give birth in the past 12 months Now married:
19.6% (85)Unmarried:
80.4% (347)
Marital status - Two or more races population 15 years and over
Males 69.6% Never married30.2% Now married0.0% Separated0.2% Widowed0.0% DivorcedFemales 50.1% Never married33.8% Now married0.0% Separated5.3% Widowed10.8% DivorcedWomen who gave birth in the past 12 months Now married:
100.0% (19)Unmarried:
0.0% (0)
Women who did not give birth in the past 12 months Now married:
32.7% (211)Unmarried:
67.3% (436)
Marital status - White alone, not Hispanic / Latino population 15 years and over
Males 31.1% Never married58.7% Now married0.1% Separated1.4% Widowed8.6% DivorcedFemales 26.7% Never married58.5% Now married0.3% Separated4.3% Widowed10.2% DivorcedWomen who gave birth in the past 12 months Now married:
100.0% (105)Unmarried:
0.0% (0)
Women who did not give birth in the past 12 months Now married:
51.3% (1,534)Unmarried:
48.7% (1,459)
Marital status - Hispanic or Latino population 15 years and over
Males 52.5% Never married36.6% Now married0.0% Separated0.1% Widowed10.8% DivorcedFemales 57.2% Never married33.0% Now married0.0% Separated2.5% Widowed7.3% DivorcedWomen who gave birth in the past 12 months Now married:
40.5% (18)Unmarried:
59.5% (27)
Women who did not give birth in the past 12 months Now married:
32.1% (268)Unmarried:
67.9% (568)
Ancestries in Martha Lake
532 4.4% German479 4.0% English421 3.5% American378 3.1% Ukrainian357 3.0% European319 2.6% Irish302 2.5% Russian233 1.9% Norwegian188 1.6% Swedish161 1.3% Italian142 1.2% Egyptian137 1.1% Ugandan134 1.1% Armenian131 1.1% Iranian107 0.9% African105 0.9% Bulgarian87 0.7% Polish66 0.5% Scandinavian64 0.5% Finnish62 0.5% Moroccan51 0.4% Czech39 0.3% Romanian39 0.3% Czechoslovakian27 0.2% French25 0.2% British25 0.2% Liberian24 0.2% Danish23 0.2% Basque21 0.2% Ethiopian20 0.2% Syrian20 0.2% Yugoslavian19 0.2% Latvian15 0.1% Slovak14 0.1% West Indian11 0.09% Northern European9 0.07% Canadian7 0.06% French Canadian
Geographical mobility in Martha Lake Same house 1 year ago 10,955 86.9% White (Caucasian)1,082 92.3% Black or African American4,664 81.6% Asian191 100.0% Native Hawaiian / Pacific Islander1,167 72.0% Other race2,319 96.8% Two or more races10,547 87.1% White alone, not Hispanic / Latino2,256 89.7% Hispanic or LatinoMoved within same county 687 5.4% White / Caucasian408 7.1% Asian3 1.4% Native Hawaiian / Pacific Islander12 0.8% Other race10 0.4% Two or more races662 5.5% White alone, not Hispanic / Latino53 2.1% Hispanic or LatinoMoved within same state 519 4.1% White / Caucasian426 7.4% Asian337 20.8% Other race72 3.0% Two or more races510 4.2% White alone, not Hispanic / Latino146 5.8% Hispanic or LatinoMoved from different state 217 1.7% White / Caucasian40 3.4% Black or African American29 0.5% Asian183 1.5% White alone, not Hispanic / Latino18 0.7% Hispanic or LatinoMoved from abroad 306 2.4% White69 5.9% Black or African American74 1.3% Asian77 4.8% Other race49 2.0% Two or more races293 2.4% White alone, not Hispanic / Latino153 6.1% Hispanic or Latino
Children Nativity (place of birth) in Martha Lake
Children under 6 years - Living with two parents Both parents native 906 100.0% NativeBoth parents foreign-born 524 94.9% Native28 5.1% Foreign-bornOne native, one foreign-born parent 84 100.0% NativeChildren under 6 years - Living with one parent Native parent 48 100.0% NativeForeign-born parent 65 70.3% Native28 29.7% Foreign-bornChildren 6 to 17 years - Living with two parents Both parents native 2,011 100.0% NativeBoth parents foreign-born 458 69.5% Native201 30.5% Foreign-bornOne native, one foreign-born parent 336 100.0% NativeChildren 6 to 17 years - Living with one parent Native parent 496 100.0% NativeForeign-born parent 447 50.3% Native442 49.7% Foreign-born
Grandparents responsible for own grandchildren in Martha Lake
Grandparents (30 to 59 years) White / Caucasian 13 21.7% Responsible for grandchildren49 78.3% Not responsible for grandchildrenAsian 61 100.0% Not responsible for grandchildrenTwo or more races 28 100.0% Not responsible for grandchildrenWhite alone, not Hispanic / Latino 14 21.8% Responsible for grandchildren51 78.2% Not responsible for grandchildrenGrandparents (60 years and over) White / Caucasian 29 14.0% Responsible for grandchildren177 86.0% Not responsible for grandchildrenAsian 51 32.5% Responsible for grandchildren105 67.5% Not responsible for grandchildrenWhite alone, not Hispanic / Latino 29 15.1% Responsible for grandchildren163 84.9% Not responsible for grandchildren