Marietta, GA (Georgia) Houses and Residents
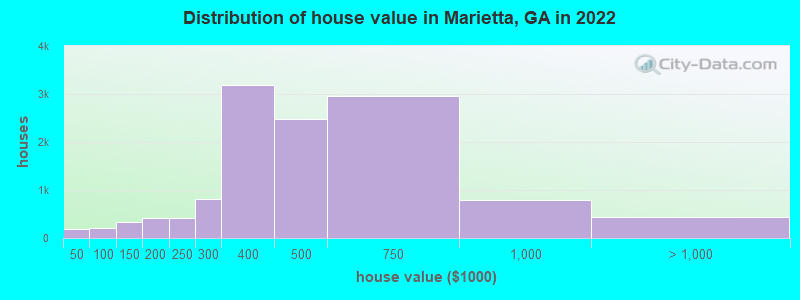
Estimated median house or condo value in 2022: $432,969 (it was $144,400 in 2000 )
Marietta:
$432,969Georgia:
$297,400
Lower value quartile - upper value quartile: $333,316 - $614,518Mean price in 2022: Detached houses: $505,676 Here:
$505,676State:
$376,364
Townhouses or other attached units: $239,950 Here:
$239,950State:
$341,709
In 3-to-4-unit structures: $96,318 Here:
$96,318State:
$250,092
In 5-or-more-unit structures: $172,456 Here:
$172,456State:
$370,730
Mobile homes: $21,806 Here:
$21,806State:
$102,413
Total population: 60,014 (Urban population: 58,374, Rural population: 0)
Houses: 27,062 (24,828 occupied: 11,557 owner occupied, 13,437 renter occupied )
% of renters here:
54%State:
34%
Housing density: 1,236 houses/condos per square mile
Median price asked for vacant for-sale houses and condos in 2022: $434,123.
Median contract rent in 2022: $1,294 (lower quartile is $1,066, upper quartile is $1,507)
Median rent asked for vacant for-rent units in 2022: $1,746
Median gross rent in Marietta, GA in 2022: $1,466
Housing units in Marietta with a mortgage: 7,977 (668 second mortgage, 0 home equity loan, 528 both second mortgage and home equity loan )Houses without a mortgage: 72
Median household income for houses/condos with a mortgage: $139,869
Median household income for apartments without a mortgage: $89,023
Median monthly housing costs: $1,438
Data:
Median house or condo value ($)
Median house or condo value ($ change since 2000)
Median house or condo value ($) - White
Median house or condo value ($) - Black or African American
Median house or condo value ($) - Asian
Median house or condo value ($) - Hispanic or Latino
Median house or condo value ($) - American Indian and Alaska Native
Median house or condo value ($) - Multirace
Median house or condo value ($) - Other Race
Median price asked for mobile homes ($)
Household density (households per square mile)
Mean house or condo value by units in structure - 1, detached ($)
Mean house or condo value by units in structure - 1, attached ($)
Mean house or condo value by units in structure - 2 ($)
Mean house or condo value by units in structure by units in structure - 3 or 4 ($)
Mean house or condo value by units in structure - 5 or more ($)
Mean house or condo value by units in structure - Boat, RV, van, etc. ($)
Mean house or condo value by units in structure - Mobile home ($)
Median contract rent ($)
Median contract rent - Lower quartile ($)
Median contract rent - Upper quartile ($)
Median gross rent ($)
Urban houses (%)
Rural houses (%)
Houses occupied (%)
Houses occupied (% change since 2000)
Houses owner occupied (%)
Houses owner occupied (% change since 2000)
Houses renter occupied (%)
Houses renter occupied (% change since 2000)
Vacant housing units - For rent (%)
Vacant housing units - For rent (% change since 2000)
Vacant housing units - For sale only (%)
Vacant housing units - For sale only (% change since 2000)
Vacant housing units - Rented or sold, not occupied (%)
Vacant housing units - Rented or sold, not occupied (% change since 2000)
Vacant housing units - For seasonal, recreational, or occasional use (%)
Vacant housing units - For seasonal, recreational, or occasional use (% change since 2000)
Vacant housing units - For migrant workers (%)
Vacant housing units - For migrant workers (% change since 2000)
Vacant housing units - Other vacant (%)
Vacant housing units - Other vacant (% change since 2000)
Median monthly housing costs ($)
Median household income for houses/condos with a mortgage ($)
Median household income for houses/condos without a mortgage ($)
Median household income ($)
Median household income ($) - White
Median household income ($) - Black or African American
Median household income ($) - Asian
Median household income ($) - Hispanic or Latino
Median household income ($) - American Indian and Alaska Native
Median household income ($) - Multirace
Median household income ($) - Other Race
Mortgage status - with mortgage (%)
Mortgage status - with second mortgage (%)
Mortgage status - with home equity loan (%)
Mortgage status - with both second mortgage and home equity loan (%)
Mortgage status - without a mortgage (%)
Median year house/condo built
Median year apartment built
Household type by relationship - Male householder living alone (%)
Household type by relationship - Male householder not living alone (%)
Household type by relationship - Female householder living alone (%)
Household type by relationship - Female householder not living alone (%)
Household type by relationship - Opposite-Sex spouse (%)
Household type by relationship - Same-Sex spouse (%)
Household type by relationship - Opposite-Sex unmarried partner (%)
Household type by relationship - Same-Sex unmarried partner (%)
Household type by relationship - In group quarters (%)
Size of family households - 2-person household (%)
Size of family households - 3-person household (%)
Size of family households - 4-person household (%)
Size of family households - 5-person household (%)
Size of family households - 6-person household (%)
Size of family households - 7-or-more-person household (%)
Size of nonfamily households - 1-person household (%)
Size of nonfamily households - 2-person household (%)
Size of nonfamily households - 3-person household (%)
Size of nonfamily households - 4-person household (%)
Size of nonfamily households - 5-person household (%)
Size of nonfamily households - 6-person household (%)
Size of nonfamily households - 7-or-moreperson household (%)
Year house built - Built 2010 or later (%)
Year house built - Built 2000 to 2009 (%)
Year house built - Built 1990 to 1999 (%)
Year house built - Built 1980 to 1989 (%)
Year house built - Built 1970 to 1979 (%)
Year house built - Built 1960 to 1969 (%)
Year house built - Built 1950 to 1959 (%)
Year house built - Built 1940 to 1949 (%)
Year house built - Built 1939 or earlier (%)
Median number of rooms in houses and condos
Median number of rooms in apartments
Median number of bedrooms in owner occupied houses
Mean number of bedrooms in owner occupied houses
Median number of bedrooms in renter occupied houses
Mean number of bedrooms in renter occupied houses
Median number of vehichles in owner occupied houses
Mean number of vehichles in owner occupied houses
Median number of vehichles in renter occupied houses
Mean number of vehichles in renter occupied houses
Rooms in owner-occupied houses - 1 room (%)
Rooms in owner-occupied houses - 2 rooms (%)
Rooms in owner-occupied houses - 3 rooms (%)
Rooms in owner-occupied houses - 4 rooms (%)
Rooms in owner-occupied houses - 5 rooms (%)
Rooms in owner-occupied houses - 6 rooms (%)
Rooms in owner-occupied houses - 7 rooms (%)
Rooms in owner-occupied houses - 8 rooms (%)
Rooms in owner-occupied houses - 9+ rooms (%)
Rooms in renter-occupied houses - 1 room (%)
Rooms in renter-occupied houses - 2 rooms (%)
Rooms in renter-occupied houses - 3 rooms (%)
Rooms in renter-occupied houses - 4 rooms (%)
Rooms in renter-occupied houses - 5 rooms (%)
Rooms in renter-occupied houses - 6 rooms (%)
Rooms in renter-occupied houses - 7 rooms (%)
Rooms in renter-occupied houses - 8 rooms (%)
Rooms in renter-occupied houses - 9+ rooms (%)
Bedrooms in owner-occupied houses - no bedrooms (%)
Bedrooms in owner-occupied houses - 1 bedroom (%)
Bedrooms in owner-occupied houses - 2 bedrooms (%)
Bedrooms in owner-occupied houses - 3 bedrooms (%)
Bedrooms in owner-occupied houses - 4 bedrooms (%)
Bedrooms in owner-occupied houses - 5+ bedrooms (%)
Bedrooms in renter-occupied houses - no bedrooms (%)
Bedrooms in renter-occupied houses - 1 bedroom (%)
Bedrooms in renter-occupied houses - 2 bedrooms (%)
Bedrooms in renter-occupied houses - 3 bedrooms (%)
Bedrooms in renter-occupied houses - 4 bedrooms (%)
Bedrooms in renter-occupied houses - 5+ bedrooms (%)
Vehicles available in owner-occupied houses - no vehicle available (%)
Vehicles available in owner-occupied houses - 1 vehicle available(%)
Vehicles available in owner-occupied houses - 2 Vehicles available (%)
Vehicles available in owner-occupied houses - 3 Vehicles available (%)
Vehicles available in owner-occupied houses - 4 Vehicles available (%)
Vehicles available in owner-occupied houses - 5+ Vehicles available (%)
Vehicles available in renter-occupied houses - no vehicle available (%)
Vehicles available in renter-occupied houses - 1 vehicle available (%)
Vehicles available in renter-occupied houses - 2 Vehicles available (%)
Vehicles available in renter-occupied houses - 3 Vehicles available (%)
Vehicles available in renter-occupied houses - 4 Vehicles available (%)
Vehicles available in renter-occupied houses - 5+ Vehicles available (%)
Housing units in structures - 1, detached (%)
Housing units in structures - 1, attached (%)
Housing units in structures - 2 (%)
Housing units in structures - 3 or 4 (%)
Housing units in structures - 5 to 9 (%)
Housing units in structures - 10 to 19 (%)
Housing units in structures - 20 to 49 (%)
Housing units in structures - 50 or more (%)
Housing units in structures - Mobile home (%)
Housing units in structures - Boat, RV, van, etc. (%)
Housing units in structures - Owners - 1, detached (%)
Housing units in structures - Owners - 1, attached (%)
Housing units in structures - Owners - 2 (%)
Housing units in structures - Owners - 3 or 4 (%)
Housing units in structures - Owners - 5 to 9 (%)
Housing units in structures - Owners - 10 to 19 (%)
Housing units in structures - Owners - 20 to 49 (%)
Housing units in structures - Owners - 50 or more (%)
Housing units in structures - Owners - Mobile home (%)
Housing units in structures - Owners - Boat, RV, van, etc. (%)
Housing units in structures - Renters - 1, detached (%)
Housing units in structures - Renters - 1, attached (%)
Housing units in structures - Renters - 2 (%)
Housing units in structures - Renters - 3 or 4 (%)
Housing units in structures - Renters - 5 to 9 (%)
Housing units in structures - Renters - 10 to 19 (%)
Housing units in structures - Renters - 20 to 49 (%)
Housing units in structures - Renters - 50 or more (%)
Housing units in structures - Renters - Mobile home (%)
Housing units in structures - Renters - Boat, RV, van, etc. (%)
House/condo owner moved in on average (years ago)
Renter moved in on average (years ago)
Year householder moved into unit - Moved in 1999 to March 2000 (%)
Year householder moved into unit - Moved in 1999 to March 2000 (%) - White
Year householder moved into unit - Moved in 1999 to March 2000 (%) - Black or African American
Year householder moved into unit - Moved in 1999 to March 2000 (%) - Asian
Year householder moved into unit - Moved in 1999 to March 2000 (%) - Hispanic or Latino
Year householder moved into unit - Moved in 1999 to March 2000 (%) - American Indian and Alaska Native
Year householder moved into unit - Moved in 1999 to March 2000 (%) - Multirace
Year householder moved into unit - Moved in 1999 to March 2000 (%) - Other Race
Year householder moved into unit - Moved in 1995 to 1998 (%)
Year householder moved into unit - Moved in 1995 to 1998 (%) - White
Year householder moved into unit - Moved in 1995 to 1998 (%) - Black or African American
Year householder moved into unit - Moved in 1995 to 1998 (%) - Asian
Year householder moved into unit - Moved in 1995 to 1998 (%) - Hispanic or Latino
Year householder moved into unit - Moved in 1995 to 1998 (%) - American Indian and Alaska Native
Year householder moved into unit - Moved in 1995 to 1998 (%) - Multirace
Year householder moved into unit - Moved in 1995 to 1998 (%) - Other Race
Year householder moved into unit - Moved in 1990 to 1994 (%)
Year householder moved into unit - Moved in 1990 to 1994 (%) - White
Year householder moved into unit - Moved in 1990 to 1994 (%) - Black or African American
Year householder moved into unit - Moved in 1990 to 1994 (%) - Asian
Year householder moved into unit - Moved in 1990 to 1994 (%) - Hispanic or Latino
Year householder moved into unit - Moved in 1990 to 1994 (%) - American Indian and Alaska Native
Year householder moved into unit - Moved in 1990 to 1994 (%) - Multirace
Year householder moved into unit - Moved in 1990 to 1994 (%) - Other Race
Year householder moved into unit - Moved in 1980 to 1989 (%)
Year householder moved into unit - Moved in 1980 to 1989 (%) - White
Year householder moved into unit - Moved in 1980 to 1989 (%) - Black or African American
Year householder moved into unit - Moved in 1980 to 1989 (%) - Asian
Year householder moved into unit - Moved in 1980 to 1989 (%) - Hispanic or Latino
Year householder moved into unit - Moved in 1980 to 1989 (%) - American Indian and Alaska Native
Year householder moved into unit - Moved in 1980 to 1989 (%) - Multirace
Year householder moved into unit - Moved in 1980 to 1989 (%) - Other Race
Year householder moved into unit - Moved in 1970 to 1979 (%)
Year householder moved into unit - Moved in 1970 to 1979 (%) - White
Year householder moved into unit - Moved in 1970 to 1979 (%) - Black or African American
Year householder moved into unit - Moved in 1970 to 1979 (%) - Asian
Year householder moved into unit - Moved in 1970 to 1979 (%) - Hispanic or Latino
Year householder moved into unit - Moved in 1970 to 1979 (%) - American Indian and Alaska Native
Year householder moved into unit - Moved in 1970 to 1979 (%) - Multirace
Year householder moved into unit - Moved in 1970 to 1979 (%) - Other Race
Year householder moved into unit - Moved in 1969 or earlier (%)
Year householder moved into unit - Moved in 1969 or earlier (%) - White
Year householder moved into unit - Moved in 1969 or earlier (%) - Black or African American
Year householder moved into unit - Moved in 1969 or earlier (%) - Asian
Year householder moved into unit - Moved in 1969 or earlier (%) - Hispanic or Latino
Year householder moved into unit - Moved in 1969 or earlier (%) - American Indian and Alaska Native
Year householder moved into unit - Moved in 1969 or earlier (%) - Multirace
Year householder moved into unit - Moved in 1969 or earlier (%) - Other Race
Housing units lacking complete plumbing facilities (%)
Housing units lacking complete kitchen facilities (%)
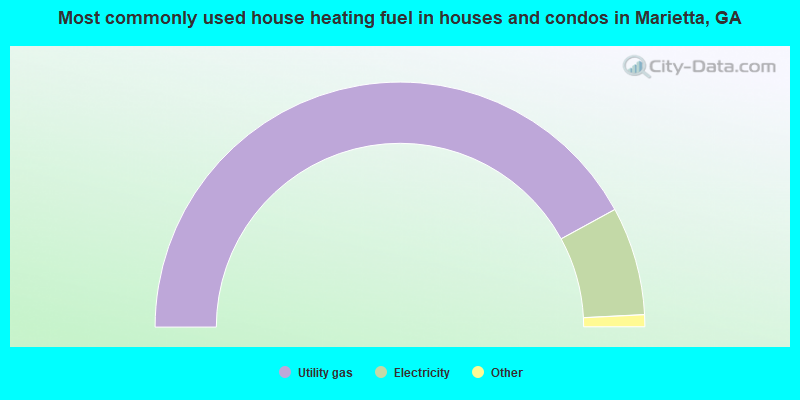
House heating fuel used in houses and condos - Utility gas (%)
House heating fuel used in houses and condos - Bottled, tank, or LP gas (%)
House heating fuel used in houses and condos - Electricity (%)
House heating fuel used in houses and condos - Fuel oil, kerosene, etc. (%)
House heating fuel used in houses and condos - Coal or coke (%)
House heating fuel used in houses and condos - Wood (%)
House heating fuel used in houses and condos - Solar energy (%)
House heating fuel used in houses and condos - Other fuel (%)
House heating fuel used in houses and condos - No fuel used (%)
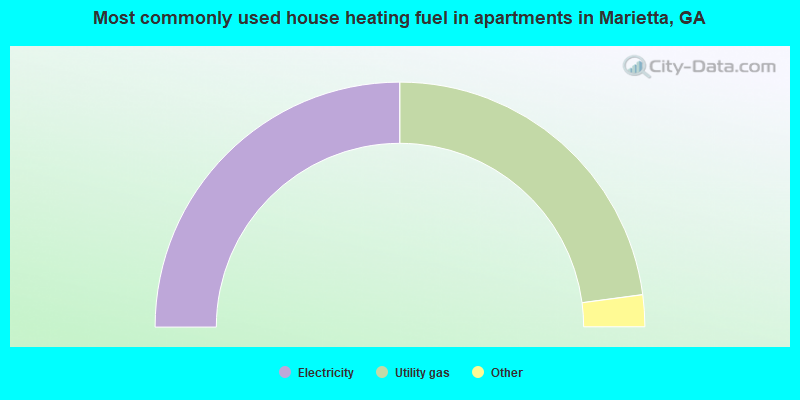
House heating fuel used in apartments - Utility gas (%)
House heating fuel used in apartments - Bottled, tank, or LP gas (%)
House heating fuel used in apartments - Electricity (%)
House heating fuel used in apartments - Fuel oil, kerosene, etc. (%)
House heating fuel used in apartments - Coal or coke (%)
House heating fuel used in apartments - Wood (%)
House heating fuel used in apartments - Solar energy (%)
House heating fuel used in apartments - Other fuel (%)
House heating fuel used in apartments - No fuel used (%)
Latest news about housing in Marietta, GA collected exclusively by city-data.com from local newspapers, TV, and radio stations
Median year house/condo built: 1988Median year apartment built: 1984Household type by relationship:
Households: 61,879
Male householders: 10,780 (3,357 living alone ), Female householders: 13,817 (5,059 living alone )9,089 spouses (9,026 opposite-sex spouses ), 2,210 unmarried partners , (1,972 opposite-sex unmarried partners ), 16,401 children (15,738 natural , 176 adopted , 486 stepchildren ), 918 grandchildren , 826 brothers or sisters , 609 parents , 0 foster children , 1,189 other relatives , 3,029 non-relatives In group quarters: 3,005
Size of family households: 6,210 2-persons , 3,957 3-persons , 2,314 4-persons , 1,458 5-persons , 226 6-persons , 260 7-or-more-persons .
Size of nonfamily households: 8,357 1-person , 1,554 2-persons , 287 3-persons , 205 4-persons , 55 6-persons .
7,181 married couples with children. single-parent households (974 men , 3,039 women ).
75.1% of residents of Marietta speak English at home. of residents speak Spanish at home (41% speak English very well , 18% speak English well , 18% speak English not well , 23% don't speak English at all ).of residents speak other Indo-European language at home (71% speak English very well , 19% speak English well , 7% speak English not well , 2% don't speak English at all ).of residents speak Asian or Pacific Island language at home (72% speak English very well , 18% speak English well , 6% speak English not well , 5% don't speak English at all ).of residents speak other language at home (89% speak English very well , 7% speak English well , 4% speak English not well ).
Foreign born population: 11,247 (18.2%)of them are naturalized citizens )
Median number of rooms in houses and condos:
Median number of rooms in apartments
Owner-occupied Renter-occupied
Rooms in owner-occupied houses in Marietta, Georgia
0 1 room 0 2 rooms 145 3 rooms 392 4 rooms 1,359 5 rooms 1,901 6 rooms 1,967 7 rooms 2,075 8 rooms 3,718 9+ rooms
Rooms in renter-occupied apartments in Marietta, Georgia
574 1 room 1,153 2 rooms 2,659 3 rooms 4,559 4 rooms 2,645 5 rooms 1,078 6 rooms 512 7 rooms 229 8 rooms 29 9+ rooms
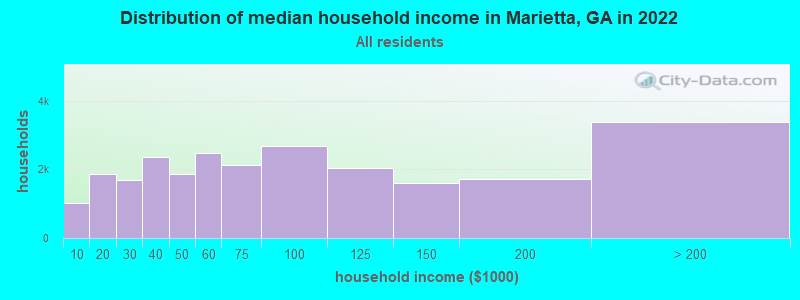
Marietta, GA household income distribution 1,009 Less than $10,0001,857 $10,000 to $19,9991,682 $20,000 to $29,9992,364 $30,000 to $39,9991,865 $40,000 to $49,9992,464 $50,000 to $59,9992,125 $60,000 to $74,9992,686 $75,000 to $99,9992,042 $100,000 to $124,9991,601 $125,000 to $149,9991,722 $150,000 to $199,9993,378 $200,000 or more
Home value of owner - occupied houses in 2022 in Marietta, GA 151 Less than $10,00017 $10,000 to $14,99917 $15,000 to $19,99913 $50,000 to $59,99925 $60,000 to $69,99986 $70,000 to $79,99922 $80,000 to $89,99953 $90,000 to $99,999139 $100,000 to $124,999201 $125,000 to $149,999201 $150,000 to $174,999222 $175,000 to $199,999422 $200,000 to $249,999813 $250,000 to $299,9993,183 $300,000 to $399,9992,489 $400,000 to $499,9992,955 $500,000 to $749,999792 $750,000 to $999,999307 $1,000,000 to $1,499,99937 $1,500,000 to $1,999,99990 $2,000,000 or moreRent paid by renters in 2022 in Marietta, GA 25 Less than $10037 $100 to $149180 $150 to $199110 $200 to $24937 $250 to $29996 $300 to $34937 $350 to $39998 $400 to $44925 $450 to $499248 $500 to $54995 $550 to $599155 $600 to $649113 $650 to $699138 $700 to $74962 $750 to $799769 $800 to $899651 $900 to $9993,237 $1,000 to $1,2493,050 $1,250 to $1,4992,230 $1,500 to $1,999427 $2,000 to $2,49957 $2,500 to $2,9999 $3,000 to $3,49974 $3,500 or more147 No cash rent
Percentage of workers working in this county: 73.6%Number of people working at home: 6,726 (20.2% of all workers )
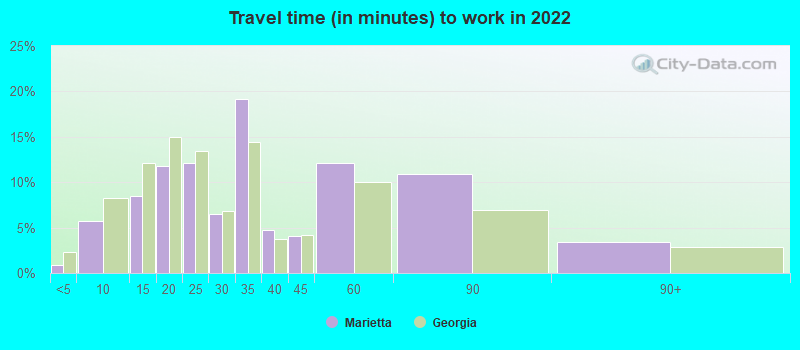
Travel time to work (commute)
Less than 5 minutes: 1665 to 9 minutes: 2,40910 to 14 minutes: 3,30315 to 19 minutes: 3,26520 to 24 minutes: 3,45725 to 29 minutes: 1,84130 to 34 minutes: 5,50035 to 39 minutes: 76240 to 44 minutes: 1,03145 to 59 minutes: 2,69060 to 89 minutes: 1,31190 or more minutes: 446
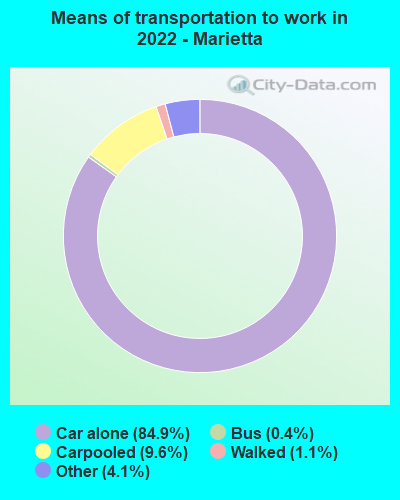
Means of transportation to work:
Drove a car alone: 62,653 (72.7%)Carpooled: 8,424 (9.8%)Bus : 291 (0.3%)Long-distance train or commuter rail : 8 (0.0%)Taxi: 3,662 (4.2%)Bicycle: 17 (0.0%)Walked: 969 (1.1%)Worked at home: 6,726 (7.8%)
Unemployment by race in 2022
Unemployment rate for White non-Hispanic residents 1.7% Males1.7% FemalesUnemployment rate for Black residents 3.9% Males4.4% FemalesUnemployment rate for other race residents 0.7% FemalesUnemployment rate for two or more race residents 5.5% FemalesUnemployment rate for Hispanic or Latino residents 1.1% Males3.6% Females
Year of entry for the foreign-born population in Marietta, Georgia
5,828 2010 or later 2,560 2000 to 2009 1,480 1990 to 1999 1,666 1980 to 1989 588 1970 to 1979 463 Before 1970
First ancestries reported:
English: 4,432 (12.8%)
American: 1,607 (4.6%)
Irish: 1,458 (4.2%)
German: 1,194 (3.4%)
Jamaican: 939 (2.7%)
African: 842 (2.4%)
West Indian: 782 (2.3%)
Nigerian: 770 (2.2%)
Scottish: 589 (1.7%)
European: 483 (1.4%)
Haitian: 401 (1.2%)
Italian: 397 (1.1%)
Brazilian: 355 (1.0%)
Bahamian: 255 (0.7%)
Polish: 235 (0.7%)
Scotch-Irish: 198 (0.6%)
Iranian: 168 (0.5%)
Finnish: 163 (0.5%)
Eastern European: 115 (0.3%)
Greek: 114 (0.3%)
British: 113 (0.3%)
Norwegian: 108 (0.3%)
Kenyan: 86 (0.2%)
Czechoslovakian: 66 (0.2%)
Dutch: 64 (0.2%)
Belgian: 62 (0.2%)
Ethiopian: 62 (0.2%)
French: 62 (0.2%)
Portuguese: 58 (0.2%)
Northern European: 52 (0.2%)
Welsh: 51 (0.1%)
Swiss: 49 (0.1%)
Scandinavian: 42 (0.1%)
Ukrainian: 40 (0.1%)
British West Indian: 38 (0.1%)
French Canadian: 34 (0.10%)
Czech: 31 (0.09%)
Armenian: 30 (0.09%)
Maltese: 28 (0.08%)
Zimbabwean: 27 (0.08%)
Swedish: 25 (0.07%)
Austrian: 24 (0.07%)
Syrian: 22 (0.06%)
Hungarian: 22 (0.06%)
Trinidadian and Tobagonian: 22 (0.06%)
Barbadian: 20 (0.06%)
Moroccan: 19 (0.05%)
Icelander: 19 (0.05%)
Cajun: 17 (0.05%)
Romanian: 15 (0.04%)
Bulgarian: 14 (0.04%)
Liberian: 13 (0.04%)
Canadian: 12 (0.03%)
Russian: 12 (0.03%)
Pennsylvania German: 10 (0.03%)
Arab: 9 (0.03%)
Lithuanian: 9 (0.03%)
U.S. Virgin Islander: 8 (0.02%)
Palestinian: 7 (0.02%)
Croatian: 7 (0.02%)
Somali: 6 (0.02%)
Guyanese: 3 (0.01%)
Most common places of birth for foreign-born residents (%): Mexico Marietta:
22.7% (2,497)Georgia:
20.0% (223,400)
Guatemala Marietta:
19.2% (2,110)Georgia:
3.6% (39,974)
Jamaica Marietta:
6.9% (758)Georgia:
4.6% (51,270)
Venezuela Marietta:
6.3% (690)Georgia:
1.7% (19,012)
Nigeria Marietta:
5.9% (647)Georgia:
2.5% (27,846)
El Salvador Marietta:
4.6% (506)Georgia:
2.5% (27,794)
Honduras Marietta:
4.0% (441)Georgia:
2.1% (23,500)
Brazil Marietta:
4.0% (437)Georgia:
1.6% (18,211)
Haiti Marietta:
3.6% (392)Georgia:
1.6% (17,476)
Bahamas Marietta:
3.4% (369)Georgia:
0.3% (3,222)
Colombia Marietta:
1.7% (183)Georgia:
2.1% (23,813)
England Marietta:
1.6% (177)Georgia:
0.8% (8,849)
Place of birth for U.S.-born residents:
This state: 25,686Other state: 23,546Northeast: 5,375Midwest: 4,542South: 11,775West: 1,802 80.3% of Marietta residents lived in the same house 1 years ago.
Out of people who lived in different houses, 27.6% lived in this county.
Out of people who lived in different counties, 58.2% lived in Georgia.
Marietta:
80.3%State average:
86.6%
Education attainment for males 25 years and older:
No schooling: 607Nursery to 4th grade: 1205th and 6th grade: 8297th and 8th grade: 1589th grade: 20310th grade: 11011th grade: 14512th grade, no diploma: 91High school graduate (or equivalency): 3,210Less than 1 year of college: 942Some college more than 1 year, no degree: 2,462Associate degree: 1,300Bachelor's degree: 6,143Master's degree: 2,363Professional school degree: 455Doctorate degree: 409
Education attainment for females 25 years and older:
No schooling: 266Nursery to 4th grade: 2215th and 6th grade: 2647th and 8th grade: 1379th grade: 21110th grade: 14811th grade: 34812th grade, no diploma: 509High school graduate (or equivalency): 3,631Less than 1 year of college: 1,104Some college more than 1 year, no degree: 2,912Associate degree: 1,672Bachelor's degree: 6,750Master's degree: 2,543Professional school degree: 776Doctorate degree: 296
Housing units in structures:
One, detached: 11,902One, attached: 3,215Two: 2963 or 4: 8285 to 9: 2,44010 to 19: 3,97320 to 49: 2,26150 or more: 2,086Mobile homes: 57Housing units lacking complete plumbing facilities in 2022: 0.6%Housing units lacking complete kitchen facilities in 2022: 1.8%House/condo owner moved in on average 9 years ago
Renter moved in on average 3 years ago
Private vs. public school enrollment:
Students in private schools in grades 1 to 8 (elementary and middle school): 496 Students in private schools in grades 9 to 12 (high school): 261 Students in private undergraduate colleges: 579