Races in Marietta, Georgia (GA) Detailed Stats
Data:
Races - White alone (%)
Races - White alone (% change since 2000)
Races - Black alone (%)
Races - Black alone (% change since 2000)
Races - American Indian alone (%)
Races - American Indian alone (% change since 2000)
Races - Asian alone (%)
Races - Asian alone (% change since 2000)
Races - Hispanic (%)
Races - Hispanic (% change since 2000)
Races - Native Hawaiian and Other Pacific Islander alone (%)
Races - Native Hawaiian and Other Pacific Islander alone (% change since 2000)
Races - Two or more races(%)
Races - Two or more races(% change since 2000)
Races - Other race alone (%)
Races - Other race alone (% change since 2000)
Racial diversity
Place of birth - Born in state of residence (%)
Place of birth - Born in state of residence (%) - White
Place of birth - Born in state of residence (%) - Black or African American
Place of birth - Born in state of residence (%) - Asian
Place of birth - Born in state of residence (%) - Hispanic or Latino
Place of birth - Born in state of residence (%) - American Indian and Alaska Native
Place of birth - Born in state of residence (%) - Multirace
Place of birth - Born in state of residence (%) - Other Race
Place of birth - Born in other state (%)
Place of birth - Born in other state (%) - White
Place of birth - Born in other state (%) - Black or African American
Place of birth - Born in other state (%) - Asian
Place of birth - Born in other state (%) - Hispanic or Latino
Place of birth - Born in other state (%) - American Indian and Alaska Native
Place of birth - Born in other state (%) - Multirace
Place of birth - Born in other state (%) - Other Race
Place of birth - Native, outside of US (%)
Place of birth - Native, outside of US (%) - White
Place of birth - Native, outside of US (%) - Black or African American
Place of birth - Native, outside of US (%) - Asian
Place of birth - Native, outside of US (%) - Hispanic or Latino
Place of birth - Native, outside of US (%) - American Indian and Alaska Native
Place of birth - Native, outside of US (%) - Multirace
Place of birth - Native, outside of US (%) - Other Race
Place of birth - Foreign born (%)
Place of birth - Foreign born (%) - White
Place of birth - Foreign born (%) - Black or African American
Place of birth - Foreign born (%) - Asian
Place of birth - Foreign born (%) - Hispanic or Latino
Place of birth - Foreign born (%) - American Indian and Alaska Native
Place of birth - Foreign born (%) - Multirace
Place of birth - Foreign born (%) - Other Race
Residents speaking English at home (%)
Residents speaking English at home - Born in the United States (%)
Residents speaking English at home - Native, born elsewhere (%)
Residents speaking English at home - Foreign born (%)
Residents speaking Spanish at home (%)
Residents speaking Spanish at home - Born in the United States (%)
Residents speaking Spanish at home - Native, born elsewhere (%)
Residents speaking Spanish at home - Foreign born (%)
Residents speaking other language at home (%)
Residents speaking other language at home - Born in the United States (%)
Residents speaking other language at home - Native, born elsewhere (%)
Residents speaking other language at home - Foreign born (%)
Marital status - Never married (%)
Marital status - Now married (%)
Marital status - Separated (%)
Marital status - Widowed (%)
Marital status - Divorced (%)
Ancestries Reported - Arab (%)
Ancestries Reported - Czech (%)
Ancestries Reported - Danish (%)
Ancestries Reported - Dutch (%)
Ancestries Reported - English (%)
Ancestries Reported - French (%)
Ancestries Reported - French Canadian (%)
Ancestries Reported - German (%)
Ancestries Reported - Greek (%)
Ancestries Reported - Hungarian (%)
Ancestries Reported - Irish (%)
Ancestries Reported - Italian (%)
Ancestries Reported - Lithuanian (%)
Ancestries Reported - Norwegian (%)
Ancestries Reported - Polish (%)
Ancestries Reported - Portuguese (%)
Ancestries Reported - Russian (%)
Ancestries Reported - Scotch-Irish (%)
Ancestries Reported - Scottish (%)
Ancestries Reported - Slovak (%)
Ancestries Reported - Subsaharan African (%)
Ancestries Reported - Swedish (%)
Ancestries Reported - Swiss (%)
Ancestries Reported - Ukrainian (%)
Ancestries Reported - United States (%)
Ancestries Reported - Welsh (%)
Ancestries Reported - West Indian (%)
Ancestries Reported - Other (%)
Geographical mobility - Same house 1 year ago (%)
Geographical mobility - Same house 1 year ago (%) - White
Geographical mobility - Same house 1 year ago (%) - Black or African American
Geographical mobility - Same house 1 year ago (%) - Asian
Geographical mobility - Same house 1 year ago (%) - Hispanic or Latino
Geographical mobility - Same house 1 year ago (%) - American Indian and Alaska Native
Geographical mobility - Same house 1 year ago (%) - Multirace
Geographical mobility - Same house 1 year ago (%) - Other Race
Geographical mobility - Moved within same county (%)
Geographical mobility - Moved within same county (%) - White
Geographical mobility - Moved within same county (%) - Black or African American
Geographical mobility - Moved within same county (%) - Asian
Geographical mobility - Moved within same county (%) - Hispanic or Latino
Geographical mobility - Moved within same county (%) - American Indian and Alaska Native
Geographical mobility - Moved within same county (%) - Multirace
Geographical mobility - Moved within same county (%) - Other Race
Geographical mobility - Moved from different county within same state (%)
Geographical mobility - Moved from different county within same state (%) - White
Geographical mobility - Moved from different county within same state (%) - Black or African American
Geographical mobility - Moved from different county within same state (%) - Asian
Geographical mobility - Moved from different county within same state (%) - Hispanic or Latino
Geographical mobility - Moved from different county within same state (%) - American Indian and Alaska Native
Geographical mobility - Moved from different county within same state (%) - Multirace
Geographical mobility - Moved from different county within same state (%) - Other Race
Geographical mobility - Moved from different state (%)
Geographical mobility - Moved from different state (%) - White
Geographical mobility - Moved from different state (%) - Black or African American
Geographical mobility - Moved from different state (%) - Asian
Geographical mobility - Moved from different state (%) - Hispanic or Latino
Geographical mobility - Moved from different state (%) - American Indian and Alaska Native
Geographical mobility - Moved from different state (%) - Multirace
Geographical mobility - Moved from different state (%) - Other Race
Geographical mobility - Moved from abroad (%)
Geographical mobility - Moved from abroad (%) - White
Geographical mobility - Moved from abroad (%) - Black or African American
Geographical mobility - Moved from abroad (%) - Asian
Geographical mobility - Moved from abroad (%) - Hispanic or Latino
Geographical mobility - Moved from abroad (%) - American Indian and Alaska Native
Geographical mobility - Moved from abroad (%) - Multirace
Geographical mobility - Moved from abroad (%) - Other Race
Place of birth for the foreign-born population - Ireland (%)
Place of birth for the foreign-born population - Denmark (%)
Place of birth for the foreign-born population - Norway (%)
Place of birth for the foreign-born population - Sweden (%)
Place of birth for the foreign-born population - United Kingdom (%)
Place of birth for the foreign-born population - England (%)
Place of birth for the foreign-born population - Scotland (%)
Place of birth for the foreign-born population - Other Northern Europe (%)
Place of birth for the foreign-born population - Austria (%)
Place of birth for the foreign-born population - Belgium (%)
Place of birth for the foreign-born population - France (%)
Place of birth for the foreign-born population - Germany (%)
Place of birth for the foreign-born population - Netherlands (%)
Place of birth for the foreign-born population - Switzerland (%)
Place of birth for the foreign-born population - Other Western Europe (%)
Place of birth for the foreign-born population - Greece (%)
Place of birth for the foreign-born population - Italy (%)
Place of birth for the foreign-born population - Portugal (%)
Place of birth for the foreign-born population - Spain (%)
Place of birth for the foreign-born population - Other Southern Europe (%)
Place of birth for the foreign-born population - Albania (%)
Place of birth for the foreign-born population - Belarus (%)
Place of birth for the foreign-born population - Bosnia and Herzegovina (%)
Place of birth for the foreign-born population - Bulgaria (%)
Place of birth for the foreign-born population - Croatia (%)
Place of birth for the foreign-born population - Czechoslovakia (%)
Place of birth for the foreign-born population - Hungary (%)
Place of birth for the foreign-born population - Latvia (%)
Place of birth for the foreign-born population - Lithuania (%)
Place of birth for the foreign-born population - North Macedonia (Macedonia) (%)
Place of birth for the foreign-born population - Moldova (%)
Place of birth for the foreign-born population - Poland (%)
Place of birth for the foreign-born population - Romania (%)
Place of birth for the foreign-born population - Russia (%)
Place of birth for the foreign-born population - Serbia (%)
Place of birth for the foreign-born population - Ukraine (%)
Place of birth for the foreign-born population - Other Eastern Europe (%)
Place of birth for the foreign-born population - China (%)
Place of birth for the foreign-born population - Hong Kong (%)
Place of birth for the foreign-born population - Taiwan (%)
Place of birth for the foreign-born population - Japan (%)
Place of birth for the foreign-born population - Korea (%)
Place of birth for the foreign-born population - Other Eastern Asia (%)
Place of birth for the foreign-born population - Afghanistan (%)
Place of birth for the foreign-born population - Bangladesh (%)
Place of birth for the foreign-born population - India (%)
Place of birth for the foreign-born population - Iran (%)
Place of birth for the foreign-born population - Kazakhstan (%)
Place of birth for the foreign-born population - Nepal (%)
Place of birth for the foreign-born population - Pakistan (%)
Place of birth for the foreign-born population - Sri Lanka (%)
Place of birth for the foreign-born population - Uzbekistan (%)
Place of birth for the foreign-born population - Other South Central Asia (%)
Place of birth for the foreign-born population - Burma (%)
Place of birth for the foreign-born population - Cambodia (%)
Place of birth for the foreign-born population - Indonesia (%)
Place of birth for the foreign-born population - Laos (%)
Place of birth for the foreign-born population - Malaysia (%)
Place of birth for the foreign-born population - Philippines (%)
Place of birth for the foreign-born population - Singapore (%)
Place of birth for the foreign-born population - Thailand (%)
Place of birth for the foreign-born population - Vietnam (%)
Place of birth for the foreign-born population - Other South Eastern Asia (%)
Place of birth for the foreign-born population - Armenia (%)
Place of birth for the foreign-born population - Iraq (%)
Place of birth for the foreign-born population - Israel (%)
Place of birth for the foreign-born population - Jordan (%)
Place of birth for the foreign-born population - Kuwait (%)
Place of birth for the foreign-born population - Lebanon (%)
Place of birth for the foreign-born population - Saudi Arabia (%)
Place of birth for the foreign-born population - Syria (%)
Place of birth for the foreign-born population - Turkey (%)
Place of birth for the foreign-born population - Yemen (%)
Place of birth for the foreign-born population - Other Western Asia (%)
Place of birth for the foreign-born population - Eritrea (%)
Place of birth for the foreign-born population - Ethiopia (%)
Place of birth for the foreign-born population - Kenya (%)
Place of birth for the foreign-born population - Somalia (%)
Place of birth for the foreign-born population - Uganda (%)
Place of birth for the foreign-born population - Zimbabwe (%)
Place of birth for the foreign-born population - Other Eastern Africa (%)
Place of birth for the foreign-born population - Cameroon (%)
Place of birth for the foreign-born population - Congo (%)
Place of birth for the foreign-born population - Democratic Republic of Congo (Zaire) (%)
Place of birth for the foreign-born population - Other Middle Africa (%)
Place of birth for the foreign-born population - Egypt (%)
Place of birth for the foreign-born population - Morocco (%)
Place of birth for the foreign-born population - Sudan (%)
Place of birth for the foreign-born population - Other Northern Africa (%)
Place of birth for the foreign-born population - South Africa (%)
Place of birth for the foreign-born population - Other Southern Africa (%)
Place of birth for the foreign-born population - Cabo Verde (%)
Place of birth for the foreign-born population - Ghana (%)
Place of birth for the foreign-born population - Liberia (%)
Place of birth for the foreign-born population - Nigeria (%)
Place of birth for the foreign-born population - Senegal (%)
Place of birth for the foreign-born population - Sierra Leone (%)
Place of birth for the foreign-born population - Other Western Africa (%)
Place of birth for the foreign-born population - Australia (%)
Place of birth for the foreign-born population - New Zealand (%)
Place of birth for the foreign-born population - Fiji (%)
Place of birth for the foreign-born population - Micronesia (%)
Place of birth for the foreign-born population - Bahamas (%)
Place of birth for the foreign-born population - Barbados (%)
Place of birth for the foreign-born population - Cuba (%)
Place of birth for the foreign-born population - Dominica (%)
Place of birth for the foreign-born population - Dominican Republic (%)
Place of birth for the foreign-born population - Grenada (%)
Place of birth for the foreign-born population - Haiti (%)
Place of birth for the foreign-born population - Jamaica (%)
Place of birth for the foreign-born population - St. Vincent and the Grenadines (%)
Place of birth for the foreign-born population - Trinidad and Tobago (%)
Place of birth for the foreign-born population - West Indies (%)
Place of birth for the foreign-born population - Other Caribbean (%)
Place of birth for the foreign-born population - Belize (%)
Place of birth for the foreign-born population - Costa Rica (%)
Place of birth for the foreign-born population - El Salvador (%)
Place of birth for the foreign-born population - Guatemala (%)
Place of birth for the foreign-born population - Honduras (%)
Place of birth for the foreign-born population - Mexico (%)
Place of birth for the foreign-born population - Nicaragua (%)
Place of birth for the foreign-born population - Panama (%)
Place of birth for the foreign-born population - Other Central America (%)
Place of birth for the foreign-born population - Argentina (%)
Place of birth for the foreign-born population - Bolivia (%)
Place of birth for the foreign-born population - Brazil (%)
Place of birth for the foreign-born population - Chile (%)
Place of birth for the foreign-born population - Colombia (%)
Place of birth for the foreign-born population - Ecuador (%)
Place of birth for the foreign-born population - Guyana (%)
Place of birth for the foreign-born population - Peru (%)
Place of birth for the foreign-born population - Uruguay (%)
Place of birth for the foreign-born population - Venezuela (%)
Place of birth for the foreign-born population - Other South America (%)
Place of birth for the foreign-born population - Canada (%)
Place of birth for the foreign-born population - Other Northern America (%)
Place of birth for the foreign-born population - Other (%)
Latest news about races in Marietta, GA collected exclusively by city-data.com from local newspapers, TV, and radio stations
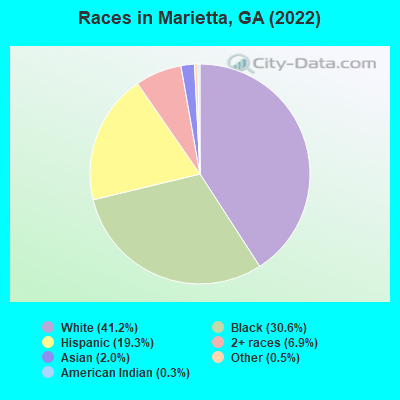
According to 2022 data, the most numerous races in Marietta, GA are White alone (25,510 residents), Black alone (18,924 residents), and Hispanic (11,968 residents). 74.9% of Marietta residents speak English at home. 17.8% of Marietta, GA residents are foreign-born (13.2% born in Latin America), which is 43.7% greater than the foreign-born rate of 10.0% across the entire state of Georgia.
Race distribution in Marietta
2000 2022
28,544 48.6% White alone 17,090 29.1% Black alone 9,947 16.9% Hispanic 1,724 2.9% Asian alone 1,020 1.7% Two or more races 268 0.5% Other race alone 125 0.2% American Indian alone 30 0.05% Native Hawaiian and Other
25,510 41.2% White alone 18,924 30.6% Black alone 11,968 19.3% Hispanic 4,273 6.9% Two or more races 1,268 2.0% Asian alone 282 0.5% Other race alone 173 0.3% American Indian alone
2000 2022
5,128,661 62.6% White alone 2,331,465 28.5% Black alone 435,227 5.3% Hispanic 171,513 2.1% Asian alone 87,364 1.1% Two or more races 17,670 0.2% American Indian alone 11,275 0.1% Other race alone 3,278 0.04% Native Hawaiian and Other
5,415,657 49.6% White alone 3,349,240 30.7% Black alone 1,132,604 10.4% Hispanic 479,156 4.4% Asian alone 462,923 4.2% Two or more races 54,416 0.5% Other race alone 11,923 0.1% American Indian alone 6,957 0.06% Native Hawaiian and Other
Income and house value in Marietta Median household income in 2022 $85,567 White non-Hispanic householders$50,006 Black householders$27,590 American Indian and Alaska Native householders$114,881 Asian householders$68,560 Some other race householders$83,610 Two or more races householders$61,402 Hispanic or Latino race householdersMedian 2022 house value $484,541 White Non-Hispanic householders$264,758 Black or African American householders$354,710 American Indian or Alaska Native householders $422,474 Asian householders$357,409 Some other race householders$293,543 Two or more races householders$328,924 Hispanic or Latino householders
Median age by race in Marietta
39.8 Median age for White residents37.6 45.7 36.0 Median age for Black or African American residents34.1 38.0 18.5 Median age for American Indian / Alaska Native residents31.6 12.6 38.0 Median age for Asian residents23.8 39.2 -657,243,815.6 Median age for Native Hawaiian / Pacific Islander residents-693,227,090.9 -776,776,776.0 29.1 Median age for Other race residents28.9 29.7 26.2 Median age for Two or more races residents28.9 25.0 40.0 Median age for White alone residents36.9 45.7 26.6 Median age for Hispanic or Latino residents30.6 23.6
Owner/renter occupied households by race in Marietta
House owners and renters - White residents 7,756 64.1% Owner occupied4,352 35.9% Renter occupiedHouse owners and renters - Black or African American residents 2,212 27.1% Owner occupied5,964 72.9% Renter occupiedHouse owners and renters - American Indian / Alaska Native residents 74 14.1% Owner occupied450 85.9% Renter occupiedHouse owners and renters - Asian residents 312 82.4% Owner occupied67 17.6% Renter occupiedHouse owners and renters - Other race residents 362 18.8% Owner occupied1,566 81.2% Renter occupiedHouse owners and renters - Two or more races residents 874 43.6% Owner occupied1,132 56.4% Renter occupiedHouse owners and renters - White alone residents 7,640 64.2% Owner occupied4,264 35.8% Renter occupiedHouse owners and renters - Hispanic or Latino residents 730 22.9% Owner occupied2,457 77.1% Renter occupied
Language usage in Marietta
English speakers - Total 74.9% of residents of Marietta speak English at home.
17.6% of residents speak Spanish at home 4,323 42.2% Speak English very well5,922 57.8% Speak English less than very well7.4% of residents speak other language at home 3,273 75.7% Speak English very well1,048 24.3% Speak English less than very well
English speakers - Born in the United States 91.0% of residents of Marietta speak English at home.
5.6% of residents speak Spanish at home 969 74.1% Speak English very well339 25.9% Speak English less than very well3.5% of residents speak other language at home 813 99.3% Speak English very well6 0.7% Speak English less than very well
English speakers - Native, born elsewhere 58.0% of residents of Marietta speak English at home.
35.4% of residents speak Spanish at home 163 33.6% Speak English very well322 66.4% Speak English less than very well4.4% of residents speak other language at home 28 45.9% Speak English very well33 54.1% Speak English less than very well
English speakers - Foreign-born 21.6% of residents of Marietta speak English at home.
52.2% of residents speak Spanish at home 1,005 17.2% Speak English very well4,831 82.8% Speak English less than very well24.0% of residents speak other language at home 1,728 64.3% Speak English very well961 35.7% Speak English less than very well
White (Caucasian) - Speak only English Native:
96.6% (23,061)Foreign-born:
35.7% (417)
White (Caucasian) - Speak another language Native:
3.3% (781)Foreign-born:
65.4% (766)
Black or African American - Speak only English Native:
94.3% (14,061)Foreign-born:
48.8% (1,455)
Black or African American - Speak another language Native:
5.4% (809)Foreign-born:
47.6% (1,419)
American Indian / Alaska Native - Speak another language Native:
28.3% (208)Foreign-born:
100.0% (470)
Asian - Speak only English Native:
54.7% (391)Foreign-born:
16.4% (103)
Asian - Speak another language Native:
42.6% (305)Foreign-born:
83.6% (523)
Other race - Speak only English Native:
8.3% (221)Foreign-born:
0.6% (25)
Other race - Speak another language Native:
95.8% (2,551)Foreign-born:
100.0% (4,234)
Two or more races - Speak only English Native:
75.2% (3,588)Foreign-born:
28.6% (549)
Two or more races - Speak another language Native:
24.5% (1,166)Foreign-born:
74.6% (1,431)
White alone - Speak only English Native:
97.3% (22,807)Foreign-born:
45.3% (417)
White alone - Speak another language Native:
2.6% (608)Foreign-born:
55.7% (514)
Hispanic or Latino - Speak only English Native:
20.7% (974)Foreign-born:
3.7% (232)
Hispanic or Latino - Speak another language Native:
79.3% (3,734)Foreign-born:
96.2% (5,969)
Foreign-born residents in Marietta 10,988 residents are foreign born (13.2% Latin America ).
This city:
17.8%Georgia:
10.4%
Marital status for residents in Marietta Marital status - White (Caucasian) population 15 years and over
Males 38.8% Never married47.6% Now married1.2% Separated2.0% Widowed10.3% DivorcedFemales 27.1% Never married45.2% Now married1.1% Separated11.0% Widowed15.7% DivorcedWomen who gave birth in the past 12 months Now married:
85.7% (191)Unmarried:
14.3% (32)
Women who did not give birth in the past 12 months Now married:
45.0% (2,550)Unmarried:
55.0% (3,111)
Marital status - Black or African American population 15 years and over
Males 53.5% Never married30.9% Now married4.8% Separated1.9% Widowed8.9% DivorcedFemales 43.8% Never married23.0% Now married2.3% Separated7.9% Widowed22.9% DivorcedWomen who gave birth in the past 12 months Now married:
28.8% (84)Unmarried:
71.2% (207)
Women who did not give birth in the past 12 months Now married:
17.4% (835)Unmarried:
82.6% (3,959)
Marital status - American Indian / Alaska Native population 15 years and over
Males 14.6% Never married39.7% Now married18.7% Separated4.6% Widowed22.4% DivorcedFemales 50.0% Never married50.0% Now married0.0% Separated0.0% Widowed0.0% DivorcedWomen who gave birth in the past 12 months Now married:
100.0% (59)Unmarried:
0.0% (0)
Women who did not give birth in the past 12 months Now married:
38.0% (108)Unmarried:
62.0% (176)
Marital status - Asian population 15 years and over
Males 40.3% Never married56.3% Now married0.0% Separated0.0% Widowed3.4% DivorcedFemales 32.9% Never married59.9% Now married0.0% Separated6.3% Widowed1.0% DivorcedWomen who gave birth in the past 12 months Now married:
100.0% (25)Unmarried:
0.0% (0)
Women who did not give birth in the past 12 months Now married:
43.4% (147)Unmarried:
56.6% (192)
Marital status - Other race population 15 years and over
Males 57.2% Never married34.3% Now married2.6% Separated0.0% Widowed5.9% DivorcedFemales 47.0% Never married37.0% Now married3.8% Separated6.8% Widowed5.5% DivorcedWomen who gave birth in the past 12 months Now married:
61.0% (63)Unmarried:
39.0% (40)
Women who did not give birth in the past 12 months Now married:
42.4% (747)Unmarried:
57.6% (1,014)
Marital status - Two or more races population 15 years and over
Males 58.6% Never married28.8% Now married0.0% Separated0.0% Widowed12.6% DivorcedFemales 50.0% Never married34.6% Now married2.6% Separated1.6% Widowed11.2% DivorcedWomen who gave birth in the past 12 months Now married:
21.0% (49)Unmarried:
79.0% (184)
Women who did not give birth in the past 12 months Now married:
38.1% (871)Unmarried:
61.9% (1,415)
Marital status - White alone, not Hispanic / Latino population 15 years and over
Males 37.8% Never married48.8% Now married0.9% Separated1.9% Widowed10.6% DivorcedFemales 26.3% Never married45.5% Now married0.9% Separated11.4% Widowed15.9% DivorcedWomen who gave birth in the past 12 months Now married:
85.7% (200)Unmarried:
14.3% (34)
Women who did not give birth in the past 12 months Now married:
45.5% (2,537)Unmarried:
54.5% (3,037)
Marital status - Hispanic or Latino population 15 years and over
Males 56.3% Never married32.6% Now married2.7% Separated0.8% Widowed7.7% DivorcedFemales 45.2% Never married38.6% Now married2.9% Separated5.1% Widowed8.2% DivorcedWomen who gave birth in the past 12 months Now married:
94.4% (105)Unmarried:
5.6% (6)
Women who did not give birth in the past 12 months Now married:
41.4% (1,218)Unmarried:
58.6% (1,720)
Ancestries in Marietta
4,432 12.8% English1,607 4.6% American1,458 4.2% Irish1,194 3.4% German939 2.7% Jamaican842 2.4% African782 2.3% West Indian770 2.2% Nigerian589 1.7% Scottish483 1.4% European401 1.2% Haitian397 1.1% Italian355 1.0% Brazilian255 0.7% Bahamian235 0.7% Polish198 0.6% Scotch-Irish168 0.5% Iranian163 0.5% Finnish115 0.3% Eastern European114 0.3% Greek113 0.3% British108 0.3% Norwegian86 0.2% Kenyan66 0.2% Czechoslovakian64 0.2% Dutch62 0.2% Belgian62 0.2% Ethiopian62 0.2% French58 0.2% Portuguese52 0.2% Northern European51 0.1% Welsh49 0.1% Swiss42 0.1% Scandinavian40 0.1% Ukrainian38 0.1% British West Indian34 0.10% French Canadian31 0.09% Czech30 0.09% Armenian28 0.08% Maltese27 0.08% Zimbabwean25 0.07% Swedish24 0.07% Austrian22 0.06% Syrian22 0.06% Hungarian22 0.06% Trinidadian and Tobagonian20 0.06% Barbadian19 0.05% Moroccan19 0.05% Icelander17 0.05% Cajun15 0.04% Romanian14 0.04% Bulgarian13 0.04% Liberian12 0.03% Canadian12 0.03% Russian10 0.03% Pennsylvania German9 0.03% Arab9 0.03% Lithuanian8 0.02% U.S. Virgin Islander7 0.02% Palestinian7 0.02% Croatian6 0.02% Somali3 0.01% Guyanese
Geographical mobility in Marietta Same house 1 year ago 20,458 78.9% White (Caucasian)14,507 78.0% Black or African American974 89.6% American Indian / Alaska Native1,135 88.1% Asian6 100.0% Native Hawaiian / Pacific Islander6,426 88.2% Other race5,861 83.0% Two or more races19,979 79.2% White alone, not Hispanic / Latino9,951 85.4% Hispanic or LatinoMoved within same county 2,266 8.7% White / Caucasian1,272 6.8% Black or African American30 2.7% American Indian / Alaska Native85 6.6% Asian532 7.3% Other race386 5.5% Two or more races2,240 8.9% White alone, not Hispanic / Latino852 7.3% Hispanic or LatinoMoved within same state 1,707 6.6% White / Caucasian1,285 6.9% Black or African American92 8.5% American Indian / Alaska Native39 3.0% Asian100 1.4% Other race430 6.1% Two or more races1,523 6.0% White alone, not Hispanic / Latino409 3.5% Hispanic or LatinoMoved from different state 965 3.7% White / Caucasian1,368 7.4% Black or African American11 0.9% Asian117 1.6% Other race212 3.0% Two or more races964 3.8% White alone, not Hispanic / Latino254 2.2% Hispanic or LatinoMoved from abroad 97 0.4% White108 0.6% Black or African American121 1.7% Other race2 0.0% Two or more races88 0.3% White alone, not Hispanic / Latino91 0.8% Hispanic or Latino
Children Nativity (place of birth) in Marietta
Children under 6 years - Living with two parents Both parents native 1,754 100.0% NativeBoth parents foreign-born 648 90.4% Native69 9.6% Foreign-bornOne native, one foreign-born parent 425 100.0% NativeChildren under 6 years - Living with one parent Native parent 939 100.0% NativeForeign-born parent 453 77.4% Native132 22.6% Foreign-bornChildren 6 to 17 years - Living with two parents Both parents native 2,590 99.2% Native20 0.8% Foreign-bornBoth parents foreign-born 840 75.9% Native267 24.1% Foreign-bornOne native, one foreign-born parent 492 100.0% NativeChildren 6 to 17 years - Living with one parent Native parent 1,341 100.0% NativeForeign-born parent 1,416 58.4% Native1,007 41.6% Foreign-born
Grandparents responsible for own grandchildren in Marietta
Grandparents (30 to 59 years) White / Caucasian 37 100.0% Not responsible for grandchildrenBlack or African American 145 100.0% Not responsible for grandchildrenOther race 24 100.0% Not responsible for grandchildrenWhite alone, not Hispanic / Latino 43 100.0% Not responsible for grandchildrenHispanic or Latino 17 100.0% Not responsible for grandchildrenGrandparents (60 years and over) White / Caucasian 72 78.7% Responsible for grandchildren19 21.3% Not responsible for grandchildrenBlack or African American 17 9.4% Responsible for grandchildren167 90.6% Not responsible for grandchildrenOther race 16 100.0% Not responsible for grandchildrenWhite alone, not Hispanic / Latino 52 70.9% Responsible for grandchildren21 29.1% Not responsible for grandchildrenHispanic or Latino 89 100.0% Responsible for grandchildren