Macomb, IL (Illinois) Houses and Residents
| Macomb: | $109,227 |
| Illinois: | $251,600 |
Total population: 18,943 (Urban population: 18,314 (all inside urban clusters), Rural population: 179 (all nonfarm))
Houses: 7,440 (6,231 occupied: 2,865 owner occupied, 3,446 renter occupied)
| % of renters here: | 55% |
| State: | 33% |
Housing density: 755 houses/condos per square mile
Median price asked for vacant for-sale houses and condos in 2022: $68,116.
Median contract rent in 2022: $569 (lower quartile is $416, upper quartile is $796)
Median rent asked for vacant for-rent units in 2022: $700
Median gross rent in Macomb, IL in 2022: $668
Housing units in Macomb with a mortgage: 1,525 (117 second mortgage, 0 home equity loan, 92 both second mortgage and home equity loan)
Houses without a mortgage: 48
Median household income for houses/condos with a mortgage: $76,618
Median household income for apartments without a mortgage: $65,168
Median monthly housing costs: $704
Compare current foreclosures near Macomb, IL:
| Photo | Address | Area | Beds / Baths | Price | Details |
|---|---|---|---|---|---|

|
#1
W Piper St
Macomb, IL 61455
|
1,002 sq. feet
|
2 baths 2 beds |
show details | |

|
#2
Heath Ct
Macomb, IL 61455
|
1,948 sq. feet
|
2 baths 3 beds |
show details | |

|
#3
Chandler Blvd
Macomb, IL 61455
|
- sq. feet
|
1 baths 2 beds |
show details | |

|
#4
E Washington St
Macomb, IL 61455
|
- sq. feet
|
1 baths 4 beds |
show details | |

|
#5
River Run Dr
Macomb, IL 61455
|
- sq. feet
|
- baths - beds |
show details | |

|
#6
Reeveston Dr
Macomb, IL 61455
|
- sq. feet
|
- baths - beds |
show details | |

|
#7
N Albert St
Macomb, IL 61455
|
- sq. feet
|
- baths - beds |
show details | |

|
#8
S Campbell St
Macomb, IL 61455
|
- sq. feet
|
- baths - beds |
show details | |

|
#9
E Carroll St
Macomb, IL 61455
|
- sq. feet
|
- baths - beds |
show details | |

|
#10
E Grant St
Macomb, IL 61455
|
- sq. feet
|
- baths - beds |
show details |
| Photo | Address | Area | Beds / Baths | Price | Details |
|---|---|---|---|---|---|

|
#11
N Monroe St
Macomb, IL 61455
|
- sq. feet
|
- baths - beds |
show details | |

|
#12
Chandler Blvd
Macomb, IL 61455
|
- sq. feet
|
- baths - beds |
show details | |

|
#13
W Jefferson St
Macomb, IL 61455
|
- sq. feet
|
- baths - beds |
show details | |

|
#14
Stadium Dr
Macomb, IL 61455
|
- sq. feet
|
- baths - beds |
show details | |

|
#15
Debbie Ln
Macomb, IL 61455
|
- sq. feet
|
- baths - beds |
show details | |

|
#16
Jamestown Rd
Macomb, IL 61455
|
- sq. feet
|
- baths - beds |
show details | |

|
#17
Penny Ln
Macomb, IL 61455
|
- sq. feet
|
- baths - beds |
show details | |

|
#18
N Griffin St
Macomb, IL 61455
|
- sq. feet
|
- baths - beds |
show details | |

|
#19
Pinecrest Dr
Macomb, IL 61455
|
- sq. feet
|
- baths - beds |
show details | |

|
#20
W Chase St
Macomb, IL 61455
|
- sq. feet
|
- baths - beds |
show details |
| Photo | Address | Area | Beds / Baths | Price | Details |
|---|---|---|---|---|---|

|
#21
N Washington St
Bushnell, IL 61422
|
- sq. feet
|
1 baths 2 beds |
show details | |

|
#22
State Route 9
Blandinsville, IL 61420
|
- sq. feet
|
- baths - beds |
show details | |

|
#23
Lovejoy St
Colchester, IL 62326
|
- sq. feet
|
- baths - beds |
show details | |

|
#24
Front St
Bushnell, IL 61422
|
- sq. feet
|
- baths - beds |
show details | |

|
#25
S Jackson St
Bushnell, IL 61422
|
- sq. feet
|
- baths - beds |
show details | |

|
#26
N Dean St
Bushnell, IL 61422
|
- sq. feet
|
- baths - beds |
show details | |

|
Check over 1 million property listings on Foreclosure.com!
|
browse all offers | |||

Latest news about housing in Macomb, IL collected exclusively by city-data.com from local newspapers, TV, and radio stations

 | School in Macomb but where to live? (13 replies) |
| Trouble finding rental homes in Peoria Area (4 replies) |
| Macomb quality of life/WIU (0 replies) |
| Thinking of moving to Illinois (77 replies) |
| Moving to Illinois...literally anywhere but Chicago or it’s suburbs (52 replies) |
| Looking for rental in Macomb (4 replies) |

Median year apartment built: 1983
Household type by relationship:
Households: 14,997- Male householders: 2,494 (1,182 living alone), Female householders: 3,623 (1,842 living alone)
1,689 spouses (1,676 opposite-sex spouses), 431 unmarried partners, (409 opposite-sex unmarried partners), 2,752 children (2,385 natural, 268 adopted, 98 stepchildren), 115 grandchildren, 160 brothers or sisters, 149 parents, 8 foster children, 130 other relatives, 837 non-relatives
- In group quarters: 2,603
Size of family households: 1,306 2-persons, 454 3-persons, 378 4-persons, 171 5-persons, 93 6-persons, 16 7-or-more-persons.
Size of nonfamily households: 3,185 1-person, 580 2-persons, 137 3-persons, 42 4-persons, 8 6-persons.
1,332 married couples with children.
643 single-parent households (100 men, 543 women).
93.9% of residents of Macomb speak English at home.
2.4% of residents speak Spanish at home (67% speak English very well, 19% speak English well, 10% speak English not well, 4% don't speak English at all).
2.2% of residents speak other Indo-European language at home (83% speak English very well, 16% speak English well, 1% speak English not well).
0.6% of residents speak Asian or Pacific Island language at home (79% speak English very well, 21% speak English well).
0.3% of residents speak other language at home (100% speak English very well).
Foreign born population: 667 (4.4%)
(69.6% of them are naturalized citizens)
| Here: | 6.2 |
| State: | 6.4 |
| Here: | 3.7 |
| State: | 4.1 |

- Bedrooms in owner-occupied houses and condos in Macomb, Illinois
- 0no bedroom
- 481 bedroom
- 8972 bedrooms
- 1,3273 bedrooms
- 4354 bedrooms
- 1605+ bedrooms

- Bedrooms in renter-occupied apartments in Macomb, Illinois
- 278no bedroom
- 1,1241 bedroom
- 1,2382 bedrooms
- 4373 bedrooms
- 2924 bedrooms
- 775+ bedrooms

- Cars and other vehicles available in Macomb in owner-occupied houses/condos
- 72no vehicle
- 1,1861 vehicle
- 1,1622 vehicles
- 2593 vehicles
- 1214 vehicles
- 655+ vehicles

- Cars and other vehicles available in Macomb in renter-occupied apartments
- 792no vehicle
- 1,9011 vehicle
- 5942 vehicles
- 1273 vehicles
- 174 vehicles
- 155+ vehicles

- Rooms in owner-occupied houses in Macomb, Illinois
- 01 room
- 02 rooms
- 843 rooms
- 2494 rooms
- 6105 rooms
- 6846 rooms
- 3767 rooms
- 3058 rooms
- 5589+ rooms

- Rooms in renter-occupied apartments in Macomb, Illinois
- 2411 room
- 3132 rooms
- 9183 rooms
- 7864 rooms
- 5735 rooms
- 3066 rooms
- 1137 rooms
- 548 rooms
- 1429+ rooms


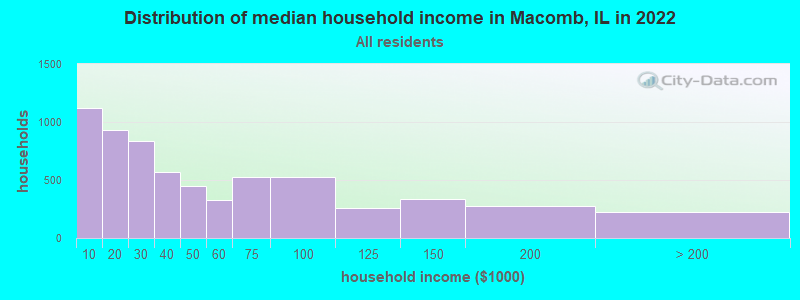
Macomb, IL household income distribution

- 1,118Less than $10,000
- 931$10,000 to $19,999
- 837$20,000 to $29,999
- 569$30,000 to $39,999
- 452$40,000 to $49,999
- 327$50,000 to $59,999
- 526$60,000 to $74,999
- 530$75,000 to $99,999
- 259$100,000 to $124,999
- 335$125,000 to $149,999
- 274$150,000 to $199,999
- 224$200,000 or more
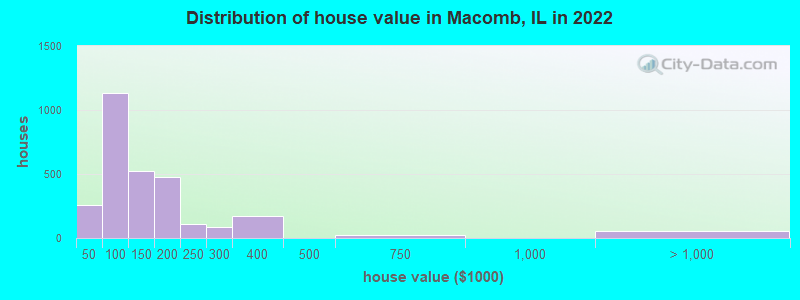
Home value of owner - occupied houses in 2022 in Macomb, IL
-
- 69Less than $10,000
- 31$20,000 to $24,999
- 19$25,000 to $29,999
- 64$30,000 to $34,999
- 9$35,000 to $39,999
- 60$40,000 to $49,999
- 112$50,000 to $59,999
- 162$60,000 to $69,999
- 313$70,000 to $79,999
- 264$80,000 to $89,999
- 215$90,000 to $99,999
- 324$100,000 to $124,999
- 199$125,000 to $149,999
- 349$150,000 to $174,999
- 123$175,000 to $199,999
- 111$200,000 to $249,999
- 85$250,000 to $299,999
- 168$300,000 to $399,999
- 23$500,000 to $749,999
- 57$1,000,000 to $1,499,999
Rent paid by renters in 2022 in Macomb, IL
-
- 47Less than $100
- 11$100 to $149
- 179$150 to $199
- 164$200 to $249
- 83$250 to $299
- 124$300 to $349
- 90$350 to $399
- 373$400 to $449
- 259$450 to $499
- 281$500 to $549
- 151$550 to $599
- 368$600 to $649
- 137$650 to $699
- 96$700 to $749
- 198$750 to $799
- 305$800 to $899
- 110$900 to $999
- 246$1,000 to $1,249
- 21$1,250 to $1,499
- 66$1,500 to $1,999
- 33$2,000 to $2,499
- 12$2,500 to $2,999
- 10$3,000 to $3,499
- 30$3,500 or more
- 90No cash rent


Percentage of workers working in this county: 89.7%
Number of people working at home: 359 (5.4% of all workers)
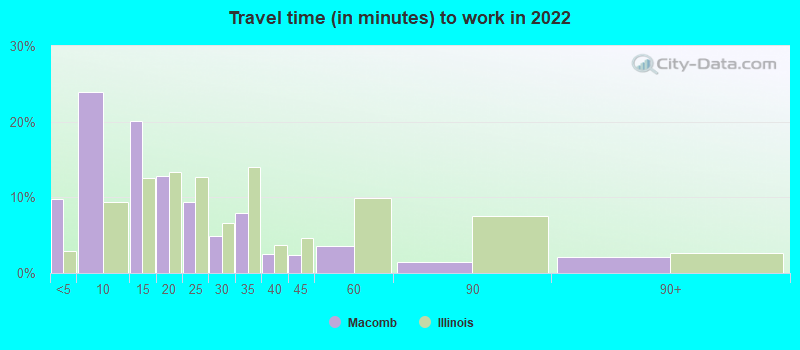
Travel time to work (commute)
- Less than 5 minutes: 882
- 5 to 9 minutes: 2,186
- 10 to 14 minutes: 1,459
- 15 to 19 minutes: 461
- 20 to 24 minutes: 185
- 25 to 29 minutes: 80
- 30 to 34 minutes: 226
- 35 to 39 minutes: 56
- 40 to 44 minutes: 135
- 45 to 59 minutes: 224
- 60 to 89 minutes: 135
- 90 or more minutes: 120
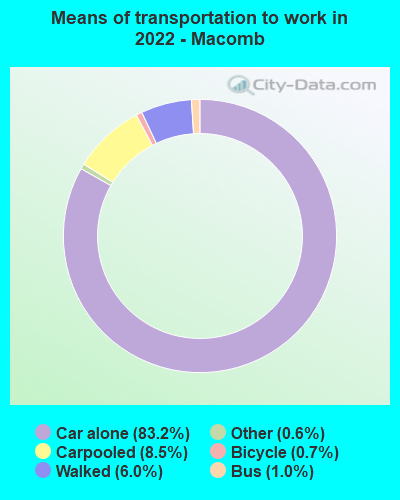
Means of transportation to work:
- Drove a car alone: 7,882 (78.0%)
- Carpooled: 859 (8.5%)
- Bus: 85 (0.8%)
- Taxi: 64 (0.6%)
- Bicycle: 69 (0.7%)
- Walked: 583 (5.8%)
- Worked at home: 359 (3.6%)

- Unemployment by race in 2022
- Unemployment rate for White non-Hispanic residents
- 10.6%Males
- 6.1%Females
- Unemployment rate for Black residents
- 38.0%Males
- 4.8%Females
- Unemployment rate for other race residents
- 34.1%Females
- Unemployment rate for two or more race residents
- 15.7%Females
- Unemployment rate for Hispanic or Latino residents
- 26.7%Females

- Year of entry for the foreign-born population in Macomb, Illinois
- 2452010 or later
- 1142000 to 2009
- 2311990 to 1999
- 981980 to 1989
- 421970 to 1979
- 55Before 1970
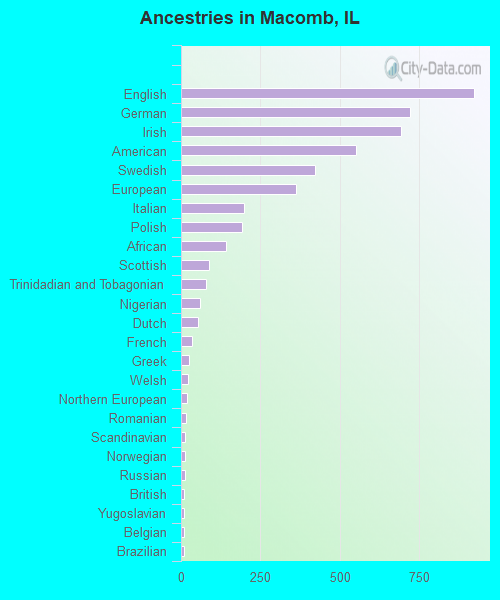
First ancestries reported:
- English: 925 (14.5%)
- German: 723 (11.3%)
- Irish: 694 (10.9%)
- American: 552 (8.7%)
- Swedish: 423 (6.6%)
- European: 362 (5.7%)
- Italian: 200 (3.1%)
- Polish: 193 (3.0%)
- African: 141 (2.2%)
- Scottish: 87 (1.4%)
- Trinidadian and Tobagonian: 78 (1.2%)
- Nigerian: 61 (1.0%)
- Dutch: 53 (0.8%)
- French: 35 (0.5%)
- Greek: 25 (0.4%)
- Welsh: 23 (0.4%)
- Northern European: 20 (0.3%)
- Romanian: 15 (0.2%)
- Scandinavian: 14 (0.2%)
- Norwegian: 13 (0.2%)
- Russian: 13 (0.2%)
- British: 11 (0.2%)
- Yugoslavian: 11 (0.2%)
- Belgian: 9 (0.1%)
- Brazilian: 9 (0.1%)
- French Canadian: 9 (0.1%)
- Croatian: 7 (0.1%)
- Scotch-Irish: 7 (0.1%)
- Swiss: 7 (0.1%)
- Barbadian: 6 (0.09%)
- Finnish: 5 (0.08%)
Most common places of birth for foreign-born residents (%):
| Macomb: | 24.1% (161) |
| Illinois: | 9.2% (166,409) |
| Macomb: | 15.1% (101) |
| Illinois: | 0.1% (1,224) |
| Macomb: | 11.4% (76) |
| Illinois: | 1.2% (21,186) |
| Macomb: | 8.7% (58) |
| Illinois: | 34.7% (626,958) |
| Macomb: | 7.0% (47) |
| Illinois: | 4.1% (74,364) |
| Macomb: | 5.8% (39) |
| Illinois: | 0.5% (8,235) |
| Macomb: | 5.8% (39) |
| Illinois: | 1.6% (29,519) |
| Macomb: | 5.8% (39) |
| Illinois: | 5.2% (93,003) |
| Macomb: | 2.1% (14) |
| Illinois: | 0.1% (2,070) |
| Macomb: | 1.9% (13) |
| Illinois: | 1.0% (18,753) |
| Macomb: | 1.9% (13) |
| Illinois: | 0.8% (14,736) |
| Macomb: | 1.6% (11) |
| Illinois: | 0.2% (3,256) |
| Macomb: | 1.6% (11) |
| Illinois: | 6.9% (124,474) |
| Macomb: | 1.6% (11) |
| Illinois: | 1.3% (22,793) |
Place of birth for U.S.-born residents:
- This state: 10,500
- Other state: 3,650
- Northeast: 379
- Midwest: 2,056
- South: 815
- West: 404
64.3% of Macomb residents lived in the same house 1 years ago.
Out of people who lived in different houses, 30.6% lived in this county.
Out of people who lived in different counties, 75.3% lived in Illinois.
| Macomb: | 64.3% |
| State average: | 88.3% |
Education attainment for males 25 years and older:
- No schooling: 36
- Nursery to 4th grade: 0
- 5th and 6th grade: 10
- 7th and 8th grade: 0
- 9th grade: 0
- 10th grade: 25
- 11th grade: 24
- 12th grade, no diploma: 49
- High school graduate (or equivalency): 1,143
- Less than 1 year of college: 232
- Some college more than 1 year, no degree: 623
- Associate degree: 249
- Bachelor's degree: 673
- Master's degree: 402
- Professional school degree: 20
- Doctorate degree: 313

Education attainment for females 25 years and older:
- No schooling: 62
- Nursery to 4th grade: 37
- 5th and 6th grade: 0
- 7th and 8th grade: 16
- 9th grade: 14
- 10th grade: 39
- 11th grade: 36
- 12th grade, no diploma: 43
- High school graduate (or equivalency): 1,204
- Less than 1 year of college: 254
- Some college more than 1 year, no degree: 469
- Associate degree: 486
- Bachelor's degree: 729
- Master's degree: 773
- Professional school degree: 79
- Doctorate degree: 108


Housing units in structures:
- One, detached: 3,702
- One, attached: 309
- Two: 234
- 3 or 4: 577
- 5 to 9: 748
- 10 to 19: 704
- 20 to 49: 148
- 50 or more: 712
- Mobile homes: 297
- Boats, RVs, vans, etc.: 6
Median worth of mobile homes: $12,126
Housing units lacking complete kitchen facilities in 2022: 2.9%
House/condo owner moved in on average 12 years ago
Renter moved in on average 1 years ago

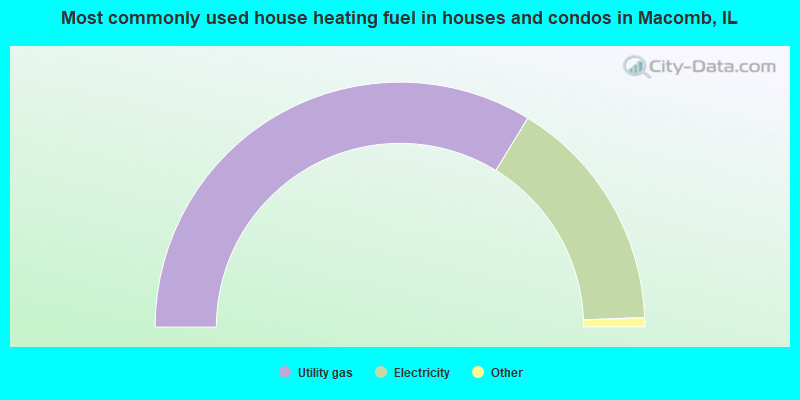
- 67.5%Utility gas
- 31.3%Electricity
- 1.0%Bottled, tank, or LP gas
- 0.2%Other fuel
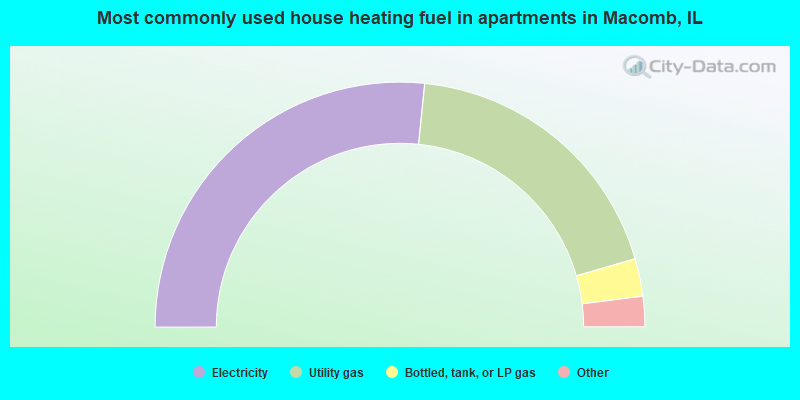
- 53.3%Electricity
- 37.8%Utility gas
- 5.0%Bottled, tank, or LP gas
- 2.8%Other fuel
- 1.1%No fuel used
Private vs. public school enrollment:
| Here: | 18.9% |
| Illinois: | 13.3% |
| Here: | 0.0% |
| Illinois: | 9.9% |
| Here: | 1.0% |
| Illinois: | 27.4% |


