Races in Macomb, Illinois (IL) Detailed Stats
Data:
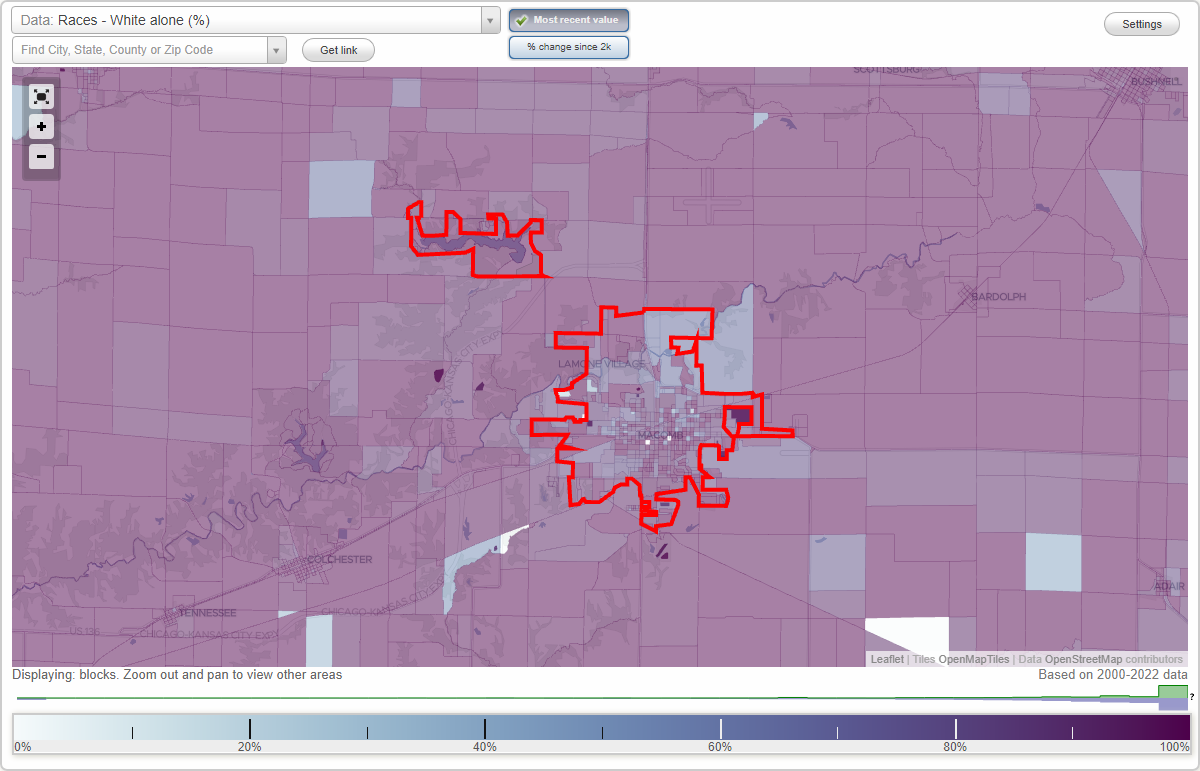
Races - White alone (%)
Races - White alone (% change since 2000)
Races - Black alone (%)
Races - Black alone (% change since 2000)
Races - American Indian alone (%)
Races - American Indian alone (% change since 2000)
Races - Asian alone (%)
Races - Asian alone (% change since 2000)
Races - Hispanic (%)
Races - Hispanic (% change since 2000)
Races - Native Hawaiian and Other Pacific Islander alone (%)
Races - Native Hawaiian and Other Pacific Islander alone (% change since 2000)
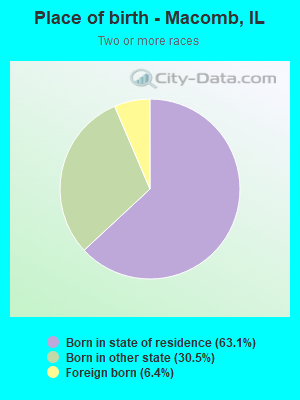
Races - Two or more races(%)
Races - Two or more races(% change since 2000)
Races - Other race alone (%)
Races - Other race alone (% change since 2000)
Racial diversity
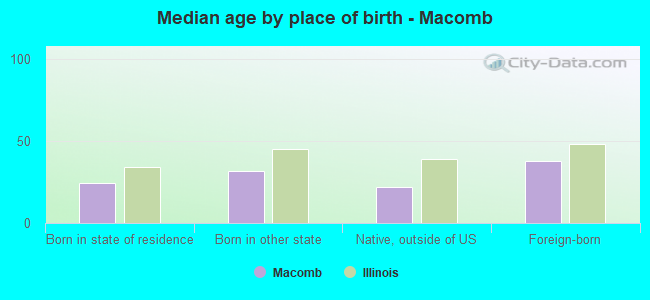
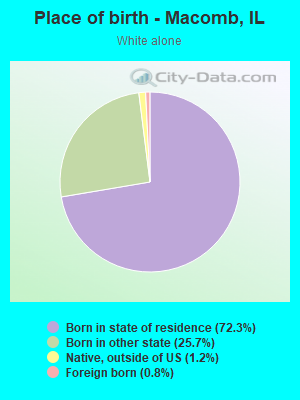
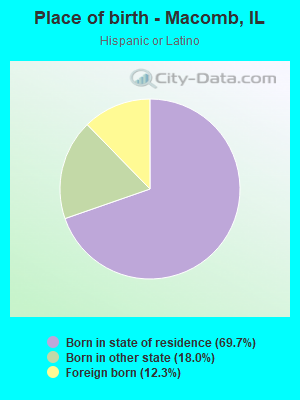
Place of birth - Born in state of residence (%)
Place of birth - Born in state of residence (%) - White
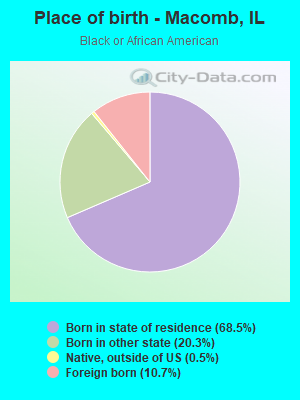
Place of birth - Born in state of residence (%) - Black or African American
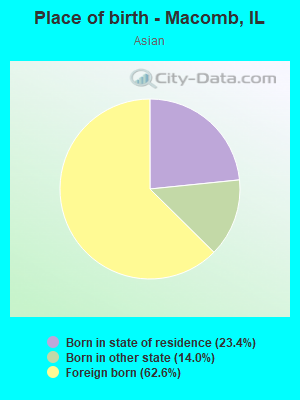
Place of birth - Born in state of residence (%) - Asian
Place of birth - Born in state of residence (%) - Hispanic or Latino
Place of birth - Born in state of residence (%) - American Indian and Alaska Native
Place of birth - Born in state of residence (%) - Multirace
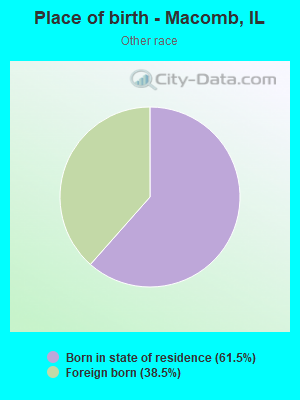
Place of birth - Born in state of residence (%) - Other Race
Place of birth - Born in other state (%)
Place of birth - Born in other state (%) - White
Place of birth - Born in other state (%) - Black or African American
Place of birth - Born in other state (%) - Asian
Place of birth - Born in other state (%) - Hispanic or Latino
Place of birth - Born in other state (%) - American Indian and Alaska Native
Place of birth - Born in other state (%) - Multirace
Place of birth - Born in other state (%) - Other Race
Place of birth - Native, outside of US (%)
Place of birth - Native, outside of US (%) - White
Place of birth - Native, outside of US (%) - Black or African American
Place of birth - Native, outside of US (%) - Asian
Place of birth - Native, outside of US (%) - Hispanic or Latino
Place of birth - Native, outside of US (%) - American Indian and Alaska Native
Place of birth - Native, outside of US (%) - Multirace
Place of birth - Native, outside of US (%) - Other Race
Place of birth - Foreign born (%)
Place of birth - Foreign born (%) - White
Place of birth - Foreign born (%) - Black or African American
Place of birth - Foreign born (%) - Asian
Place of birth - Foreign born (%) - Hispanic or Latino
Place of birth - Foreign born (%) - American Indian and Alaska Native
Place of birth - Foreign born (%) - Multirace
Place of birth - Foreign born (%) - Other Race
Residents speaking English at home (%)
Residents speaking English at home - Born in the United States (%)
Residents speaking English at home - Native, born elsewhere (%)
Residents speaking English at home - Foreign born (%)
Residents speaking Spanish at home (%)
Residents speaking Spanish at home - Born in the United States (%)
Residents speaking Spanish at home - Native, born elsewhere (%)
Residents speaking Spanish at home - Foreign born (%)
Residents speaking other language at home (%)
Residents speaking other language at home - Born in the United States (%)
Residents speaking other language at home - Native, born elsewhere (%)
Residents speaking other language at home - Foreign born (%)
Marital status - Never married (%)
Marital status - Now married (%)
Marital status - Separated (%)
Marital status - Widowed (%)
Marital status - Divorced (%)
Ancestries Reported - Arab (%)
Ancestries Reported - Czech (%)
Ancestries Reported - Danish (%)
Ancestries Reported - Dutch (%)
Ancestries Reported - English (%)
Ancestries Reported - French (%)
Ancestries Reported - French Canadian (%)
Ancestries Reported - German (%)
Ancestries Reported - Greek (%)
Ancestries Reported - Hungarian (%)
Ancestries Reported - Irish (%)
Ancestries Reported - Italian (%)
Ancestries Reported - Lithuanian (%)
Ancestries Reported - Norwegian (%)
Ancestries Reported - Polish (%)
Ancestries Reported - Portuguese (%)
Ancestries Reported - Russian (%)
Ancestries Reported - Scotch-Irish (%)
Ancestries Reported - Scottish (%)
Ancestries Reported - Slovak (%)
Ancestries Reported - Subsaharan African (%)
Ancestries Reported - Swedish (%)
Ancestries Reported - Swiss (%)
Ancestries Reported - Ukrainian (%)
Ancestries Reported - United States (%)
Ancestries Reported - Welsh (%)
Ancestries Reported - West Indian (%)
Ancestries Reported - Other (%)
Geographical mobility - Same house 1 year ago (%)
Geographical mobility - Same house 1 year ago (%) - White
Geographical mobility - Same house 1 year ago (%) - Black or African American
Geographical mobility - Same house 1 year ago (%) - Asian
Geographical mobility - Same house 1 year ago (%) - Hispanic or Latino
Geographical mobility - Same house 1 year ago (%) - American Indian and Alaska Native
Geographical mobility - Same house 1 year ago (%) - Multirace
Geographical mobility - Same house 1 year ago (%) - Other Race
Geographical mobility - Moved within same county (%)
Geographical mobility - Moved within same county (%) - White
Geographical mobility - Moved within same county (%) - Black or African American
Geographical mobility - Moved within same county (%) - Asian
Geographical mobility - Moved within same county (%) - Hispanic or Latino
Geographical mobility - Moved within same county (%) - American Indian and Alaska Native
Geographical mobility - Moved within same county (%) - Multirace
Geographical mobility - Moved within same county (%) - Other Race
Geographical mobility - Moved from different county within same state (%)
Geographical mobility - Moved from different county within same state (%) - White
Geographical mobility - Moved from different county within same state (%) - Black or African American
Geographical mobility - Moved from different county within same state (%) - Asian
Geographical mobility - Moved from different county within same state (%) - Hispanic or Latino
Geographical mobility - Moved from different county within same state (%) - American Indian and Alaska Native
Geographical mobility - Moved from different county within same state (%) - Multirace
Geographical mobility - Moved from different county within same state (%) - Other Race
Geographical mobility - Moved from different state (%)
Geographical mobility - Moved from different state (%) - White
Geographical mobility - Moved from different state (%) - Black or African American
Geographical mobility - Moved from different state (%) - Asian
Geographical mobility - Moved from different state (%) - Hispanic or Latino
Geographical mobility - Moved from different state (%) - American Indian and Alaska Native
Geographical mobility - Moved from different state (%) - Multirace
Geographical mobility - Moved from different state (%) - Other Race
Geographical mobility - Moved from abroad (%)
Geographical mobility - Moved from abroad (%) - White
Geographical mobility - Moved from abroad (%) - Black or African American
Geographical mobility - Moved from abroad (%) - Asian
Geographical mobility - Moved from abroad (%) - Hispanic or Latino
Geographical mobility - Moved from abroad (%) - American Indian and Alaska Native
Geographical mobility - Moved from abroad (%) - Multirace
Geographical mobility - Moved from abroad (%) - Other Race
Place of birth for the foreign-born population - Ireland (%)
Place of birth for the foreign-born population - Denmark (%)
Place of birth for the foreign-born population - Norway (%)
Place of birth for the foreign-born population - Sweden (%)
Place of birth for the foreign-born population - United Kingdom (%)
Place of birth for the foreign-born population - England (%)
Place of birth for the foreign-born population - Scotland (%)
Place of birth for the foreign-born population - Other Northern Europe (%)
Place of birth for the foreign-born population - Austria (%)
Place of birth for the foreign-born population - Belgium (%)
Place of birth for the foreign-born population - France (%)
Place of birth for the foreign-born population - Germany (%)
Place of birth for the foreign-born population - Netherlands (%)
Place of birth for the foreign-born population - Switzerland (%)
Place of birth for the foreign-born population - Other Western Europe (%)
Place of birth for the foreign-born population - Greece (%)
Place of birth for the foreign-born population - Italy (%)
Place of birth for the foreign-born population - Portugal (%)
Place of birth for the foreign-born population - Spain (%)
Place of birth for the foreign-born population - Other Southern Europe (%)
Place of birth for the foreign-born population - Albania (%)
Place of birth for the foreign-born population - Belarus (%)
Place of birth for the foreign-born population - Bosnia and Herzegovina (%)
Place of birth for the foreign-born population - Bulgaria (%)
Place of birth for the foreign-born population - Croatia (%)
Place of birth for the foreign-born population - Czechoslovakia (%)
Place of birth for the foreign-born population - Hungary (%)
Place of birth for the foreign-born population - Latvia (%)
Place of birth for the foreign-born population - Lithuania (%)
Place of birth for the foreign-born population - North Macedonia (Macedonia) (%)
Place of birth for the foreign-born population - Moldova (%)
Place of birth for the foreign-born population - Poland (%)
Place of birth for the foreign-born population - Romania (%)
Place of birth for the foreign-born population - Russia (%)
Place of birth for the foreign-born population - Serbia (%)
Place of birth for the foreign-born population - Ukraine (%)
Place of birth for the foreign-born population - Other Eastern Europe (%)
Place of birth for the foreign-born population - China (%)
Place of birth for the foreign-born population - Hong Kong (%)
Place of birth for the foreign-born population - Taiwan (%)
Place of birth for the foreign-born population - Japan (%)
Place of birth for the foreign-born population - Korea (%)
Place of birth for the foreign-born population - Other Eastern Asia (%)
Place of birth for the foreign-born population - Afghanistan (%)
Place of birth for the foreign-born population - Bangladesh (%)
Place of birth for the foreign-born population - India (%)
Place of birth for the foreign-born population - Iran (%)
Place of birth for the foreign-born population - Kazakhstan (%)
Place of birth for the foreign-born population - Nepal (%)
Place of birth for the foreign-born population - Pakistan (%)
Place of birth for the foreign-born population - Sri Lanka (%)
Place of birth for the foreign-born population - Uzbekistan (%)
Place of birth for the foreign-born population - Other South Central Asia (%)
Place of birth for the foreign-born population - Burma (%)
Place of birth for the foreign-born population - Cambodia (%)
Place of birth for the foreign-born population - Indonesia (%)
Place of birth for the foreign-born population - Laos (%)
Place of birth for the foreign-born population - Malaysia (%)
Place of birth for the foreign-born population - Philippines (%)
Place of birth for the foreign-born population - Singapore (%)
Place of birth for the foreign-born population - Thailand (%)
Place of birth for the foreign-born population - Vietnam (%)
Place of birth for the foreign-born population - Other South Eastern Asia (%)
Place of birth for the foreign-born population - Armenia (%)
Place of birth for the foreign-born population - Iraq (%)
Place of birth for the foreign-born population - Israel (%)
Place of birth for the foreign-born population - Jordan (%)
Place of birth for the foreign-born population - Kuwait (%)
Place of birth for the foreign-born population - Lebanon (%)
Place of birth for the foreign-born population - Saudi Arabia (%)
Place of birth for the foreign-born population - Syria (%)
Place of birth for the foreign-born population - Turkey (%)
Place of birth for the foreign-born population - Yemen (%)
Place of birth for the foreign-born population - Other Western Asia (%)
Place of birth for the foreign-born population - Eritrea (%)
Place of birth for the foreign-born population - Ethiopia (%)
Place of birth for the foreign-born population - Kenya (%)
Place of birth for the foreign-born population - Somalia (%)
Place of birth for the foreign-born population - Uganda (%)
Place of birth for the foreign-born population - Zimbabwe (%)
Place of birth for the foreign-born population - Other Eastern Africa (%)
Place of birth for the foreign-born population - Cameroon (%)
Place of birth for the foreign-born population - Congo (%)
Place of birth for the foreign-born population - Democratic Republic of Congo (Zaire) (%)
Place of birth for the foreign-born population - Other Middle Africa (%)
Place of birth for the foreign-born population - Egypt (%)
Place of birth for the foreign-born population - Morocco (%)
Place of birth for the foreign-born population - Sudan (%)
Place of birth for the foreign-born population - Other Northern Africa (%)
Place of birth for the foreign-born population - South Africa (%)
Place of birth for the foreign-born population - Other Southern Africa (%)
Place of birth for the foreign-born population - Cabo Verde (%)
Place of birth for the foreign-born population - Ghana (%)
Place of birth for the foreign-born population - Liberia (%)
Place of birth for the foreign-born population - Nigeria (%)
Place of birth for the foreign-born population - Senegal (%)
Place of birth for the foreign-born population - Sierra Leone (%)
Place of birth for the foreign-born population - Other Western Africa (%)
Place of birth for the foreign-born population - Australia (%)
Place of birth for the foreign-born population - New Zealand (%)
Place of birth for the foreign-born population - Fiji (%)
Place of birth for the foreign-born population - Micronesia (%)
Place of birth for the foreign-born population - Bahamas (%)
Place of birth for the foreign-born population - Barbados (%)
Place of birth for the foreign-born population - Cuba (%)
Place of birth for the foreign-born population - Dominica (%)
Place of birth for the foreign-born population - Dominican Republic (%)
Place of birth for the foreign-born population - Grenada (%)
Place of birth for the foreign-born population - Haiti (%)
Place of birth for the foreign-born population - Jamaica (%)
Place of birth for the foreign-born population - St. Vincent and the Grenadines (%)
Place of birth for the foreign-born population - Trinidad and Tobago (%)
Place of birth for the foreign-born population - West Indies (%)
Place of birth for the foreign-born population - Other Caribbean (%)
Place of birth for the foreign-born population - Belize (%)
Place of birth for the foreign-born population - Costa Rica (%)
Place of birth for the foreign-born population - El Salvador (%)
Place of birth for the foreign-born population - Guatemala (%)
Place of birth for the foreign-born population - Honduras (%)
Place of birth for the foreign-born population - Mexico (%)
Place of birth for the foreign-born population - Nicaragua (%)
Place of birth for the foreign-born population - Panama (%)
Place of birth for the foreign-born population - Other Central America (%)
Place of birth for the foreign-born population - Argentina (%)
Place of birth for the foreign-born population - Bolivia (%)
Place of birth for the foreign-born population - Brazil (%)
Place of birth for the foreign-born population - Chile (%)
Place of birth for the foreign-born population - Colombia (%)
Place of birth for the foreign-born population - Ecuador (%)
Place of birth for the foreign-born population - Guyana (%)
Place of birth for the foreign-born population - Peru (%)
Place of birth for the foreign-born population - Uruguay (%)
Place of birth for the foreign-born population - Venezuela (%)
Place of birth for the foreign-born population - Other South America (%)
Place of birth for the foreign-born population - Canada (%)
Place of birth for the foreign-born population - Other Northern America (%)
Place of birth for the foreign-born population - Other (%)
Latest news about races in Macomb, IL collected exclusively by city-data.com from local newspapers, TV, and radio stations
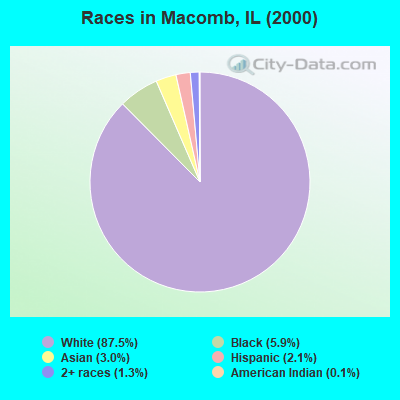
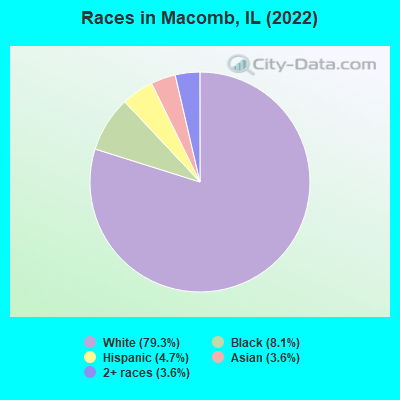
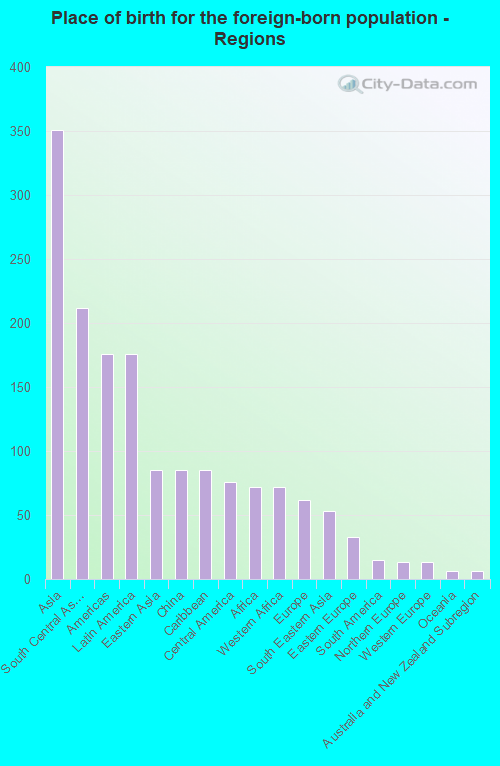
According to 2022 data, the most numerous races in Macomb, IL are White alone (11,895 residents), Hispanic (700 residents), and Black alone (1,215 residents). 94.1% of Macomb residents speak English at home. 4.4% of Macomb, IL residents are foreign-born (2.3% born in Asia, 1.2% born in Latin America, 0.5% born in Africa), which is 214.8% less than the foreign-born rate of 14.0% across the entire state of Illinois.
Race distribution in Macomb
2000 2022
8,424,140 67.8% White alone 1,856,152 14.9% Black alone 1,530,262 12.3% Hispanic 419,916 3.4% Asian alone 153,996 1.2% Two or more races 13,479 0.1% Other race alone 18,232 0.1% American Indian alone 3,116 0.03% Native Hawaiian and Other
7,356,301 58.5% White alone 2,299,726 18.3% Hispanic 1,660,423 13.2% Black alone 747,296 5.9% Asian alone 458,599 3.6% Two or more races 45,386 0.4% Other race alone 10,405 0.08% American Indian alone 3,896 0.03% Native Hawaiian and Other
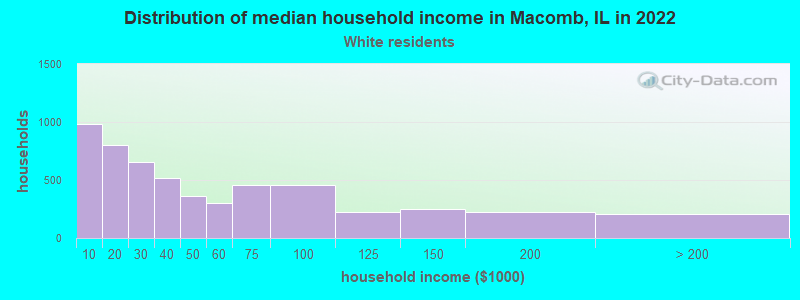
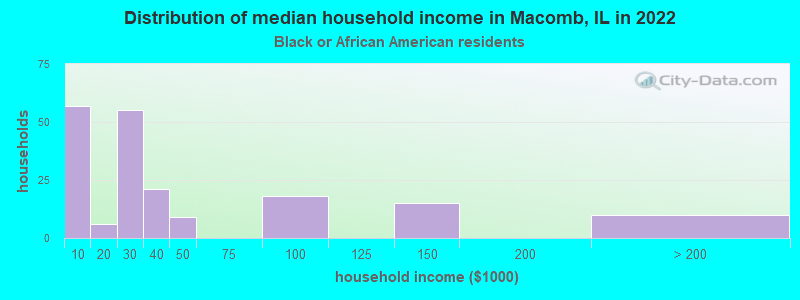
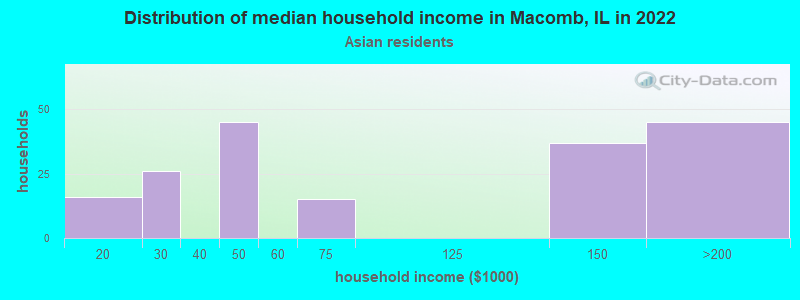
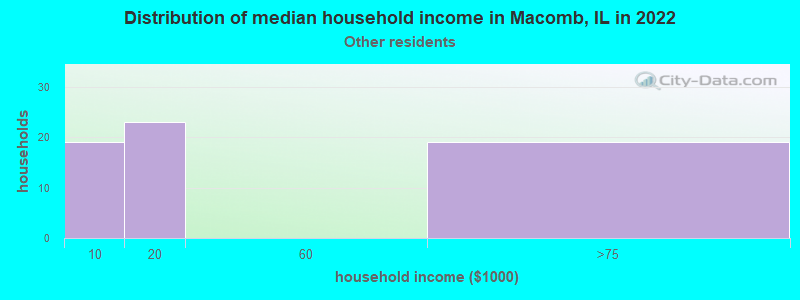
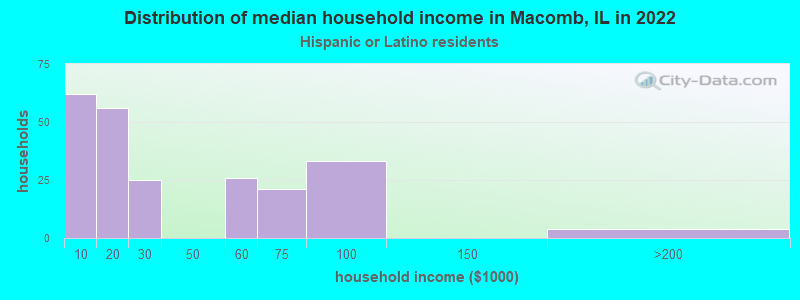
Income and house value in Macomb Median household income in 2022 $33,496 White non-Hispanic householders$26,371 Black householders$25,794 Hispanic or Latino race householdersMedian 2022 house value $113,648 White Non-Hispanic householders$98,254 Black or African American householders$28,657 American Indian or Alaska Native householders $167,196 Asian householders$61,409 Some other race householders$80,568 Two or more races householders$195,527 Hispanic or Latino householders
Median age by race in Macomb
32.6 Median age for White residents30.7 33.7 20.3 Median age for Black or African American residents21.1 20.2 -696,696,696.0 Median age for American Indian / Alaska Native residents-720,238,094.5 -688,956,432.9 28.1 Median age for Asian residents27.5 33.3 -593,236,714.4 Median age for Native Hawaiian / Pacific Islander residents-658,536,584.7 -576,015,108.0 21.7 Median age for Other race residents22.4 21.4 23.3 Median age for Two or more races residents20.6 34.0 32.8 Median age for White alone residents31.8 33.7 21.2 Median age for Hispanic or Latino residents21.8 20.8
Owner/renter occupied households by race in Macomb
House owners and renters - White residents 2,544 48.1% Owner occupied2,750 51.9% Renter occupiedHouse owners and renters - Black or African American residents 51 25.5% Owner occupied147 74.5% Renter occupiedHouse owners and renters - American Indian / Alaska Native residents 4 100.0% Renter occupiedHouse owners and renters - Asian residents 91 48.3% Owner occupied98 51.7% Renter occupiedHouse owners and renters - Other race residents 51 100.0% Renter occupiedHouse owners and renters - Two or more races residents 97 32.2% Owner occupied204 67.8% Renter occupiedHouse owners and renters - White alone residents 2,608 47.9% Owner occupied2,836 52.1% Renter occupiedHouse owners and renters - Hispanic or Latino residents 10 4.7% Owner occupied199 95.3% Renter occupied
Language usage in Macomb
English speakers - Total 94.1% of residents of Macomb speak English at home.
2.4% of residents speak Spanish at home 237 67.1% Speak English very well116 32.9% Speak English less than very well3.1% of residents speak other language at home 376 83.6% Speak English very well74 16.4% Speak English less than very well
English speakers - Born in the United States 97.7% of residents of Macomb speak English at home.
1.2% of residents speak Spanish at home 23 54.8% Speak English very well19 45.2% Speak English less than very well0.8% of residents speak other language at home 22 75.9% Speak English very well7 24.1% Speak English less than very well
All residents speak only English at home
English speakers - Foreign-born 39.8% of residents of Macomb speak English at home.
9.6% of residents speak Spanish at home 24 38.7% Speak English very well38 61.3% Speak English less than very well48.1% of residents speak other language at home 247 79.7% Speak English very well63 20.3% Speak English less than very well
White (Caucasian) - Speak only English Native:
100.0% (11,385)Foreign-born:
49.7% (40)
White (Caucasian) - Speak another language Native:
1.3% (144)Foreign-born:
54.1% (43)
Black or African American - Speak only English Native:
99.1% (1,090)Foreign-born:
84.3% (95)
Black or African American - Speak another language Native:
0.9% (10)Foreign-born:
23.2% (26)
Asian - Speak only English Native:
67.6% (139)Foreign-born:
29.3% (98)
Asian - Speak another language Native:
31.9% (66)Foreign-born:
67.8% (228)
Other race - Speak only English Native:
58.4% (46)Foreign-born:
26.5% (13)
Other race - Speak another language Native:
44.8% (36)Foreign-born:
73.8% (36)
Two or more races - Speak only English Native:
78.6% (580)Foreign-born:
26.9% (16)
Two or more races - Speak another language Native:
20.5% (151)Foreign-born:
72.1% (42)
White alone - Speak only English Native:
98.7% (11,343)Foreign-born:
47.4% (43)
White alone - Speak another language Native:
1.3% (147)Foreign-born:
49.8% (46)
Hispanic or Latino - Speak only English Native:
67.3% (392)Foreign-born:
25.2% (22)
Hispanic or Latino - Speak another language Native:
34.2% (199)Foreign-born:
74.2% (64)
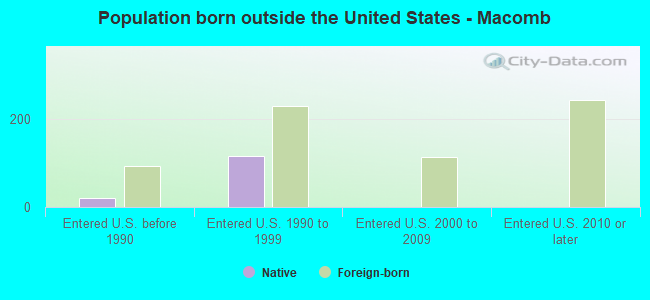
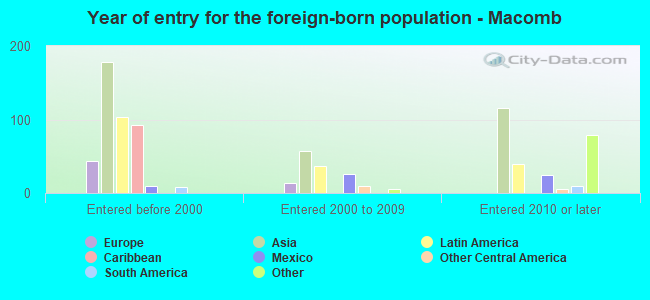
Foreign-born residents in Macomb 667 residents are foreign born (2.3% Asia , 1.2% Latin America , 0.5% Africa ).
This city:
4.4%Illinois:
14.1%
Marital status for residents in Macomb Marital status - White (Caucasian) population 15 years and over
Males 50.8% Never married34.1% Now married1.8% Separated2.9% Widowed10.4% DivorcedFemales 49.2% Never married25.0% Now married1.5% Separated13.3% Widowed11.0% DivorcedWomen who gave birth in the past 12 months Now married:
40.9% (8)Unmarried:
59.1% (12)
Women who did not give birth in the past 12 months Now married:
20.8% (659)Unmarried:
79.2% (2,508)
Marital status - Black or African American population 15 years and over
Males 85.2% Never married12.4% Now married2.4% Separated0.0% Widowed0.0% DivorcedFemales 78.4% Never married15.7% Now married0.1% Separated4.2% Widowed1.6% DivorcedWomen who did not give birth in the past 12 months Now married:
12.8% (76)Unmarried:
87.2% (516)
Marital status - Asian population 15 years and over
Males 41.9% Never married58.1% Now married0.0% Separated0.0% Widowed0.0% DivorcedFemales 47.3% Never married46.8% Now married0.0% Separated0.0% Widowed5.9% DivorcedWomen who did not give birth in the past 12 months Now married:
43.2% (81)Unmarried:
56.8% (106)
Marital status - Other race population 15 years and over
Males 68.9% Never married31.1% Now married0.0% Separated0.0% Widowed0.0% DivorcedFemales 87.5% Never married12.5% Now married0.0% Separated0.0% Widowed0.0% DivorcedWomen who did not give birth in the past 12 months Now married:
12.5% (7)Unmarried:
87.5% (49)
Marital status - Two or more races population 15 years and over
Males 72.7% Never married16.8% Now married6.8% Separated1.9% Widowed1.9% DivorcedFemales 59.3% Never married27.7% Now married0.0% Separated10.7% Widowed2.3% DivorcedWomen who did not give birth in the past 12 months Now married:
25.2% (87)Unmarried:
74.8% (259)
Marital status - White alone, not Hispanic / Latino population 15 years and over
Males 49.5% Never married34.9% Now married1.9% Separated3.0% Widowed10.7% DivorcedFemales 48.2% Never married25.5% Now married1.5% Separated13.6% Widowed11.3% DivorcedWomen who gave birth in the past 12 months Now married:
40.9% (9)Unmarried:
59.1% (12)
Women who did not give birth in the past 12 months Now married:
21.5% (701)Unmarried:
78.5% (2,558)
Marital status - Hispanic or Latino population 15 years and over
Males 84.4% Never married14.1% Now married0.0% Separated1.1% Widowed0.4% DivorcedFemales 79.1% Never married9.1% Now married0.0% Separated9.4% Widowed2.4% DivorcedWomen who did not give birth in the past 12 months Now married:
7.0% (18)Unmarried:
93.0% (241)
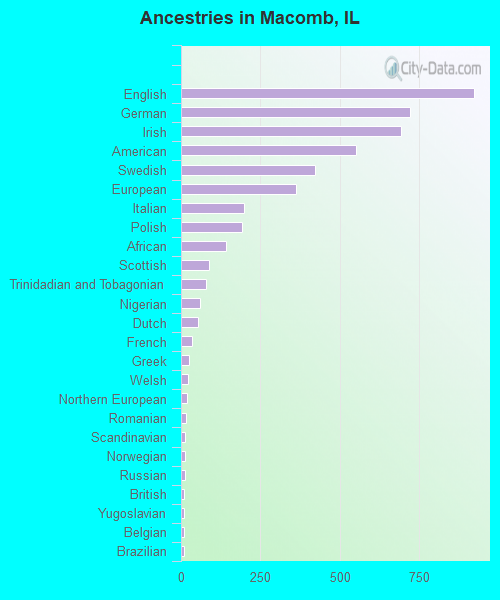
Ancestries in Macomb
925 14.5% English723 11.3% German694 10.9% Irish552 8.7% American423 6.6% Swedish362 5.7% European200 3.1% Italian193 3.0% Polish141 2.2% African87 1.4% Scottish78 1.2% Trinidadian and Tobagonian61 1.0% Nigerian53 0.8% Dutch35 0.5% French25 0.4% Greek23 0.4% Welsh20 0.3% Northern European15 0.2% Romanian14 0.2% Scandinavian13 0.2% Norwegian13 0.2% Russian11 0.2% British11 0.2% Yugoslavian9 0.1% Belgian9 0.1% Brazilian9 0.1% French Canadian7 0.1% Croatian7 0.1% Scotch-Irish7 0.1% Swiss6 0.09% Barbadian5 0.08% Finnish
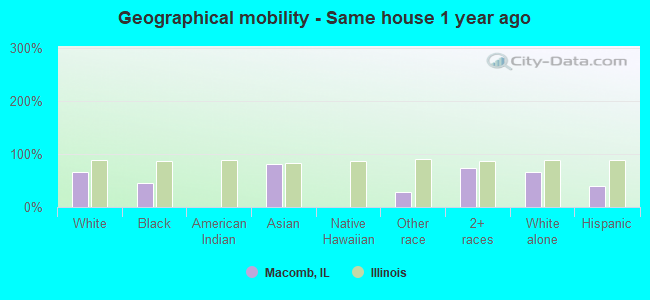
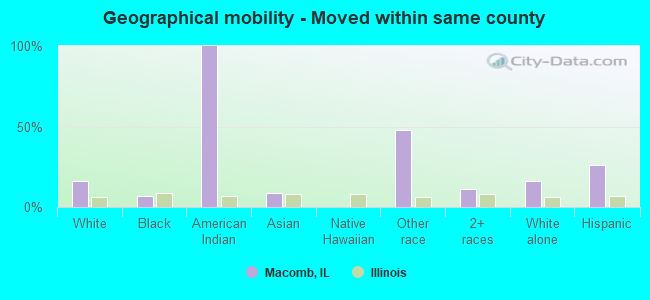
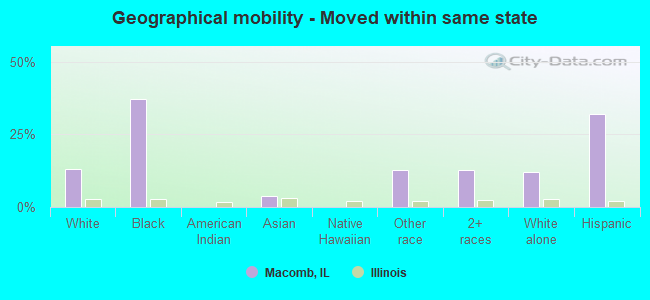
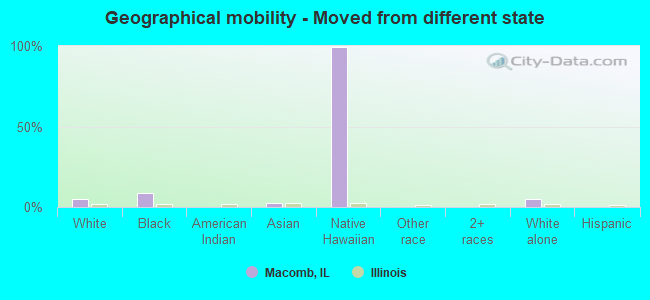
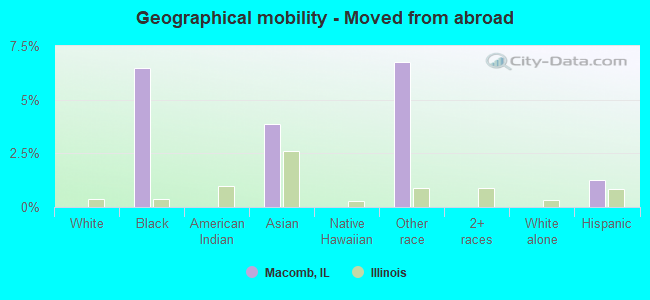
Geographical mobility in Macomb Same house 1 year ago 7,529 65.4% White (Caucasian)560 45.2% Black or African American435 80.9% Asian36 27.7% Other race672 74.4% Two or more races7,857 66.4% White alone, not Hispanic / Latino277 39.5% Hispanic or LatinoMoved within same county 1,868 16.2% White / Caucasian90 7.3% Black or African American3 100.0% American Indian / Alaska Native50 9.2% Asian61 47.6% Other race102 11.3% Two or more races1,902 16.1% White alone, not Hispanic / Latino179 25.5% Hispanic or LatinoMoved within same state 1,503 13.1% White / Caucasian463 37.4% Black or African American20 3.7% Asian17 12.9% Other race115 12.7% Two or more races1,430 12.1% White alone, not Hispanic / Latino226 32.2% Hispanic or LatinoMoved from different state 565 4.9% White / Caucasian108 8.7% Black or African American13 2.5% Asian7 99.3% Native Hawaiian / Pacific Islander582 4.9% White alone, not Hispanic / LatinoMoved from abroad 80 6.5% Black or African American21 3.9% Asian9 6.8% Other race9 1.2% Hispanic or Latino
Children Nativity (place of birth) in Macomb
Children under 6 years - Living with two parents Both parents native 224 100.0% NativeBoth parents foreign-born 38 100.0% NativeOne native, one foreign-born parent 31 100.0% NativeChildren under 6 years - Living with one parent Native parent 191 100.0% NativeForeign-born parent 32 100.0% Foreign-born
Children 6 to 17 years - Living with two parents Both parents native 953 100.0% NativeBoth parents foreign-born 35 100.0% NativeOne native, one foreign-born parent 94 100.0% NativeChildren 6 to 17 years - Living with one parent Native parent 485 100.0% Native
Grandparents responsible for own grandchildren in Macomb
Grandparents (30 to 59 years) White / Caucasian 6 16.5% Responsible for grandchildren33 83.5% Not responsible for grandchildrenTwo or more races 6 100.0% Not responsible for grandchildrenWhite alone, not Hispanic / Latino 7 15.0% Responsible for grandchildren40 85.0% Not responsible for grandchildrenHispanic or Latino 4 100.0% Not responsible for grandchildren
Grandparents (60 years and over) White / Caucasian 110 100.0% Not responsible for grandchildrenWhite alone, not Hispanic / Latino 124 100.0% Not responsible for grandchildren