Mableton, GA (Georgia) Houses and Residents
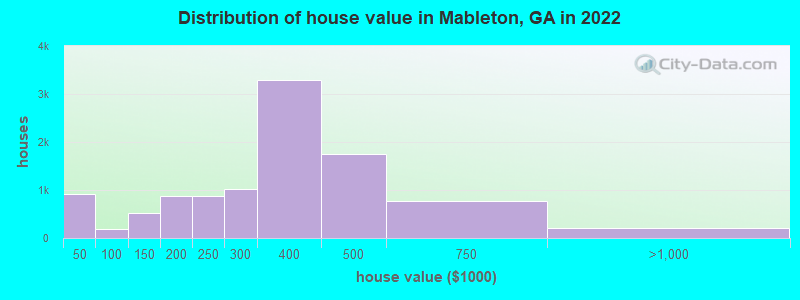
Estimated median house or condo value in 2022: $320,125 (it was $99,700 in 2000 )
Mableton:
$320,125Georgia:
$297,400
Lower value quartile - upper value quartile: $227,622 - $447,323Total population: 37,115 (Urban population: 29,552, Rural population: 0)
Houses: 16,639 (15,316 occupied: 11,494 owner occupied, 3,925 renter occupied )
% of renters here:
25%State:
34%
Housing density: 808 houses/condos per square mile
Median price asked for vacant for-sale houses and condos in 2022: $191,354.
Median contract rent in 2022: $1,176 (lower quartile is $993, upper quartile is $1,506)
Median rent asked for vacant for-rent units in 2022: $1,336
Median gross rent in Mableton, GA in 2022: $1,431
Housing units in Mableton with a mortgage: 8,250 (361 second mortgage, 31 home equity loan, 283 both second mortgage and home equity loan )Houses without a mortgage: 7
Median household income for houses/condos with a mortgage: $101,802
Median household income for apartments without a mortgage: $81,408
Median monthly housing costs: $1,404
Data:
Median house or condo value ($)
Median house or condo value ($ change since 2000)
Median house or condo value ($) - White
Median house or condo value ($) - Black or African American
Median house or condo value ($) - Asian
Median house or condo value ($) - Hispanic or Latino
Median house or condo value ($) - American Indian and Alaska Native
Median house or condo value ($) - Multirace
Median house or condo value ($) - Other Race
Median price asked for mobile homes ($)
Household density (households per square mile)
Mean house or condo value by units in structure - 1, detached ($)
Mean house or condo value by units in structure - 1, attached ($)
Mean house or condo value by units in structure - 2 ($)
Mean house or condo value by units in structure by units in structure - 3 or 4 ($)
Mean house or condo value by units in structure - 5 or more ($)
Mean house or condo value by units in structure - Boat, RV, van, etc. ($)
Mean house or condo value by units in structure - Mobile home ($)
Median contract rent ($)
Median contract rent - Lower quartile ($)
Median contract rent - Upper quartile ($)
Median gross rent ($)
Urban houses (%)
Rural houses (%)
Houses occupied (%)
Houses occupied (% change since 2000)
Houses owner occupied (%)
Houses owner occupied (% change since 2000)
Houses renter occupied (%)
Houses renter occupied (% change since 2000)
Vacant housing units - For rent (%)
Vacant housing units - For rent (% change since 2000)
Vacant housing units - For sale only (%)
Vacant housing units - For sale only (% change since 2000)
Vacant housing units - Rented or sold, not occupied (%)
Vacant housing units - Rented or sold, not occupied (% change since 2000)
Vacant housing units - For seasonal, recreational, or occasional use (%)
Vacant housing units - For seasonal, recreational, or occasional use (% change since 2000)
Vacant housing units - For migrant workers (%)
Vacant housing units - For migrant workers (% change since 2000)
Vacant housing units - Other vacant (%)
Vacant housing units - Other vacant (% change since 2000)
Median monthly housing costs ($)
Median household income for houses/condos with a mortgage ($)
Median household income for houses/condos without a mortgage ($)
Median household income ($)
Median household income ($) - White
Median household income ($) - Black or African American
Median household income ($) - Asian
Median household income ($) - Hispanic or Latino
Median household income ($) - American Indian and Alaska Native
Median household income ($) - Multirace
Median household income ($) - Other Race
Mortgage status - with mortgage (%)
Mortgage status - with second mortgage (%)
Mortgage status - with home equity loan (%)
Mortgage status - with both second mortgage and home equity loan (%)
Mortgage status - without a mortgage (%)
Median year house/condo built
Median year apartment built
Household type by relationship - Male householder living alone (%)
Household type by relationship - Male householder not living alone (%)
Household type by relationship - Female householder living alone (%)
Household type by relationship - Female householder not living alone (%)
Household type by relationship - Opposite-Sex spouse (%)
Household type by relationship - Same-Sex spouse (%)
Household type by relationship - Opposite-Sex unmarried partner (%)
Household type by relationship - Same-Sex unmarried partner (%)
Household type by relationship - In group quarters (%)
Size of family households - 2-person household (%)
Size of family households - 3-person household (%)
Size of family households - 4-person household (%)
Size of family households - 5-person household (%)
Size of family households - 6-person household (%)
Size of family households - 7-or-more-person household (%)
Size of nonfamily households - 1-person household (%)
Size of nonfamily households - 2-person household (%)
Size of nonfamily households - 3-person household (%)
Size of nonfamily households - 4-person household (%)
Size of nonfamily households - 5-person household (%)
Size of nonfamily households - 6-person household (%)
Size of nonfamily households - 7-or-moreperson household (%)
Year house built - Built 2010 or later (%)
Year house built - Built 2000 to 2009 (%)
Year house built - Built 1990 to 1999 (%)
Year house built - Built 1980 to 1989 (%)
Year house built - Built 1970 to 1979 (%)
Year house built - Built 1960 to 1969 (%)
Year house built - Built 1950 to 1959 (%)
Year house built - Built 1940 to 1949 (%)
Year house built - Built 1939 or earlier (%)
Median number of rooms in houses and condos
Median number of rooms in apartments
Median number of bedrooms in owner occupied houses
Mean number of bedrooms in owner occupied houses
Median number of bedrooms in renter occupied houses
Mean number of bedrooms in renter occupied houses
Median number of vehichles in owner occupied houses
Mean number of vehichles in owner occupied houses
Median number of vehichles in renter occupied houses
Mean number of vehichles in renter occupied houses
Rooms in owner-occupied houses - 1 room (%)
Rooms in owner-occupied houses - 2 rooms (%)
Rooms in owner-occupied houses - 3 rooms (%)
Rooms in owner-occupied houses - 4 rooms (%)
Rooms in owner-occupied houses - 5 rooms (%)
Rooms in owner-occupied houses - 6 rooms (%)
Rooms in owner-occupied houses - 7 rooms (%)
Rooms in owner-occupied houses - 8 rooms (%)
Rooms in owner-occupied houses - 9+ rooms (%)
Rooms in renter-occupied houses - 1 room (%)
Rooms in renter-occupied houses - 2 rooms (%)
Rooms in renter-occupied houses - 3 rooms (%)
Rooms in renter-occupied houses - 4 rooms (%)
Rooms in renter-occupied houses - 5 rooms (%)
Rooms in renter-occupied houses - 6 rooms (%)
Rooms in renter-occupied houses - 7 rooms (%)
Rooms in renter-occupied houses - 8 rooms (%)
Rooms in renter-occupied houses - 9+ rooms (%)
Bedrooms in owner-occupied houses - no bedrooms (%)
Bedrooms in owner-occupied houses - 1 bedroom (%)
Bedrooms in owner-occupied houses - 2 bedrooms (%)
Bedrooms in owner-occupied houses - 3 bedrooms (%)
Bedrooms in owner-occupied houses - 4 bedrooms (%)
Bedrooms in owner-occupied houses - 5+ bedrooms (%)
Bedrooms in renter-occupied houses - no bedrooms (%)
Bedrooms in renter-occupied houses - 1 bedroom (%)
Bedrooms in renter-occupied houses - 2 bedrooms (%)
Bedrooms in renter-occupied houses - 3 bedrooms (%)
Bedrooms in renter-occupied houses - 4 bedrooms (%)
Bedrooms in renter-occupied houses - 5+ bedrooms (%)
Vehicles available in owner-occupied houses - no vehicle available (%)
Vehicles available in owner-occupied houses - 1 vehicle available(%)
Vehicles available in owner-occupied houses - 2 Vehicles available (%)
Vehicles available in owner-occupied houses - 3 Vehicles available (%)
Vehicles available in owner-occupied houses - 4 Vehicles available (%)
Vehicles available in owner-occupied houses - 5+ Vehicles available (%)
Vehicles available in renter-occupied houses - no vehicle available (%)
Vehicles available in renter-occupied houses - 1 vehicle available (%)
Vehicles available in renter-occupied houses - 2 Vehicles available (%)
Vehicles available in renter-occupied houses - 3 Vehicles available (%)
Vehicles available in renter-occupied houses - 4 Vehicles available (%)
Vehicles available in renter-occupied houses - 5+ Vehicles available (%)
Housing units in structures - 1, detached (%)
Housing units in structures - 1, attached (%)
Housing units in structures - 2 (%)
Housing units in structures - 3 or 4 (%)
Housing units in structures - 5 to 9 (%)
Housing units in structures - 10 to 19 (%)
Housing units in structures - 20 to 49 (%)
Housing units in structures - 50 or more (%)
Housing units in structures - Mobile home (%)
Housing units in structures - Boat, RV, van, etc. (%)
Housing units in structures - Owners - 1, detached (%)
Housing units in structures - Owners - 1, attached (%)
Housing units in structures - Owners - 2 (%)
Housing units in structures - Owners - 3 or 4 (%)
Housing units in structures - Owners - 5 to 9 (%)
Housing units in structures - Owners - 10 to 19 (%)
Housing units in structures - Owners - 20 to 49 (%)
Housing units in structures - Owners - 50 or more (%)
Housing units in structures - Owners - Mobile home (%)
Housing units in structures - Owners - Boat, RV, van, etc. (%)
Housing units in structures - Renters - 1, detached (%)
Housing units in structures - Renters - 1, attached (%)
Housing units in structures - Renters - 2 (%)
Housing units in structures - Renters - 3 or 4 (%)
Housing units in structures - Renters - 5 to 9 (%)
Housing units in structures - Renters - 10 to 19 (%)
Housing units in structures - Renters - 20 to 49 (%)
Housing units in structures - Renters - 50 or more (%)
Housing units in structures - Renters - Mobile home (%)
Housing units in structures - Renters - Boat, RV, van, etc. (%)
House/condo owner moved in on average (years ago)
Renter moved in on average (years ago)
Year householder moved into unit - Moved in 1999 to March 2000 (%)
Year householder moved into unit - Moved in 1999 to March 2000 (%) - White
Year householder moved into unit - Moved in 1999 to March 2000 (%) - Black or African American
Year householder moved into unit - Moved in 1999 to March 2000 (%) - Asian
Year householder moved into unit - Moved in 1999 to March 2000 (%) - Hispanic or Latino
Year householder moved into unit - Moved in 1999 to March 2000 (%) - American Indian and Alaska Native
Year householder moved into unit - Moved in 1999 to March 2000 (%) - Multirace
Year householder moved into unit - Moved in 1999 to March 2000 (%) - Other Race
Year householder moved into unit - Moved in 1995 to 1998 (%)
Year householder moved into unit - Moved in 1995 to 1998 (%) - White
Year householder moved into unit - Moved in 1995 to 1998 (%) - Black or African American
Year householder moved into unit - Moved in 1995 to 1998 (%) - Asian
Year householder moved into unit - Moved in 1995 to 1998 (%) - Hispanic or Latino
Year householder moved into unit - Moved in 1995 to 1998 (%) - American Indian and Alaska Native
Year householder moved into unit - Moved in 1995 to 1998 (%) - Multirace
Year householder moved into unit - Moved in 1995 to 1998 (%) - Other Race
Year householder moved into unit - Moved in 1990 to 1994 (%)
Year householder moved into unit - Moved in 1990 to 1994 (%) - White
Year householder moved into unit - Moved in 1990 to 1994 (%) - Black or African American
Year householder moved into unit - Moved in 1990 to 1994 (%) - Asian
Year householder moved into unit - Moved in 1990 to 1994 (%) - Hispanic or Latino
Year householder moved into unit - Moved in 1990 to 1994 (%) - American Indian and Alaska Native
Year householder moved into unit - Moved in 1990 to 1994 (%) - Multirace
Year householder moved into unit - Moved in 1990 to 1994 (%) - Other Race
Year householder moved into unit - Moved in 1980 to 1989 (%)
Year householder moved into unit - Moved in 1980 to 1989 (%) - White
Year householder moved into unit - Moved in 1980 to 1989 (%) - Black or African American
Year householder moved into unit - Moved in 1980 to 1989 (%) - Asian
Year householder moved into unit - Moved in 1980 to 1989 (%) - Hispanic or Latino
Year householder moved into unit - Moved in 1980 to 1989 (%) - American Indian and Alaska Native
Year householder moved into unit - Moved in 1980 to 1989 (%) - Multirace
Year householder moved into unit - Moved in 1980 to 1989 (%) - Other Race
Year householder moved into unit - Moved in 1970 to 1979 (%)
Year householder moved into unit - Moved in 1970 to 1979 (%) - White
Year householder moved into unit - Moved in 1970 to 1979 (%) - Black or African American
Year householder moved into unit - Moved in 1970 to 1979 (%) - Asian
Year householder moved into unit - Moved in 1970 to 1979 (%) - Hispanic or Latino
Year householder moved into unit - Moved in 1970 to 1979 (%) - American Indian and Alaska Native
Year householder moved into unit - Moved in 1970 to 1979 (%) - Multirace
Year householder moved into unit - Moved in 1970 to 1979 (%) - Other Race
Year householder moved into unit - Moved in 1969 or earlier (%)
Year householder moved into unit - Moved in 1969 or earlier (%) - White
Year householder moved into unit - Moved in 1969 or earlier (%) - Black or African American
Year householder moved into unit - Moved in 1969 or earlier (%) - Asian
Year householder moved into unit - Moved in 1969 or earlier (%) - Hispanic or Latino
Year householder moved into unit - Moved in 1969 or earlier (%) - American Indian and Alaska Native
Year householder moved into unit - Moved in 1969 or earlier (%) - Multirace
Year householder moved into unit - Moved in 1969 or earlier (%) - Other Race
Housing units lacking complete plumbing facilities (%)
Housing units lacking complete kitchen facilities (%)
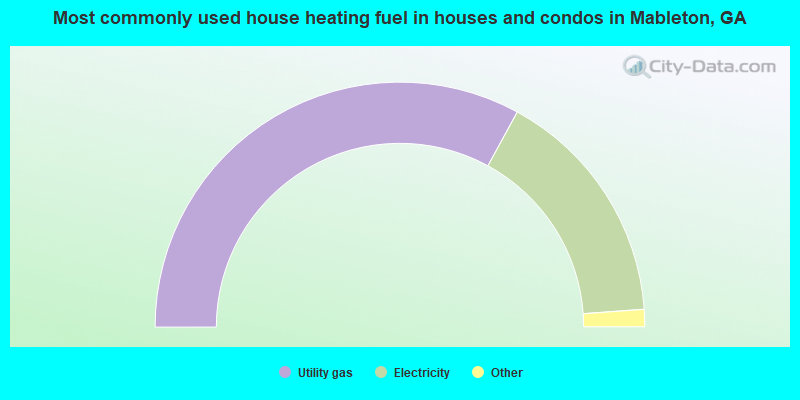
House heating fuel used in houses and condos - Utility gas (%)
House heating fuel used in houses and condos - Bottled, tank, or LP gas (%)
House heating fuel used in houses and condos - Electricity (%)
House heating fuel used in houses and condos - Fuel oil, kerosene, etc. (%)
House heating fuel used in houses and condos - Coal or coke (%)
House heating fuel used in houses and condos - Wood (%)
House heating fuel used in houses and condos - Solar energy (%)
House heating fuel used in houses and condos - Other fuel (%)
House heating fuel used in houses and condos - No fuel used (%)
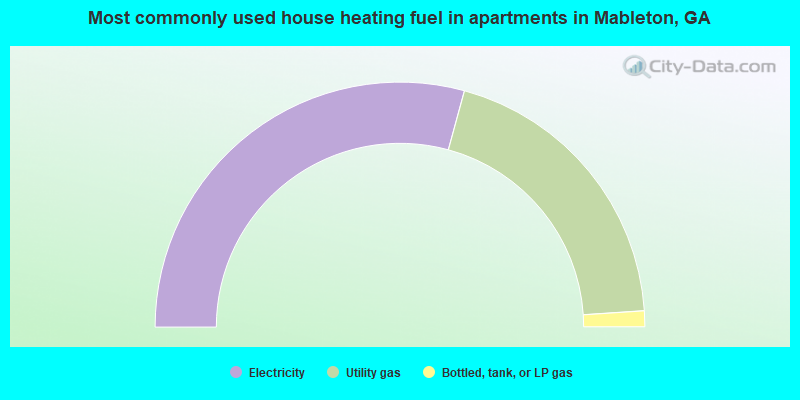
House heating fuel used in apartments - Utility gas (%)
House heating fuel used in apartments - Bottled, tank, or LP gas (%)
House heating fuel used in apartments - Electricity (%)
House heating fuel used in apartments - Fuel oil, kerosene, etc. (%)
House heating fuel used in apartments - Coal or coke (%)
House heating fuel used in apartments - Wood (%)
House heating fuel used in apartments - Solar energy (%)
House heating fuel used in apartments - Other fuel (%)
House heating fuel used in apartments - No fuel used (%)
Latest news about housing in Mableton, GA collected exclusively by city-data.com from local newspapers, TV, and radio stations
Median year house/condo built: 1988Median year apartment built: 1977Household type by relationship:
Households: 41,980
Male householders: 7,386 (1,728 living alone ), Female householders: 7,787 (2,247 living alone )7,769 spouses (7,573 opposite-sex spouses ), 731 unmarried partners , (697 opposite-sex unmarried partners ), 12,499 children (11,913 natural , 201 adopted , 384 stepchildren ), 1,226 grandchildren , 953 brothers or sisters , 1,445 parents , 0 foster children , 1,055 other relatives , 1,081 non-relatives In group quarters: 42
Size of family households: 4,113 2-persons , 2,623 3-persons , 2,258 4-persons , 942 5-persons , 537 6-persons , 380 7-or-more-persons .
Size of nonfamily households: 3,948 1-person , 541 2-persons , 66 3-persons .
6,558 married couples with children. single-parent households (486 men , 1,685 women ).
74.8% of residents of Mableton speak English at home. of residents speak Spanish at home (56% speak English very well , 20% speak English well , 17% speak English not well , 7% don't speak English at all ).of residents speak other Indo-European language at home (64% speak English very well , 16% speak English well , 7% speak English not well , 12% don't speak English at all ).of residents speak Asian or Pacific Island language at home (60% speak English very well , 21% speak English well , 6% speak English not well , 13% don't speak English at all ).of residents speak other language at home (86% speak English very well , 7% speak English well , 7% speak English not well ).
Foreign born population: 6,958 (16.6%)of them are naturalized citizens )
Median number of rooms in houses and condos:
Median number of rooms in apartments
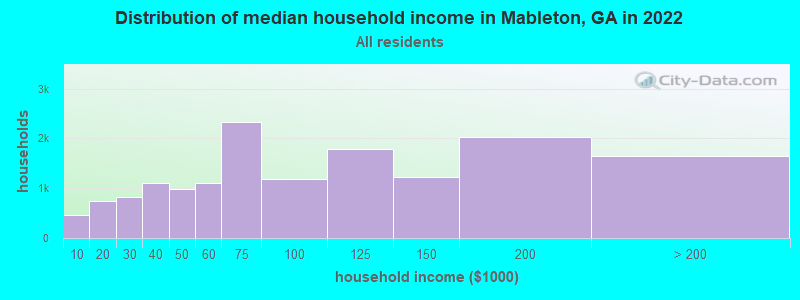
Mableton, GA household income distribution 456 Less than $10,000742 $10,000 to $19,999822 $20,000 to $29,9991,099 $30,000 to $39,999990 $40,000 to $49,9991,094 $50,000 to $59,9992,328 $60,000 to $74,9991,185 $75,000 to $99,9991,795 $100,000 to $124,9991,226 $125,000 to $149,9992,022 $150,000 to $199,9991,642 $200,000 or more
Home value of owner - occupied houses in 2022 in Mableton, GA 336 Less than $10,0006 $10,000 to $14,999139 $15,000 to $19,99952 $20,000 to $24,999308 $30,000 to $34,99964 $40,000 to $49,99936 $50,000 to $59,99931 $60,000 to $69,99914 $70,000 to $79,99925 $80,000 to $89,99910 $90,000 to $99,999241 $100,000 to $124,999286 $125,000 to $149,999343 $150,000 to $174,999528 $175,000 to $199,999885 $200,000 to $249,9991,022 $250,000 to $299,9993,293 $300,000 to $399,9991,745 $400,000 to $499,999768 $500,000 to $749,999159 $750,000 to $999,99940 $1,000,000 to $1,499,999Rent paid by renters in 2022 in Mableton, GA 6 $400 to $44913 $450 to $49970 $500 to $54935 $550 to $59984 $600 to $64915 $650 to $69961 $700 to $74992 $750 to $799300 $800 to $899556 $900 to $999735 $1,000 to $1,249353 $1,250 to $1,499488 $1,500 to $1,999553 $2,000 to $2,49934 $2,500 to $2,9996 $3,000 to $3,499104 No cash rent
Percentage of workers working in this county: 50.9%Number of people working at home: 4,465 (20.2% of all workers )
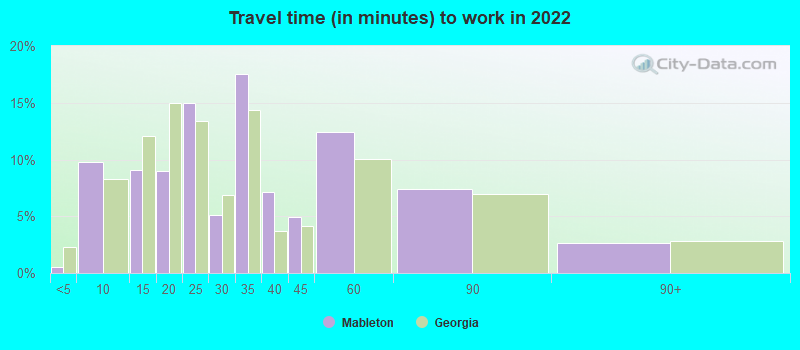
Travel time to work (commute)
Less than 5 minutes: 925 to 9 minutes: 65510 to 14 minutes: 1,53615 to 19 minutes: 2,16620 to 24 minutes: 1,90125 to 29 minutes: 1,43930 to 34 minutes: 3,21035 to 39 minutes: 1,17140 to 44 minutes: 1,29545 to 59 minutes: 2,11260 to 89 minutes: 1,41990 or more minutes: 318
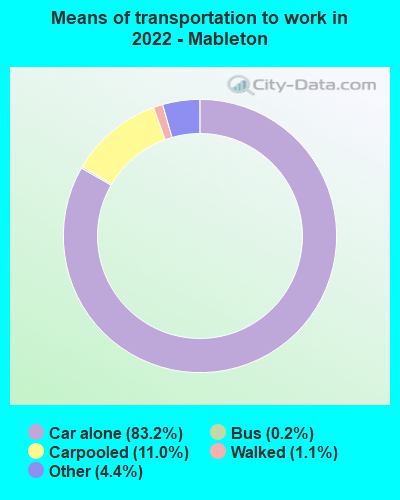
Means of transportation to work:
Drove a car alone: 6,590 (54.1%)Carpooled: 1,039 (8.5%)Bus : 17 (0.1%)Taxi: 425 (3.5%)Walked: 109 (0.9%)Worked at home: 4,465 (36.6%)
Unemployment by race in 2022
Unemployment rate for White non-Hispanic residents 2.9% Males5.0% FemalesUnemployment rate for Black residents 7.5% Males6.2% FemalesUnemployment rate for Asian residents 4.6% FemalesUnemployment rate for other race residents 0.4% MalesUnemployment rate for two or more race residents 2.0% Males9.4% FemalesUnemployment rate for Hispanic or Latino residents 2.6% Males0.5% Females
Year of entry for the foreign-born population in Mableton, Georgia
1,970 2010 or later 1,975 2000 to 2009 1,833 1990 to 1999 857 1980 to 1989 380 1970 to 1979 149 Before 1970
First ancestries reported:
Irish: 1,484 (6.1%)
Nigerian: 1,133 (4.6%)
American: 993 (4.1%)
German: 891 (3.6%)
English: 740 (3.0%)
European: 659 (2.7%)
African: 616 (2.5%)
Jamaican: 304 (1.2%)
Haitian: 254 (1.0%)
Italian: 205 (0.8%)
Ghanaian: 190 (0.8%)
Canadian: 94 (0.4%)
Polish: 88 (0.4%)
British: 87 (0.4%)
Scottish: 74 (0.3%)
French: 65 (0.3%)
Guyanese: 65 (0.3%)
Greek: 57 (0.2%)
Scotch-Irish: 56 (0.2%)
West Indian: 51 (0.2%)
Northern European: 44 (0.2%)
Scandinavian: 41 (0.2%)
Eastern European: 40 (0.2%)
Portuguese: 40 (0.2%)
Liberian: 34 (0.1%)
Russian: 32 (0.1%)
Welsh: 31 (0.1%)
Ethiopian: 29 (0.1%)
Brazilian: 29 (0.1%)
Kenyan: 27 (0.1%)
Norwegian: 26 (0.1%)
Romanian: 18 (0.07%)
Swedish: 16 (0.07%)
Lebanese: 14 (0.06%)
British West Indian: 8 (0.03%)
Dutch: 7 (0.03%)
Ugandan: 6 (0.02%)
Trinidadian and Tobagonian: 6 (0.02%)
Bulgarian: 3 (0.01%) Most common places of birth for foreign-born residents (%): Mexico Mableton:
37.1% (2,525)Georgia:
20.0% (223,400)
Honduras Mableton:
8.5% (576)Georgia:
2.1% (23,500)
Guatemala Mableton:
6.0% (407)Georgia:
3.6% (39,974)
El Salvador Mableton:
5.1% (344)Georgia:
2.5% (27,794)
Nigeria Mableton:
4.8% (324)Georgia:
2.5% (27,846)
Jamaica Mableton:
4.5% (309)Georgia:
4.6% (51,270)
Ghana Mableton:
4.0% (274)Georgia:
1.0% (11,747)
Haiti Mableton:
3.3% (223)Georgia:
1.6% (17,476)
India Mableton:
3.0% (203)Georgia:
9.2% (103,325)
China, excluding Hong Kong and Taiwan Mableton:
2.0% (135)Georgia:
3.5% (39,227)
Cuba Mableton:
1.9% (127)Georgia:
1.2% (12,946)
Place of birth for U.S.-born residents:
This state: 17,615Other state: 16,876Northeast: 3,611Midwest: 2,788South: 8,661West: 1,822 89.4% of Mableton residents lived in the same house 1 years ago.
Out of people who lived in different houses, 36.9% lived in this county.
Out of people who lived in different counties, 56.5% lived in Georgia.
Mableton:
89.4%State average:
86.6%
Education attainment for males 25 years and older:
No schooling: 191Nursery to 4th grade: 445th and 6th grade: 3877th and 8th grade: 1999th grade: 10110th grade: 16011th grade: 18412th grade, no diploma: 429High school graduate (or equivalency): 3,273Less than 1 year of college: 698Some college more than 1 year, no degree: 2,049Associate degree: 1,163Bachelor's degree: 3,081Master's degree: 980Professional school degree: 167Doctorate degree: 199
Education attainment for females 25 years and older:
No schooling: 319Nursery to 4th grade: 1465th and 6th grade: 2227th and 8th grade: 179th grade: 4210th grade: 6011th grade: 30812th grade, no diploma: 136High school graduate (or equivalency): 3,591Less than 1 year of college: 935Some college more than 1 year, no degree: 1,557Associate degree: 1,119Bachelor's degree: 3,801Master's degree: 2,344Professional school degree: 360Doctorate degree: 185
Housing units in structures:
One, detached: 12,826One, attached: 1,350Two: 3703 or 4: 3615 to 9: 59210 to 19: 30120 to 49: 13850 or more: 41Mobile homes: 641Boats, RVs, vans, etc.: 16Median worth of mobile homes: $24,320
Housing units lacking complete plumbing facilities in 2022: 1.1%Housing units lacking complete kitchen facilities in 2022: 1.4%House/condo owner moved in on average 10 years ago
Renter moved in on average 5 years ago
Private vs. public school enrollment:
Students in private schools in grades 1 to 8 (elementary and middle school): 464 Students in private schools in grades 9 to 12 (high school): 184 Students in private undergraduate colleges: 197