Races in Mableton, Georgia (GA) Detailed Stats
Data:
Races - White alone (%)
Races - White alone (% change since 2000)
Races - Black alone (%)
Races - Black alone (% change since 2000)
Races - American Indian alone (%)
Races - American Indian alone (% change since 2000)
Races - Asian alone (%)
Races - Asian alone (% change since 2000)
Races - Hispanic (%)
Races - Hispanic (% change since 2000)
Races - Native Hawaiian and Other Pacific Islander alone (%)
Races - Native Hawaiian and Other Pacific Islander alone (% change since 2000)
Races - Two or more races(%)
Races - Two or more races(% change since 2000)
Races - Other race alone (%)
Races - Other race alone (% change since 2000)
Racial diversity
Place of birth - Born in state of residence (%)
Place of birth - Born in state of residence (%) - White
Place of birth - Born in state of residence (%) - Black or African American
Place of birth - Born in state of residence (%) - Asian
Place of birth - Born in state of residence (%) - Hispanic or Latino
Place of birth - Born in state of residence (%) - American Indian and Alaska Native
Place of birth - Born in state of residence (%) - Multirace
Place of birth - Born in state of residence (%) - Other Race
Place of birth - Born in other state (%)
Place of birth - Born in other state (%) - White
Place of birth - Born in other state (%) - Black or African American
Place of birth - Born in other state (%) - Asian
Place of birth - Born in other state (%) - Hispanic or Latino
Place of birth - Born in other state (%) - American Indian and Alaska Native
Place of birth - Born in other state (%) - Multirace
Place of birth - Born in other state (%) - Other Race
Place of birth - Native, outside of US (%)
Place of birth - Native, outside of US (%) - White
Place of birth - Native, outside of US (%) - Black or African American
Place of birth - Native, outside of US (%) - Asian
Place of birth - Native, outside of US (%) - Hispanic or Latino
Place of birth - Native, outside of US (%) - American Indian and Alaska Native
Place of birth - Native, outside of US (%) - Multirace
Place of birth - Native, outside of US (%) - Other Race
Place of birth - Foreign born (%)
Place of birth - Foreign born (%) - White
Place of birth - Foreign born (%) - Black or African American
Place of birth - Foreign born (%) - Asian
Place of birth - Foreign born (%) - Hispanic or Latino
Place of birth - Foreign born (%) - American Indian and Alaska Native
Place of birth - Foreign born (%) - Multirace
Place of birth - Foreign born (%) - Other Race
Residents speaking English at home (%)
Residents speaking English at home - Born in the United States (%)
Residents speaking English at home - Native, born elsewhere (%)
Residents speaking English at home - Foreign born (%)
Residents speaking Spanish at home (%)
Residents speaking Spanish at home - Born in the United States (%)
Residents speaking Spanish at home - Native, born elsewhere (%)
Residents speaking Spanish at home - Foreign born (%)
Residents speaking other language at home (%)
Residents speaking other language at home - Born in the United States (%)
Residents speaking other language at home - Native, born elsewhere (%)
Residents speaking other language at home - Foreign born (%)
Marital status - Never married (%)
Marital status - Now married (%)
Marital status - Separated (%)
Marital status - Widowed (%)
Marital status - Divorced (%)
Ancestries Reported - Arab (%)
Ancestries Reported - Czech (%)
Ancestries Reported - Danish (%)
Ancestries Reported - Dutch (%)
Ancestries Reported - English (%)
Ancestries Reported - French (%)
Ancestries Reported - French Canadian (%)
Ancestries Reported - German (%)
Ancestries Reported - Greek (%)
Ancestries Reported - Hungarian (%)
Ancestries Reported - Irish (%)
Ancestries Reported - Italian (%)
Ancestries Reported - Lithuanian (%)
Ancestries Reported - Norwegian (%)
Ancestries Reported - Polish (%)
Ancestries Reported - Portuguese (%)
Ancestries Reported - Russian (%)
Ancestries Reported - Scotch-Irish (%)
Ancestries Reported - Scottish (%)
Ancestries Reported - Slovak (%)
Ancestries Reported - Subsaharan African (%)
Ancestries Reported - Swedish (%)
Ancestries Reported - Swiss (%)
Ancestries Reported - Ukrainian (%)
Ancestries Reported - United States (%)
Ancestries Reported - Welsh (%)
Ancestries Reported - West Indian (%)
Ancestries Reported - Other (%)
Geographical mobility - Same house 1 year ago (%)
Geographical mobility - Same house 1 year ago (%) - White
Geographical mobility - Same house 1 year ago (%) - Black or African American
Geographical mobility - Same house 1 year ago (%) - Asian
Geographical mobility - Same house 1 year ago (%) - Hispanic or Latino
Geographical mobility - Same house 1 year ago (%) - American Indian and Alaska Native
Geographical mobility - Same house 1 year ago (%) - Multirace
Geographical mobility - Same house 1 year ago (%) - Other Race
Geographical mobility - Moved within same county (%)
Geographical mobility - Moved within same county (%) - White
Geographical mobility - Moved within same county (%) - Black or African American
Geographical mobility - Moved within same county (%) - Asian
Geographical mobility - Moved within same county (%) - Hispanic or Latino
Geographical mobility - Moved within same county (%) - American Indian and Alaska Native
Geographical mobility - Moved within same county (%) - Multirace
Geographical mobility - Moved within same county (%) - Other Race
Geographical mobility - Moved from different county within same state (%)
Geographical mobility - Moved from different county within same state (%) - White
Geographical mobility - Moved from different county within same state (%) - Black or African American
Geographical mobility - Moved from different county within same state (%) - Asian
Geographical mobility - Moved from different county within same state (%) - Hispanic or Latino
Geographical mobility - Moved from different county within same state (%) - American Indian and Alaska Native
Geographical mobility - Moved from different county within same state (%) - Multirace
Geographical mobility - Moved from different county within same state (%) - Other Race
Geographical mobility - Moved from different state (%)
Geographical mobility - Moved from different state (%) - White
Geographical mobility - Moved from different state (%) - Black or African American
Geographical mobility - Moved from different state (%) - Asian
Geographical mobility - Moved from different state (%) - Hispanic or Latino
Geographical mobility - Moved from different state (%) - American Indian and Alaska Native
Geographical mobility - Moved from different state (%) - Multirace
Geographical mobility - Moved from different state (%) - Other Race
Geographical mobility - Moved from abroad (%)
Geographical mobility - Moved from abroad (%) - White
Geographical mobility - Moved from abroad (%) - Black or African American
Geographical mobility - Moved from abroad (%) - Asian
Geographical mobility - Moved from abroad (%) - Hispanic or Latino
Geographical mobility - Moved from abroad (%) - American Indian and Alaska Native
Geographical mobility - Moved from abroad (%) - Multirace
Geographical mobility - Moved from abroad (%) - Other Race
Place of birth for the foreign-born population - Ireland (%)
Place of birth for the foreign-born population - Denmark (%)
Place of birth for the foreign-born population - Norway (%)
Place of birth for the foreign-born population - Sweden (%)
Place of birth for the foreign-born population - United Kingdom (%)
Place of birth for the foreign-born population - England (%)
Place of birth for the foreign-born population - Scotland (%)
Place of birth for the foreign-born population - Other Northern Europe (%)
Place of birth for the foreign-born population - Austria (%)
Place of birth for the foreign-born population - Belgium (%)
Place of birth for the foreign-born population - France (%)
Place of birth for the foreign-born population - Germany (%)
Place of birth for the foreign-born population - Netherlands (%)
Place of birth for the foreign-born population - Switzerland (%)
Place of birth for the foreign-born population - Other Western Europe (%)
Place of birth for the foreign-born population - Greece (%)
Place of birth for the foreign-born population - Italy (%)
Place of birth for the foreign-born population - Portugal (%)
Place of birth for the foreign-born population - Spain (%)
Place of birth for the foreign-born population - Other Southern Europe (%)
Place of birth for the foreign-born population - Albania (%)
Place of birth for the foreign-born population - Belarus (%)
Place of birth for the foreign-born population - Bosnia and Herzegovina (%)
Place of birth for the foreign-born population - Bulgaria (%)
Place of birth for the foreign-born population - Croatia (%)
Place of birth for the foreign-born population - Czechoslovakia (%)
Place of birth for the foreign-born population - Hungary (%)
Place of birth for the foreign-born population - Latvia (%)
Place of birth for the foreign-born population - Lithuania (%)
Place of birth for the foreign-born population - North Macedonia (Macedonia) (%)
Place of birth for the foreign-born population - Moldova (%)
Place of birth for the foreign-born population - Poland (%)
Place of birth for the foreign-born population - Romania (%)
Place of birth for the foreign-born population - Russia (%)
Place of birth for the foreign-born population - Serbia (%)
Place of birth for the foreign-born population - Ukraine (%)
Place of birth for the foreign-born population - Other Eastern Europe (%)
Place of birth for the foreign-born population - China (%)
Place of birth for the foreign-born population - Hong Kong (%)
Place of birth for the foreign-born population - Taiwan (%)
Place of birth for the foreign-born population - Japan (%)
Place of birth for the foreign-born population - Korea (%)
Place of birth for the foreign-born population - Other Eastern Asia (%)
Place of birth for the foreign-born population - Afghanistan (%)
Place of birth for the foreign-born population - Bangladesh (%)
Place of birth for the foreign-born population - India (%)
Place of birth for the foreign-born population - Iran (%)
Place of birth for the foreign-born population - Kazakhstan (%)
Place of birth for the foreign-born population - Nepal (%)
Place of birth for the foreign-born population - Pakistan (%)
Place of birth for the foreign-born population - Sri Lanka (%)
Place of birth for the foreign-born population - Uzbekistan (%)
Place of birth for the foreign-born population - Other South Central Asia (%)
Place of birth for the foreign-born population - Burma (%)
Place of birth for the foreign-born population - Cambodia (%)
Place of birth for the foreign-born population - Indonesia (%)
Place of birth for the foreign-born population - Laos (%)
Place of birth for the foreign-born population - Malaysia (%)
Place of birth for the foreign-born population - Philippines (%)
Place of birth for the foreign-born population - Singapore (%)
Place of birth for the foreign-born population - Thailand (%)
Place of birth for the foreign-born population - Vietnam (%)
Place of birth for the foreign-born population - Other South Eastern Asia (%)
Place of birth for the foreign-born population - Armenia (%)
Place of birth for the foreign-born population - Iraq (%)
Place of birth for the foreign-born population - Israel (%)
Place of birth for the foreign-born population - Jordan (%)
Place of birth for the foreign-born population - Kuwait (%)
Place of birth for the foreign-born population - Lebanon (%)
Place of birth for the foreign-born population - Saudi Arabia (%)
Place of birth for the foreign-born population - Syria (%)
Place of birth for the foreign-born population - Turkey (%)
Place of birth for the foreign-born population - Yemen (%)
Place of birth for the foreign-born population - Other Western Asia (%)
Place of birth for the foreign-born population - Eritrea (%)
Place of birth for the foreign-born population - Ethiopia (%)
Place of birth for the foreign-born population - Kenya (%)
Place of birth for the foreign-born population - Somalia (%)
Place of birth for the foreign-born population - Uganda (%)
Place of birth for the foreign-born population - Zimbabwe (%)
Place of birth for the foreign-born population - Other Eastern Africa (%)
Place of birth for the foreign-born population - Cameroon (%)
Place of birth for the foreign-born population - Congo (%)
Place of birth for the foreign-born population - Democratic Republic of Congo (Zaire) (%)
Place of birth for the foreign-born population - Other Middle Africa (%)
Place of birth for the foreign-born population - Egypt (%)
Place of birth for the foreign-born population - Morocco (%)
Place of birth for the foreign-born population - Sudan (%)
Place of birth for the foreign-born population - Other Northern Africa (%)
Place of birth for the foreign-born population - South Africa (%)
Place of birth for the foreign-born population - Other Southern Africa (%)
Place of birth for the foreign-born population - Cabo Verde (%)
Place of birth for the foreign-born population - Ghana (%)
Place of birth for the foreign-born population - Liberia (%)
Place of birth for the foreign-born population - Nigeria (%)
Place of birth for the foreign-born population - Senegal (%)
Place of birth for the foreign-born population - Sierra Leone (%)
Place of birth for the foreign-born population - Other Western Africa (%)
Place of birth for the foreign-born population - Australia (%)
Place of birth for the foreign-born population - New Zealand (%)
Place of birth for the foreign-born population - Fiji (%)
Place of birth for the foreign-born population - Micronesia (%)
Place of birth for the foreign-born population - Bahamas (%)
Place of birth for the foreign-born population - Barbados (%)
Place of birth for the foreign-born population - Cuba (%)
Place of birth for the foreign-born population - Dominica (%)
Place of birth for the foreign-born population - Dominican Republic (%)
Place of birth for the foreign-born population - Grenada (%)
Place of birth for the foreign-born population - Haiti (%)
Place of birth for the foreign-born population - Jamaica (%)
Place of birth for the foreign-born population - St. Vincent and the Grenadines (%)
Place of birth for the foreign-born population - Trinidad and Tobago (%)
Place of birth for the foreign-born population - West Indies (%)
Place of birth for the foreign-born population - Other Caribbean (%)
Place of birth for the foreign-born population - Belize (%)
Place of birth for the foreign-born population - Costa Rica (%)
Place of birth for the foreign-born population - El Salvador (%)
Place of birth for the foreign-born population - Guatemala (%)
Place of birth for the foreign-born population - Honduras (%)
Place of birth for the foreign-born population - Mexico (%)
Place of birth for the foreign-born population - Nicaragua (%)
Place of birth for the foreign-born population - Panama (%)
Place of birth for the foreign-born population - Other Central America (%)
Place of birth for the foreign-born population - Argentina (%)
Place of birth for the foreign-born population - Bolivia (%)
Place of birth for the foreign-born population - Brazil (%)
Place of birth for the foreign-born population - Chile (%)
Place of birth for the foreign-born population - Colombia (%)
Place of birth for the foreign-born population - Ecuador (%)
Place of birth for the foreign-born population - Guyana (%)
Place of birth for the foreign-born population - Peru (%)
Place of birth for the foreign-born population - Uruguay (%)
Place of birth for the foreign-born population - Venezuela (%)
Place of birth for the foreign-born population - Other South America (%)
Place of birth for the foreign-born population - Canada (%)
Place of birth for the foreign-born population - Other Northern America (%)
Place of birth for the foreign-born population - Other (%)
Latest news about races in Mableton, GA collected exclusively by city-data.com from local newspapers, TV, and radio stations
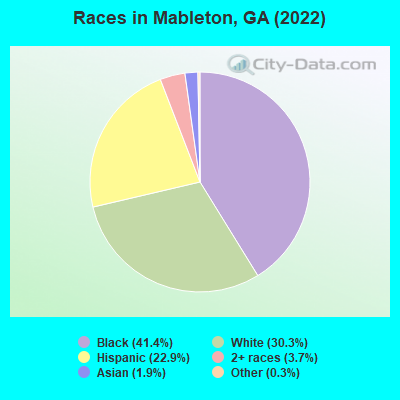
According to 2022 data, the most numerous races in Mableton, GA are White alone (12,704 residents), Black alone (17,359 residents), and Hispanic (9,622 residents). 74.7% of Mableton residents speak English at home. 16.2% of Mableton, GA residents are foreign-born (11.5% born in Latin America, 2.2% born in Africa), which is 38.2% greater than the foreign-born rate of 10.0% across the entire state of Georgia.
Race distribution in Mableton
2000 2022
5,128,661 62.6% White alone 2,331,465 28.5% Black alone 435,227 5.3% Hispanic 171,513 2.1% Asian alone 87,364 1.1% Two or more races 17,670 0.2% American Indian alone 11,275 0.1% Other race alone 3,278 0.04% Native Hawaiian and Other
5,415,657 49.6% White alone 3,349,240 30.7% Black alone 1,132,604 10.4% Hispanic 479,156 4.4% Asian alone 462,923 4.2% Two or more races 54,416 0.5% Other race alone 11,923 0.1% American Indian alone 6,957 0.06% Native Hawaiian and Other
Income and house value in Mableton Median household income in 2022 $83,959 White non-Hispanic householders$80,695 Black householders$190,894 American Indian and Alaska Native householders$96,377 Some other race householders$57,004 Two or more races householders$70,786 Hispanic or Latino race householdersMedian 2022 house value $319,483 White Non-Hispanic householders$360,903 Black or African American householders$214,487 American Indian or Alaska Native householders $541,997 Asian householders$361,224 Native Hawaiian and other Pacific Islander householders$319,804 Some other race householders$280,952 Two or more races householders$329,115 Hispanic or Latino householders
Median age by race in Mableton
41.8 Median age for White residents41.0 43.3 38.9 Median age for Black or African American residents37.1 40.1 23.4 Median age for American Indian / Alaska Native residents52.5 23.5 44.6 Median age for Asian residents44.1 44.1 17.5 Median age for Native Hawaiian / Pacific Islander residents15.1 44.0 31.0 Median age for Other race residents31.8 29.0 23.8 Median age for Two or more races residents19.4 29.6 48.0 Median age for White alone residents48.9 47.4 26.9 Median age for Hispanic or Latino residents26.8 26.6
Owner/renter occupied households by race in Mableton
House owners and renters - White residents 5,491 84.2% Owner occupied1,029 15.8% Renter occupiedHouse owners and renters - Black or African American residents 4,513 65.5% Owner occupied2,377 34.5% Renter occupiedHouse owners and renters - American Indian / Alaska Native residents 79 100.0% Owner occupiedHouse owners and renters - Asian residents 298 92.0% Owner occupied26 8.0% Renter occupiedHouse owners and renters - Native Hawaiian / Pacific Islander residents 16 100.0% Owner occupiedHouse owners and renters - Other race residents 513 73.3% Owner occupied186 26.7% Renter occupiedHouse owners and renters - Two or more races residents 612 65.1% Owner occupied328 34.9% Renter occupiedHouse owners and renters - White alone residents 4,808 85.1% Owner occupied843 14.9% Renter occupiedHouse owners and renters - Hispanic or Latino residents 1,640 70.1% Owner occupied701 29.9% Renter occupied
Language usage in Mableton
English speakers - Total 74.7% of residents of Mableton speak English at home.
19.8% of residents speak Spanish at home 4,174 54.7% Speak English very well3,453 45.3% Speak English less than very well5.0% of residents speak other language at home 1,386 72.0% Speak English very well538 28.0% Speak English less than very well
English speakers - Born in the United States 95.1% of residents of Mableton speak English at home.
4.1% of residents speak Spanish at home 607 89.8% Speak English very well69 10.2% Speak English less than very well0.5% of residents speak other language at home 23 31.1% Speak English very well51 68.9% Speak English less than very well
English speakers - Native, born elsewhere 57.6% of residents of Mableton speak English at home.
27.6% of residents speak Spanish at home 63 42.3% Speak English very well86 57.7% Speak English less than very well18.1% of residents speak other language at home 98 100.0% Speak English very well
English speakers - Foreign-born 13.9% of residents of Mableton speak English at home.
58.7% of residents speak Spanish at home 1,419 34.8% Speak English very well2,664 65.2% Speak English less than very well24.2% of residents speak other language at home 1,234 73.5% Speak English very well446 26.5% Speak English less than very well
White (Caucasian) - Speak only English Native:
87.2% (11,760)Foreign-born:
12.6% (211)
White (Caucasian) - Speak another language Native:
9.1% (1,232)Foreign-born:
81.6% (1,365)
Black or African American - Speak only English Native:
96.8% (13,926)Foreign-born:
22.1% (422)
Black or African American - Speak another language Native:
3.2% (454)Foreign-born:
80.8% (1,548)
American Indian / Alaska Native - Speak another language Native:
48.9% (346)Foreign-born:
100.0% (13)
Asian - Speak only English Native:
70.1% (116)Foreign-born:
25.6% (166)
Asian - Speak another language Native:
21.6% (36)Foreign-born:
75.4% (490)
Other race - Speak only English Native:
16.4% (119)Foreign-born:
3.4% (49)
Other race - Speak another language Native:
85.2% (617)Foreign-born:
96.5% (1,394)
Two or more races - Speak only English Native:
78.4% (1,505)Foreign-born:
6.3% (45)
Two or more races - Speak another language Native:
20.7% (398)Foreign-born:
90.6% (638)
White alone - Speak only English Native:
98.3% (11,602)Foreign-born:
60.6% (202)
White alone - Speak another language Native:
1.8% (207)Foreign-born:
42.9% (143)
Hispanic or Latino - Speak only English Native:
19.3% (800)Foreign-born:
1.9% (79)
Hispanic or Latino - Speak another language Native:
80.6% (3,336)Foreign-born:
98.1% (4,152)
Foreign-born residents in Mableton 6,798 residents are foreign born (11.5% Latin America , 2.2% Africa ).
This city:
16.2%Georgia:
10.4%
Marital status for residents in Mableton Marital status - White (Caucasian) population 15 years and over
Males 27.1% Never married61.0% Now married0.9% Separated4.2% Widowed6.9% DivorcedFemales 23.6% Never married55.9% Now married2.4% Separated5.8% Widowed12.4% DivorcedWomen who gave birth in the past 12 months Now married:
93.8% (299)Unmarried:
6.2% (20)
Women who did not give birth in the past 12 months Now married:
49.9% (1,625)Unmarried:
50.1% (1,635)
Marital status - Black or African American population 15 years and over
Males 38.3% Never married52.4% Now married1.7% Separated1.1% Widowed6.4% DivorcedFemales 39.5% Never married39.6% Now married1.0% Separated3.5% Widowed16.4% DivorcedWomen who gave birth in the past 12 months Now married:
70.0% (135)Unmarried:
30.0% (58)
Women who did not give birth in the past 12 months Now married:
37.7% (1,723)Unmarried:
62.3% (2,847)
Marital status - American Indian / Alaska Native population 15 years and over
Males 53.1% Never married42.2% Now married0.0% Separated0.0% Widowed4.7% DivorcedFemales 54.9% Never married45.1% Now married0.0% Separated0.0% Widowed0.0% DivorcedWomen who gave birth in the past 12 months Now married:
100.0% (11)Unmarried:
0.0% (0)
Women who did not give birth in the past 12 months Now married:
42.8% (113)Unmarried:
57.2% (151)
Marital status - Asian population 15 years and over
Males 13.6% Never married86.4% Now married0.0% Separated0.0% Widowed0.0% DivorcedFemales 19.1% Never married76.5% Now married0.0% Separated2.9% Widowed1.4% DivorcedWomen who gave birth in the past 12 months Now married:
100.0% (14)Unmarried:
0.0% (0)
Women who did not give birth in the past 12 months Now married:
70.9% (208)Unmarried:
29.1% (86)
Marital status - Native Hawaiian / Pacific Islander population 15 years and over
Males 45.5% Never married54.5% Now married0.0% Separated0.0% Widowed0.0% DivorcedFemales 34.6% Never married65.4% Now married0.0% Separated0.0% Widowed0.0% DivorcedWomen who did not give birth in the past 12 months Now married:
65.4% (18)Unmarried:
34.6% (9)
Marital status - Other race population 15 years and over
Males 36.9% Never married37.3% Now married10.2% Separated1.0% Widowed14.5% DivorcedFemales 39.2% Never married48.6% Now married1.6% Separated0.0% Widowed10.6% DivorcedWomen who gave birth in the past 12 months Now married:
0.0% (0)Unmarried:
100.0% (90)
Women who did not give birth in the past 12 months Now married:
50.8% (313)Unmarried:
49.2% (303)
Marital status - Two or more races population 15 years and over
Males 53.0% Never married27.8% Now married0.0% Separated0.0% Widowed19.2% DivorcedFemales 39.8% Never married40.2% Now married0.0% Separated1.7% Widowed18.3% DivorcedWomen who gave birth in the past 12 months Now married:
0.0% (0)Unmarried:
100.0% (58)
Women who did not give birth in the past 12 months Now married:
37.4% (252)Unmarried:
62.6% (422)
Marital status - White alone, not Hispanic / Latino population 15 years and over
Males 22.4% Never married64.2% Now married0.8% Separated5.4% Widowed7.1% DivorcedFemales 21.2% Never married57.0% Now married1.6% Separated6.2% Widowed14.0% DivorcedWomen who gave birth in the past 12 months Now married:
92.6% (260)Unmarried:
7.4% (21)
Women who did not give birth in the past 12 months Now married:
49.4% (1,145)Unmarried:
50.6% (1,171)
Marital status - Hispanic or Latino population 15 years and over
Males 42.7% Never married43.6% Now married3.9% Separated0.0% Widowed9.8% DivorcedFemales 37.5% Never married49.6% Now married3.0% Separated2.3% Widowed7.5% DivorcedWomen who gave birth in the past 12 months Now married:
32.5% (65)Unmarried:
67.5% (136)
Women who did not give birth in the past 12 months Now married:
50.9% (1,230)Unmarried:
49.1% (1,188)
Ancestries in Mableton
1,484 6.1% Irish1,133 4.6% Nigerian993 4.1% American891 3.6% German740 3.0% English659 2.7% European616 2.5% African304 1.2% Jamaican254 1.0% Haitian205 0.8% Italian190 0.8% Ghanaian94 0.4% Canadian88 0.4% Polish87 0.4% British74 0.3% Scottish65 0.3% French65 0.3% Guyanese57 0.2% Greek56 0.2% Scotch-Irish51 0.2% West Indian44 0.2% Northern European41 0.2% Scandinavian40 0.2% Eastern European40 0.2% Portuguese34 0.1% Liberian32 0.1% Russian31 0.1% Welsh29 0.1% Ethiopian29 0.1% Brazilian27 0.1% Kenyan26 0.1% Norwegian18 0.07% Romanian16 0.07% Swedish14 0.06% Lebanese8 0.03% British West Indian7 0.03% Dutch6 0.02% Ugandan6 0.02% Trinidadian and Tobagonian3 0.01% Bulgarian
Geographical mobility in Mableton Same house 1 year ago 14,722 90.4% White (Caucasian)15,812 88.7% Black or African American495 90.3% American Indian / Alaska Native773 91.9% Asian15 28.6% Native Hawaiian / Pacific Islander2,033 83.1% Other race3,031 94.8% Two or more races11,168 89.3% White alone, not Hispanic / Latino8,690 91.2% Hispanic or LatinoMoved within same county 893 5.5% White / Caucasian1,262 7.1% Black or African American24 2.8% Asian262 10.7% Other race4 0.1% Two or more races704 5.6% White alone, not Hispanic / Latino643 6.7% Hispanic or LatinoMoved within same state 475 2.9% White / Caucasian116 0.6% Black or African American63 11.6% American Indian / Alaska Native1 0.1% Asian61 2.5% Other race83 2.6% Two or more races457 3.6% White alone, not Hispanic / Latino153 1.6% Hispanic or LatinoMoved from different state 99 0.6% White / Caucasian319 1.8% Black or African American28 3.4% Asian22 42.1% Native Hawaiian / Pacific Islander66 2.7% Other race99 3.1% Two or more races100 0.8% White alone, not Hispanic / Latino99 1.0% Hispanic or LatinoMoved from abroad 6 0.0% White45 0.3% Black or African American21 2.5% Asian7 0.1% White alone, not Hispanic / Latino
Children Nativity (place of birth) in Mableton
Children under 6 years - Living with two parents Both parents native 1,155 100.0% NativeBoth parents foreign-born 930 100.0% NativeOne native, one foreign-born parent 382 100.0% NativeChildren under 6 years - Living with one parent Native parent 464 100.0% NativeForeign-born parent 699 97.1% Native21 2.9% Foreign-bornChildren 6 to 17 years - Living with two parents Both parents native 2,036 98.7% Native27 1.3% Foreign-bornBoth parents foreign-born 1,427 91.1% Native140 8.9% Foreign-bornOne native, one foreign-born parent 566 100.0% NativeChildren 6 to 17 years - Living with one parent Native parent 974 100.0% NativeForeign-born parent 618 56.4% Native477 43.6% Foreign-born
Grandparents responsible for own grandchildren in Mableton
Grandparents (30 to 59 years) White / Caucasian 26 17.0% Responsible for grandchildren127 83.0% Not responsible for grandchildrenBlack or African American 195 60.4% Responsible for grandchildren128 39.6% Not responsible for grandchildrenAsian 7 100.0% Not responsible for grandchildrenWhite alone, not Hispanic / Latino 17 19.6% Responsible for grandchildren71 80.4% Not responsible for grandchildrenHispanic or Latino 56 100.0% Not responsible for grandchildrenGrandparents (60 years and over) White / Caucasian 500 100.0% Not responsible for grandchildrenBlack or African American 47 20.5% Responsible for grandchildren182 79.5% Not responsible for grandchildrenAsian 16 100.0% Not responsible for grandchildrenWhite alone, not Hispanic / Latino 497 100.0% Not responsible for grandchildrenHispanic or Latino 7 8.6% Responsible for grandchildren69 91.4% Not responsible for grandchildren