Lynnwood, WA (Washington) Houses and Residents
| Lynnwood: | $717,291 |
| Washington: | $569,500 |
Mean price in 2022:
Detached houses: $762,477
Here: $762,477 State: $734,307 Townhouses or other attached units: $509,508
Here: $509,508 State: $657,697 In 2-unit structures: $698,341
Here: $698,341 State: $534,634 In 3-to-4-unit structures: $283,392
Here: $283,392 State: $510,239 In 5-or-more-unit structures: $292,270
Here: $292,270 State: $503,183 Mobile homes: $65,889
Here: $65,889 State: $218,362
Total population: 36,687 (Urban population: 33,730, Rural population: 0)
Houses: 17,125 (16,324 occupied: 8,469 owner occupied, 7,719 renter occupied)
| % of renters here: | 48% |
| State: | 36% |
Housing density: 2,242 houses/condos per square mile
Median price asked for vacant for-sale houses and condos in 2022: $755,456.
Median contract rent in 2022: $1,511 (lower quartile is $1,260, upper quartile is $1,848)
Median rent asked for vacant for-rent units in 2022: $1,703
Median gross rent in Lynnwood, WA in 2022: $1,629
Housing units in Lynnwood with a mortgage: 5,806 (589 second mortgage, 28 home equity loan, 461 both second mortgage and home equity loan)
Houses without a mortgage: 76
Median household income for houses/condos with a mortgage: $120,437
Median household income for apartments without a mortgage: $72,591
Median monthly housing costs: $1,682
Compare current foreclosures in Lynnwood, WA:
| Photo | Address | Area | Beds / Baths | Price | Details |
|---|---|---|---|---|---|

|
#1
20th Ave W
Lynnwood, WA 98037
|
912 sq. feet
|
1 baths 3 beds |
show details | |

|
#2
147th St SW
Lynnwood, WA 98087
|
1,770 sq. feet
|
2 baths 4 beds |
show details | |

|
#3
181st Pl SW
Lynnwood, WA 98037
|
1,868 sq. feet
|
2 baths 3 beds |
show details | |

|
#4
153rd St SW
Lynnwood, WA 98087
|
2,265 sq. feet
|
2 baths 4 beds |
show details | |

|
#5
144th Pl SW
Lynnwood, WA 98087
|
3,214 sq. feet
|
3 baths 5 beds |
show details | |

|
#6
18th Ave W
Lynnwood, WA 98087
|
1,302 sq. feet
|
2 baths 3 beds |
show details | |

|
#7
64th Ave W
Lynnwood, WA 98037
|
2,640 sq. feet
|
2 baths 4 beds |
show details | |

|
#8
172nd Pl SW
Lynnwood, WA 98037
|
1,554 sq. feet
|
2 baths 3 beds |
show details | |

|
#9
23rd Ave W
Lynnwood, WA 98036
|
2,210 sq. feet
|
2 baths 3 beds |
show details | |

|
#10
Shelby Rd # B
Lynnwood, WA 98087
|
3,496 sq. feet
|
5 baths 6 beds |
show details |
| Photo | Address | Area | Beds / Baths | Price | Details |
|---|---|---|---|---|---|

|
#11
188th St SW
Lynnwood, WA 98037
|
2,332 sq. feet
|
2 baths 5 beds |
show details | |

|
#12
60th Ave W
Lynnwood, WA 98037
|
1,346 sq. feet
|
1 baths 3 beds |
show details | |

|
#13
11th Pl W
Lynnwood, WA 98037
|
1,472 sq. feet
|
1 baths 3 beds |
show details | |

|
#14
37th Pl W
Lynnwood, WA 98037
|
2,104 sq. feet
|
3 baths 4 beds |
show details | |

|
#15
64th Ave W
Lynnwood, WA 98036
|
1,429 sq. feet
|
1 baths 2 beds |
show details | |

|
#16
204th St SW # A
Lynnwood, WA 98036
|
2,648 sq. feet
|
2 baths 5 beds |
show details | |

|
#17
176th Pl SW
Lynnwood, WA 98037
|
2,523 sq. feet
|
3 baths 4 beds |
show details | |

|
#18
2nd Pl W # A
Lynnwood, WA 98087
|
2,549 sq. feet
|
5 baths 6 beds |
show details | |

|
#19
188th Pl SW
Lynnwood, WA 98036
|
1,505 sq. feet
|
3 baths 3 beds |
show details | |

|
#20
Cypress Way
Lynnwood, WA 98036
|
1,824 sq. feet
|
1 baths 3 beds |
show details |
| Photo | Address | Area | Beds / Baths | Price | Details |
|---|---|---|---|---|---|

|
#21
144th Pl SW
Lynnwood, WA 98087
|
3,083 sq. feet
|
3 baths 4 beds |
show details | |

|
#22
47th Ave W
Lynnwood, WA 98036
|
1,360 sq. feet
|
1 baths 3 beds |
show details | |

|
#23
176th St SW
Lynnwood, WA 98037
|
936 sq. feet
|
1 baths 3 beds |
show details | |

|
#24
Madison Way
Lynnwood, WA 98087
|
1,424 sq. feet
|
2 baths 3 beds |
show details | |

|
#25
142nd St SW
Lynnwood, WA 98087
|
2,055 sq. feet
|
2 baths 4 beds |
show details | |

|
#26
44th Ave W
Lynnwood, WA 98087
|
1,633 sq. feet
|
2 baths 3 beds |
show details | |

|
#27
Larch Way
Lynnwood, WA 98036
|
2,178 sq. feet
|
3 baths 3 beds |
show details | |

|
#28
189th Pl SW
Lynnwood, WA 98036
|
2,392 sq. feet
|
2 baths 3 beds |
show details | |

|
#29
Serene Way
Lynnwood, WA 98087
|
978 sq. feet
|
1 baths 3 beds |
show details | |

|
#30
200th St SW Unit 3
Lynnwood, WA 98036
|
672 sq. feet
|
- baths 2 beds |
show details |
| Photo | Address | Area | Beds / Baths | Price | Details |
|---|---|---|---|---|---|

|
#31
Admiralty Way Unit 14
Lynnwood, WA 98087
|
480 sq. feet
|
- baths 1 beds |
show details | |

|
#32
168th St Sw, Apt A10
Lynnwood, WA 98037
|
- sq. feet
|
- baths - beds |
show details | |

|
#33
164th St SW Apt 1111
Lynnwood, WA 98087
|
- sq. feet
|
- baths - beds |
show details | |

|
#34
Larch Way Unit A-2
Lynnwood, WA 98037
|
- sq. feet
|
- baths - beds |
show details | |

|
#35
176th St SW Apt F
Lynnwood, WA 98037
|
- sq. feet
|
- baths - beds |
show details | |

|
#36
148th St SW Apt C108
Lynnwood, WA 98087
|
- sq. feet
|
- baths - beds |
show details | |

|
#37
176th St SW Apt C
Lynnwood, WA 98037
|
- sq. feet
|
- baths - beds |
show details | |

|
#38
Admiralty Way Apt M307
Lynnwood, WA 98087
|
- sq. feet
|
- baths - beds |
show details | |

|
#39
Damson Rd # P1
Lynnwood, WA 98036
|
- sq. feet
|
- baths - beds |
show details | |

|
#40
Mukilteo Speedway, Apt W
Lynnwood, WA 98087
|
- sq. feet
|
- baths - beds |
show details |
| Photo | Address | Area | Beds / Baths | Price | Details |
|---|---|---|---|---|---|

|
#41
Lincoln Way Apt F102
Lynnwood, WA 98087
|
- sq. feet
|
- baths - beds |
show details | |

|
#42
Alderwood Mall Pkwy, Unit 684
Lynnwood, WA 98037
|
- sq. feet
|
- baths - beds |
show details | |

|
#43
196th St Sw, # B819
Lynnwood, WA 98036
|
11,440 sq. feet
|
- baths - beds |
show details | |

|
#44
40th Ave W, Unit 324
Lynnwood, WA 98036
|
- sq. feet
|
- baths - beds |
show details | |

|
#45
164th St SW Apt 323
Lynnwood, WA 98087
|
- sq. feet
|
- baths - beds |
show details | |

|
#46
40th Ave W, Unit 539
Lynnwood, WA 98036
|
- sq. feet
|
- baths - beds |
show details | |

|
#47
Ash Way Apt A4
Lynnwood, WA 98087
|
- sq. feet
|
- baths - beds |
show details | |

|
#48
132nd St SW Apt 6
Lynnwood, WA 98087
|
- sq. feet
|
- baths - beds |
show details | |

|
#49
196th St SW Apt G1
Lynnwood, WA 98036
|
- sq. feet
|
- baths - beds |
show details | |

|
Check over 1 million property listings on Foreclosure.com!
|
browse all offers | |||

Latest news about housing in Lynnwood, WA collected exclusively by city-data.com from local newspapers, TV, and radio stations


Median year apartment built: 1980
Household type by relationship:
Households: 40,432- Male householders: 7,797 (1,839 living alone), Female householders: 8,243 (2,908 living alone)
6,708 spouses (6,648 opposite-sex spouses), 1,798 unmarried partners, (1,760 opposite-sex unmarried partners), 10,502 children (10,152 natural, 25 adopted, 324 stepchildren), 733 grandchildren, 484 brothers or sisters, 1,059 parents, 0 foster children, 707 other relatives, 1,570 non-relatives
- In group quarters: 824
Size of family households: 3,768 2-persons, 2,248 3-persons, 1,924 4-persons, 876 5-persons, 244 6-persons, 343 7-or-more-persons.
Size of nonfamily households: 5,059 1-person, 1,793 2-persons, 84 3-persons, 10 4-persons, 14 5-persons.
5,356 married couples with children.
1,534 single-parent households (382 men, 1,152 women).
61.9% of residents of Lynnwood speak English at home.
10.4% of residents speak Spanish at home (57% speak English very well, 16% speak English well, 15% speak English not well, 12% don't speak English at all).
8.1% of residents speak other Indo-European language at home (57% speak English very well, 22% speak English well, 15% speak English not well, 6% don't speak English at all).
14.6% of residents speak Asian or Pacific Island language at home (45% speak English very well, 34% speak English well, 18% speak English not well, 3% don't speak English at all).
4.8% of residents speak other language at home (58% speak English very well, 38% speak English well, 3% speak English not well).
Foreign born population: 12,579 (31.1%)
(58.6% of them are naturalized citizens)
| Here: | 6.4 |
| State: | 6.5 |
| Here: | 3.5 |
| State: | 3.9 |

- Bedrooms in owner-occupied houses and condos in Lynnwood, Washington
- 26no bedroom
- 3111 bedroom
- 1,1962 bedrooms
- 3,9523 bedrooms
- 2,1654 bedrooms
- 8215+ bedrooms

- Bedrooms in renter-occupied apartments in Lynnwood, Washington
- 583no bedroom
- 2,2631 bedroom
- 3,6102 bedrooms
- 1,0113 bedrooms
- 1984 bedrooms
- 545+ bedrooms

- Cars and other vehicles available in Lynnwood in owner-occupied houses/condos
- 311no vehicle
- 2,2451 vehicle
- 3,4832 vehicles
- 1,3303 vehicles
- 7904 vehicles
- 3115+ vehicles

- Cars and other vehicles available in Lynnwood in renter-occupied apartments
- 1,917no vehicle
- 2,6351 vehicle
- 2,5642 vehicles
- 4543 vehicles
- 564 vehicles
- 935+ vehicles

- Rooms in owner-occupied houses in Lynnwood, Washington
- 261 room
- 1362 rooms
- 1983 rooms
- 9924 rooms
- 1,3915 rooms
- 1,7486 rooms
- 1,2697 rooms
- 1,2518 rooms
- 1,4609+ rooms

- Rooms in renter-occupied apartments in Lynnwood, Washington
- 5421 room
- 9772 rooms
- 2,0333 rooms
- 2,0784 rooms
- 8855 rooms
- 5116 rooms
- 4707 rooms
- 1328 rooms
- 919+ rooms


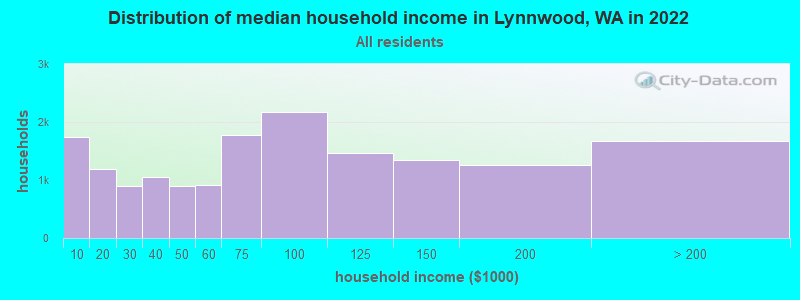
Lynnwood, WA household income distribution

- 1,747Less than $10,000
- 1,185$10,000 to $19,999
- 896$20,000 to $29,999
- 1,055$30,000 to $39,999
- 905$40,000 to $49,999
- 912$50,000 to $59,999
- 1,783$60,000 to $74,999
- 2,171$75,000 to $99,999
- 1,469$100,000 to $124,999
- 1,340$125,000 to $149,999
- 1,252$150,000 to $199,999
- 1,676$200,000 or more
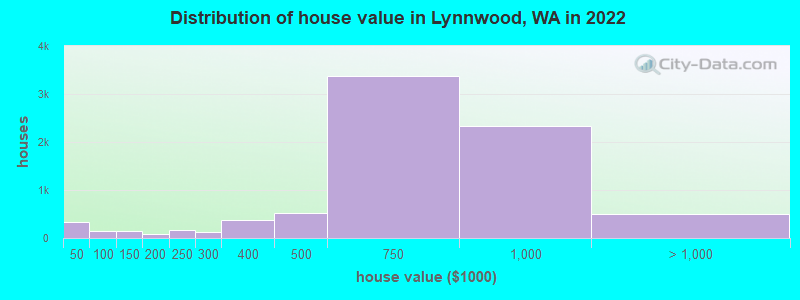
Home value of owner - occupied houses in 2022 in Lynnwood, WA
-
- 152Less than $10,000
- 7$10,000 to $14,999
- 5$15,000 to $19,999
- 81$20,000 to $24,999
- 6$25,000 to $29,999
- 4$30,000 to $34,999
- 82$40,000 to $49,999
- 43$50,000 to $59,999
- 21$60,000 to $69,999
- 107$100,000 to $124,999
- 27$125,000 to $149,999
- 69$150,000 to $174,999
- 18$175,000 to $199,999
- 171$200,000 to $249,999
- 122$250,000 to $299,999
- 370$300,000 to $399,999
- 526$400,000 to $499,999
- 3,367$500,000 to $749,999
- 2,340$750,000 to $999,999
- 404$1,000,000 to $1,499,999
- 61$1,500,000 to $1,999,999
- 25$2,000,000 or more
Rent paid by renters in 2022 in Lynnwood, WA
-
- 31Less than $100
- 14$100 to $149
- 35$150 to $199
- 127$200 to $249
- 103$300 to $349
- 99$350 to $399
- 11$500 to $549
- 7$550 to $599
- 217$600 to $649
- 80$650 to $699
- 8$700 to $749
- 11$750 to $799
- 75$800 to $899
- 74$900 to $999
- 965$1,000 to $1,249
- 1,764$1,250 to $1,499
- 3,083$1,500 to $1,999
- 473$2,000 to $2,499
- 127$2,500 to $2,999
- 28$3,000 to $3,499
- 242$3,500 or more
- 126No cash rent


Percentage of workers working in this county: 58.8%
Number of people working at home: 3,172 (15.7% of all workers)
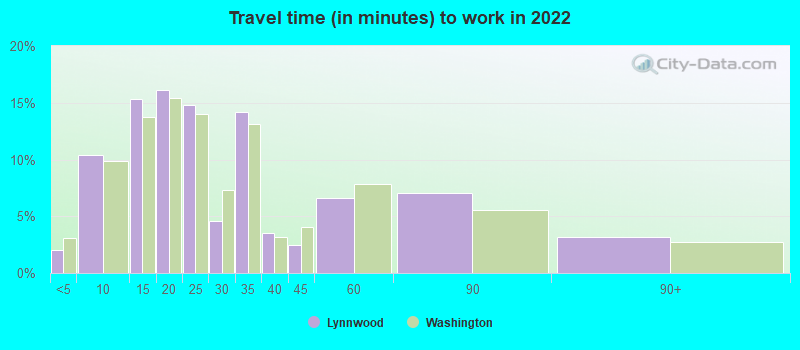
Travel time to work (commute)
- Less than 5 minutes: 334
- 5 to 9 minutes: 1,838
- 10 to 14 minutes: 1,659
- 15 to 19 minutes: 2,361
- 20 to 24 minutes: 1,805
- 25 to 29 minutes: 954
- 30 to 34 minutes: 3,166
- 35 to 39 minutes: 761
- 40 to 44 minutes: 679
- 45 to 59 minutes: 1,153
- 60 to 89 minutes: 1,382
- 90 or more minutes: 660
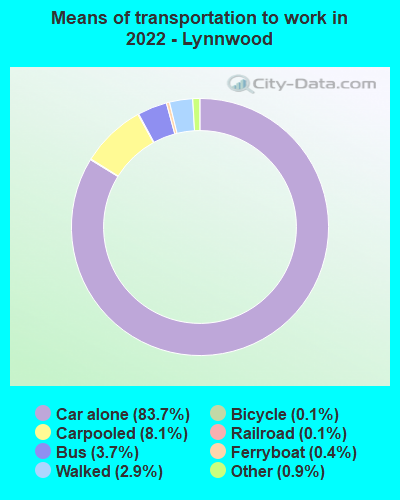
Means of transportation to work:
- Drove a car alone: 20,096 (69.0%)
- Carpooled: 2,068 (7.1%)
- Bus: 1,215 (4.2%)
- Light rail, streetcar or trolley: 78 (0.3%)
- Ferryboat: 138 (0.5%)
- Taxi: 248 (0.9%)
- Bicycle: 14 (0.0%)
- Walked: 846 (2.9%)
- Worked at home: 3,172 (10.9%)

- Unemployment by race in 2022
- Unemployment rate for White non-Hispanic residents
- 2.3%Males
- 4.1%Females
- Unemployment rate for Black residents
- 2.3%Males
- Unemployment rate for Asian residents
- 6.8%Males
- 5.6%Females
- Unemployment rate for other race residents
- 15.6%Females
- Unemployment rate for two or more race residents
- 2.2%Males
- 0.8%Females
- Unemployment rate for Hispanic or Latino residents
- 2.0%Males
- 4.3%Females

- Year of entry for the foreign-born population in Lynnwood, Washington
- 4,0182010 or later
- 3,7192000 to 2009
- 1,9951990 to 1999
- 1,7121980 to 1989
- 9371970 to 1979
- 623Before 1970

First ancestries reported:
- English: 1,216 (5.9%)
- Ethiopian: 1,118 (5.4%)
- German: 1,108 (5.3%)
- European: 822 (4.0%)
- American: 669 (3.2%)
- African: 560 (2.7%)
- Irish: 432 (2.1%)
- Norwegian: 403 (1.9%)
- Armenian: 247 (1.2%)
- Russian: 163 (0.8%)
- Polish: 152 (0.7%)
- Ukrainian: 135 (0.7%)
- Lebanese: 125 (0.6%)
- Swedish: 121 (0.6%)
- Serbian: 120 (0.6%)
- Scandinavian: 111 (0.5%)
- Italian: 102 (0.5%)
- Scotch-Irish: 99 (0.5%)
- Portuguese: 95 (0.5%)
- Ghanaian: 93 (0.4%)
- Czech: 90 (0.4%)
- Yugoslavian: 86 (0.4%)
- Danish: 86 (0.4%)
- Lithuanian: 85 (0.4%)
- Bulgarian: 77 (0.4%)
- Slavic: 74 (0.4%)
- Northern European: 73 (0.4%)
- Scottish: 73 (0.4%)
- Dutch: 72 (0.3%)
- Iranian: 60 (0.3%)
- Belgian: 59 (0.3%)
- British: 48 (0.2%)
- French Canadian: 45 (0.2%)
- Nigerian: 45 (0.2%)
- Turkish: 30 (0.1%)
- French: 29 (0.1%)
- Slovak: 29 (0.1%)
- British West Indian: 24 (0.1%)
- Welsh: 23 (0.1%)
- Icelander: 21 (0.1%)
- Romanian: 20 (0.10%)
- Canadian: 20 (0.10%)
- Estonian: 19 (0.09%)
- Egyptian: 14 (0.07%)
- Finnish: 14 (0.07%)
- Croatian: 7 (0.03%)
- Eastern European: 6 (0.03%)
- Swiss: 3 (0.01%)
Most common places of birth for foreign-born residents (%):
| Lynnwood: | 13.9% (1,737) |
| Washington: | 21.1% (241,655) |
| Lynnwood: | 8.9% (1,115) |
| Washington: | 1.6% (17,938) |
| Lynnwood: | 8.7% (1,085) |
| Washington: | 4.3% (48,886) |
| Lynnwood: | 8.6% (1,079) |
| Washington: | 6.3% (71,661) |
| Lynnwood: | 7.2% (898) |
| Washington: | 8.9% (101,353) |
| Lynnwood: | 6.3% (788) |
| Washington: | 5.4% (62,003) |
| Lynnwood: | 5.0% (621) |
| Washington: | 7.4% (84,470) |
| Lynnwood: | 2.7% (334) |
| Washington: | 0.1% (982) |
| Lynnwood: | 2.4% (306) |
| Washington: | 0.4% (4,688) |
| Lynnwood: | 2.4% (301) |
| Washington: | 1.0% (10,993) |
| Lynnwood: | 2.1% (267) |
| Washington: | 0.3% (3,995) |
| Lynnwood: | 1.9% (236) |
| Washington: | 0.1% (1,170) |
| Lynnwood: | 1.7% (217) |
| Washington: | 1.9% (21,540) |
Place of birth for U.S.-born residents:
- This state: 16,786
- Other state: 10,220
- Northeast: 1,247
- Midwest: 2,111
- South: 1,845
- West: 4,998
85.5% of Lynnwood residents lived in the same house 1 years ago.
Out of people who lived in different houses, 34.4% lived in this county.
Out of people who lived in different counties, 64.7% lived in Washington.
| Lynnwood: | 85.5% |
| State average: | 85.2% |
Education attainment for males 25 years and older:
- No schooling: 347
- Nursery to 4th grade: 88
- 5th and 6th grade: 104
- 7th and 8th grade: 119
- 9th grade: 81
- 10th grade: 344
- 11th grade: 212
- 12th grade, no diploma: 431
- High school graduate (or equivalency): 3,174
- Less than 1 year of college: 916
- Some college more than 1 year, no degree: 2,404
- Associate degree: 1,565
- Bachelor's degree: 3,317
- Master's degree: 813
- Professional school degree: 126
- Doctorate degree: 210

Education attainment for females 25 years and older:
- No schooling: 347
- Nursery to 4th grade: 105
- 5th and 6th grade: 126
- 7th and 8th grade: 216
- 9th grade: 126
- 10th grade: 383
- 11th grade: 166
- 12th grade, no diploma: 416
- High school graduate (or equivalency): 2,791
- Less than 1 year of college: 1,038
- Some college more than 1 year, no degree: 2,331
- Associate degree: 1,797
- Bachelor's degree: 3,419
- Master's degree: 1,567
- Professional school degree: 284
- Doctorate degree: 179


Housing units in structures:
- One, detached: 8,196
- One, attached: 606
- Two: 490
- 3 or 4: 1,280
- 5 to 9: 1,472
- 10 to 19: 1,265
- 20 to 49: 978
- 50 or more: 2,301
- Mobile homes: 532
Housing units lacking complete kitchen facilities in 2022: 0.5%
House/condo owner moved in on average 12 years ago
Renter moved in on average 5 years ago

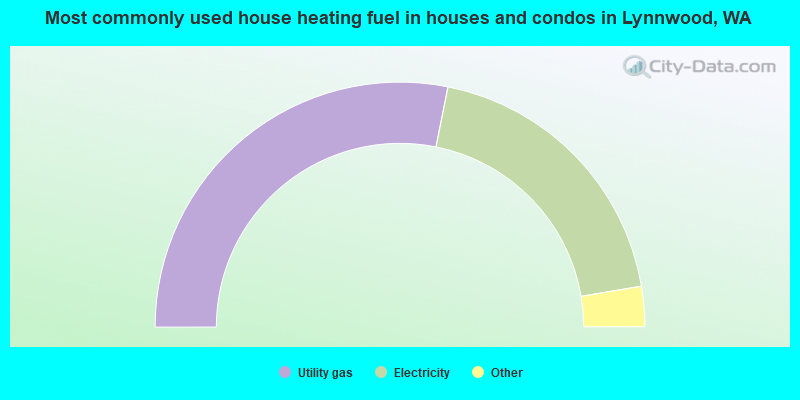
- 56.3%Utility gas
- 38.4%Electricity
- 3.2%Fuel oil, kerosene, etc.
- 1.9%Bottled, tank, or LP gas
- 0.2%Wood
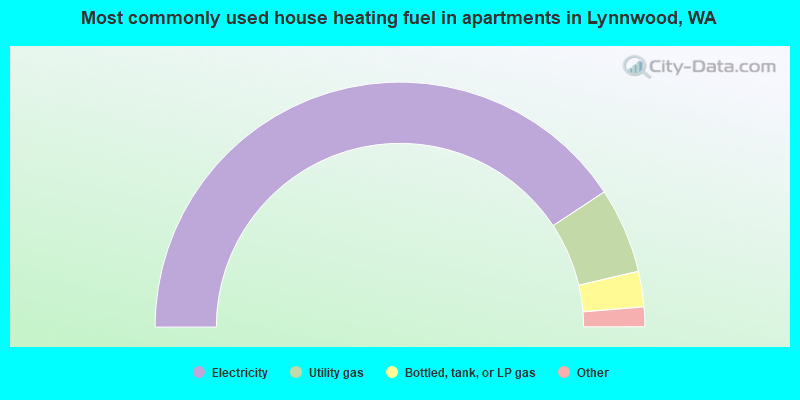
- 81.4%Electricity
- 11.3%Utility gas
- 4.7%Bottled, tank, or LP gas
- 2.0%No fuel used
- 0.6%Wood
Private vs. public school enrollment:
| Here: | 15.2% |
| Washington: | 12.4% |
| Here: | 8.4% |
| Washington: | 9.2% |
| Here: | 10.0% |
| Washington: | 16.5% |


