Races in Lynnwood, Washington (WA) Detailed Stats
Data:
Races - White alone (%)
Races - White alone (% change since 2000)
Races - Black alone (%)
Races - Black alone (% change since 2000)
Races - American Indian alone (%)
Races - American Indian alone (% change since 2000)
Races - Asian alone (%)
Races - Asian alone (% change since 2000)
Races - Hispanic (%)
Races - Hispanic (% change since 2000)
Races - Native Hawaiian and Other Pacific Islander alone (%)
Races - Native Hawaiian and Other Pacific Islander alone (% change since 2000)
Races - Two or more races(%)
Races - Two or more races(% change since 2000)
Races - Other race alone (%)
Races - Other race alone (% change since 2000)
Racial diversity
Place of birth - Born in state of residence (%)
Place of birth - Born in state of residence (%) - White
Place of birth - Born in state of residence (%) - Black or African American
Place of birth - Born in state of residence (%) - Asian
Place of birth - Born in state of residence (%) - Hispanic or Latino
Place of birth - Born in state of residence (%) - American Indian and Alaska Native
Place of birth - Born in state of residence (%) - Multirace
Place of birth - Born in state of residence (%) - Other Race
Place of birth - Born in other state (%)
Place of birth - Born in other state (%) - White
Place of birth - Born in other state (%) - Black or African American
Place of birth - Born in other state (%) - Asian
Place of birth - Born in other state (%) - Hispanic or Latino
Place of birth - Born in other state (%) - American Indian and Alaska Native
Place of birth - Born in other state (%) - Multirace
Place of birth - Born in other state (%) - Other Race
Place of birth - Native, outside of US (%)
Place of birth - Native, outside of US (%) - White
Place of birth - Native, outside of US (%) - Black or African American
Place of birth - Native, outside of US (%) - Asian
Place of birth - Native, outside of US (%) - Hispanic or Latino
Place of birth - Native, outside of US (%) - American Indian and Alaska Native
Place of birth - Native, outside of US (%) - Multirace
Place of birth - Native, outside of US (%) - Other Race
Place of birth - Foreign born (%)
Place of birth - Foreign born (%) - White
Place of birth - Foreign born (%) - Black or African American
Place of birth - Foreign born (%) - Asian
Place of birth - Foreign born (%) - Hispanic or Latino
Place of birth - Foreign born (%) - American Indian and Alaska Native
Place of birth - Foreign born (%) - Multirace
Place of birth - Foreign born (%) - Other Race
Residents speaking English at home (%)
Residents speaking English at home - Born in the United States (%)
Residents speaking English at home - Native, born elsewhere (%)
Residents speaking English at home - Foreign born (%)
Residents speaking Spanish at home (%)
Residents speaking Spanish at home - Born in the United States (%)
Residents speaking Spanish at home - Native, born elsewhere (%)
Residents speaking Spanish at home - Foreign born (%)
Residents speaking other language at home (%)
Residents speaking other language at home - Born in the United States (%)
Residents speaking other language at home - Native, born elsewhere (%)
Residents speaking other language at home - Foreign born (%)
Marital status - Never married (%)
Marital status - Now married (%)
Marital status - Separated (%)
Marital status - Widowed (%)
Marital status - Divorced (%)
Ancestries Reported - Arab (%)
Ancestries Reported - Czech (%)
Ancestries Reported - Danish (%)
Ancestries Reported - Dutch (%)
Ancestries Reported - English (%)
Ancestries Reported - French (%)
Ancestries Reported - French Canadian (%)
Ancestries Reported - German (%)
Ancestries Reported - Greek (%)
Ancestries Reported - Hungarian (%)
Ancestries Reported - Irish (%)
Ancestries Reported - Italian (%)
Ancestries Reported - Lithuanian (%)
Ancestries Reported - Norwegian (%)
Ancestries Reported - Polish (%)
Ancestries Reported - Portuguese (%)
Ancestries Reported - Russian (%)
Ancestries Reported - Scotch-Irish (%)
Ancestries Reported - Scottish (%)
Ancestries Reported - Slovak (%)
Ancestries Reported - Subsaharan African (%)
Ancestries Reported - Swedish (%)
Ancestries Reported - Swiss (%)
Ancestries Reported - Ukrainian (%)
Ancestries Reported - United States (%)
Ancestries Reported - Welsh (%)
Ancestries Reported - West Indian (%)
Ancestries Reported - Other (%)
Geographical mobility - Same house 1 year ago (%)
Geographical mobility - Same house 1 year ago (%) - White
Geographical mobility - Same house 1 year ago (%) - Black or African American
Geographical mobility - Same house 1 year ago (%) - Asian
Geographical mobility - Same house 1 year ago (%) - Hispanic or Latino
Geographical mobility - Same house 1 year ago (%) - American Indian and Alaska Native
Geographical mobility - Same house 1 year ago (%) - Multirace
Geographical mobility - Same house 1 year ago (%) - Other Race
Geographical mobility - Moved within same county (%)
Geographical mobility - Moved within same county (%) - White
Geographical mobility - Moved within same county (%) - Black or African American
Geographical mobility - Moved within same county (%) - Asian
Geographical mobility - Moved within same county (%) - Hispanic or Latino
Geographical mobility - Moved within same county (%) - American Indian and Alaska Native
Geographical mobility - Moved within same county (%) - Multirace
Geographical mobility - Moved within same county (%) - Other Race
Geographical mobility - Moved from different county within same state (%)
Geographical mobility - Moved from different county within same state (%) - White
Geographical mobility - Moved from different county within same state (%) - Black or African American
Geographical mobility - Moved from different county within same state (%) - Asian
Geographical mobility - Moved from different county within same state (%) - Hispanic or Latino
Geographical mobility - Moved from different county within same state (%) - American Indian and Alaska Native
Geographical mobility - Moved from different county within same state (%) - Multirace
Geographical mobility - Moved from different county within same state (%) - Other Race
Geographical mobility - Moved from different state (%)
Geographical mobility - Moved from different state (%) - White
Geographical mobility - Moved from different state (%) - Black or African American
Geographical mobility - Moved from different state (%) - Asian
Geographical mobility - Moved from different state (%) - Hispanic or Latino
Geographical mobility - Moved from different state (%) - American Indian and Alaska Native
Geographical mobility - Moved from different state (%) - Multirace
Geographical mobility - Moved from different state (%) - Other Race
Geographical mobility - Moved from abroad (%)
Geographical mobility - Moved from abroad (%) - White
Geographical mobility - Moved from abroad (%) - Black or African American
Geographical mobility - Moved from abroad (%) - Asian
Geographical mobility - Moved from abroad (%) - Hispanic or Latino
Geographical mobility - Moved from abroad (%) - American Indian and Alaska Native
Geographical mobility - Moved from abroad (%) - Multirace
Geographical mobility - Moved from abroad (%) - Other Race
Place of birth for the foreign-born population - Ireland (%)
Place of birth for the foreign-born population - Denmark (%)
Place of birth for the foreign-born population - Norway (%)
Place of birth for the foreign-born population - Sweden (%)
Place of birth for the foreign-born population - United Kingdom (%)
Place of birth for the foreign-born population - England (%)
Place of birth for the foreign-born population - Scotland (%)
Place of birth for the foreign-born population - Other Northern Europe (%)
Place of birth for the foreign-born population - Austria (%)
Place of birth for the foreign-born population - Belgium (%)
Place of birth for the foreign-born population - France (%)
Place of birth for the foreign-born population - Germany (%)
Place of birth for the foreign-born population - Netherlands (%)
Place of birth for the foreign-born population - Switzerland (%)
Place of birth for the foreign-born population - Other Western Europe (%)
Place of birth for the foreign-born population - Greece (%)
Place of birth for the foreign-born population - Italy (%)
Place of birth for the foreign-born population - Portugal (%)
Place of birth for the foreign-born population - Spain (%)
Place of birth for the foreign-born population - Other Southern Europe (%)
Place of birth for the foreign-born population - Albania (%)
Place of birth for the foreign-born population - Belarus (%)
Place of birth for the foreign-born population - Bosnia and Herzegovina (%)
Place of birth for the foreign-born population - Bulgaria (%)
Place of birth for the foreign-born population - Croatia (%)
Place of birth for the foreign-born population - Czechoslovakia (%)
Place of birth for the foreign-born population - Hungary (%)
Place of birth for the foreign-born population - Latvia (%)
Place of birth for the foreign-born population - Lithuania (%)
Place of birth for the foreign-born population - North Macedonia (Macedonia) (%)
Place of birth for the foreign-born population - Moldova (%)
Place of birth for the foreign-born population - Poland (%)
Place of birth for the foreign-born population - Romania (%)
Place of birth for the foreign-born population - Russia (%)
Place of birth for the foreign-born population - Serbia (%)
Place of birth for the foreign-born population - Ukraine (%)
Place of birth for the foreign-born population - Other Eastern Europe (%)
Place of birth for the foreign-born population - China (%)
Place of birth for the foreign-born population - Hong Kong (%)
Place of birth for the foreign-born population - Taiwan (%)
Place of birth for the foreign-born population - Japan (%)
Place of birth for the foreign-born population - Korea (%)
Place of birth for the foreign-born population - Other Eastern Asia (%)
Place of birth for the foreign-born population - Afghanistan (%)
Place of birth for the foreign-born population - Bangladesh (%)
Place of birth for the foreign-born population - India (%)
Place of birth for the foreign-born population - Iran (%)
Place of birth for the foreign-born population - Kazakhstan (%)
Place of birth for the foreign-born population - Nepal (%)
Place of birth for the foreign-born population - Pakistan (%)
Place of birth for the foreign-born population - Sri Lanka (%)
Place of birth for the foreign-born population - Uzbekistan (%)
Place of birth for the foreign-born population - Other South Central Asia (%)
Place of birth for the foreign-born population - Burma (%)
Place of birth for the foreign-born population - Cambodia (%)
Place of birth for the foreign-born population - Indonesia (%)
Place of birth for the foreign-born population - Laos (%)
Place of birth for the foreign-born population - Malaysia (%)
Place of birth for the foreign-born population - Philippines (%)
Place of birth for the foreign-born population - Singapore (%)
Place of birth for the foreign-born population - Thailand (%)
Place of birth for the foreign-born population - Vietnam (%)
Place of birth for the foreign-born population - Other South Eastern Asia (%)
Place of birth for the foreign-born population - Armenia (%)
Place of birth for the foreign-born population - Iraq (%)
Place of birth for the foreign-born population - Israel (%)
Place of birth for the foreign-born population - Jordan (%)
Place of birth for the foreign-born population - Kuwait (%)
Place of birth for the foreign-born population - Lebanon (%)
Place of birth for the foreign-born population - Saudi Arabia (%)
Place of birth for the foreign-born population - Syria (%)
Place of birth for the foreign-born population - Turkey (%)
Place of birth for the foreign-born population - Yemen (%)
Place of birth for the foreign-born population - Other Western Asia (%)
Place of birth for the foreign-born population - Eritrea (%)
Place of birth for the foreign-born population - Ethiopia (%)
Place of birth for the foreign-born population - Kenya (%)
Place of birth for the foreign-born population - Somalia (%)
Place of birth for the foreign-born population - Uganda (%)
Place of birth for the foreign-born population - Zimbabwe (%)
Place of birth for the foreign-born population - Other Eastern Africa (%)
Place of birth for the foreign-born population - Cameroon (%)
Place of birth for the foreign-born population - Congo (%)
Place of birth for the foreign-born population - Democratic Republic of Congo (Zaire) (%)
Place of birth for the foreign-born population - Other Middle Africa (%)
Place of birth for the foreign-born population - Egypt (%)
Place of birth for the foreign-born population - Morocco (%)
Place of birth for the foreign-born population - Sudan (%)
Place of birth for the foreign-born population - Other Northern Africa (%)
Place of birth for the foreign-born population - South Africa (%)
Place of birth for the foreign-born population - Other Southern Africa (%)
Place of birth for the foreign-born population - Cabo Verde (%)
Place of birth for the foreign-born population - Ghana (%)
Place of birth for the foreign-born population - Liberia (%)
Place of birth for the foreign-born population - Nigeria (%)
Place of birth for the foreign-born population - Senegal (%)
Place of birth for the foreign-born population - Sierra Leone (%)
Place of birth for the foreign-born population - Other Western Africa (%)
Place of birth for the foreign-born population - Australia (%)
Place of birth for the foreign-born population - New Zealand (%)
Place of birth for the foreign-born population - Fiji (%)
Place of birth for the foreign-born population - Micronesia (%)
Place of birth for the foreign-born population - Bahamas (%)
Place of birth for the foreign-born population - Barbados (%)
Place of birth for the foreign-born population - Cuba (%)
Place of birth for the foreign-born population - Dominica (%)
Place of birth for the foreign-born population - Dominican Republic (%)
Place of birth for the foreign-born population - Grenada (%)
Place of birth for the foreign-born population - Haiti (%)
Place of birth for the foreign-born population - Jamaica (%)
Place of birth for the foreign-born population - St. Vincent and the Grenadines (%)
Place of birth for the foreign-born population - Trinidad and Tobago (%)
Place of birth for the foreign-born population - West Indies (%)
Place of birth for the foreign-born population - Other Caribbean (%)
Place of birth for the foreign-born population - Belize (%)
Place of birth for the foreign-born population - Costa Rica (%)
Place of birth for the foreign-born population - El Salvador (%)
Place of birth for the foreign-born population - Guatemala (%)
Place of birth for the foreign-born population - Honduras (%)
Place of birth for the foreign-born population - Mexico (%)
Place of birth for the foreign-born population - Nicaragua (%)
Place of birth for the foreign-born population - Panama (%)
Place of birth for the foreign-born population - Other Central America (%)
Place of birth for the foreign-born population - Argentina (%)
Place of birth for the foreign-born population - Bolivia (%)
Place of birth for the foreign-born population - Brazil (%)
Place of birth for the foreign-born population - Chile (%)
Place of birth for the foreign-born population - Colombia (%)
Place of birth for the foreign-born population - Ecuador (%)
Place of birth for the foreign-born population - Guyana (%)
Place of birth for the foreign-born population - Peru (%)
Place of birth for the foreign-born population - Uruguay (%)
Place of birth for the foreign-born population - Venezuela (%)
Place of birth for the foreign-born population - Other South America (%)
Place of birth for the foreign-born population - Canada (%)
Place of birth for the foreign-born population - Other Northern America (%)
Place of birth for the foreign-born population - Other (%)
Latest news about races in Lynnwood, WA collected exclusively by city-data.com from local newspapers, TV, and radio stations
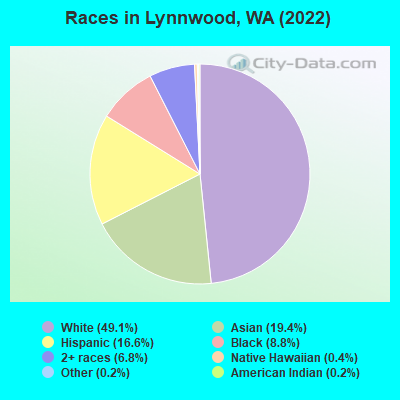
According to 2022 data, the most numerous races in Lynnwood, WA are White alone (19,852 residents), Hispanic (6,726 residents), and Asian alone (7,830 residents). 61.9% of Lynnwood residents speak English at home. 30.9% of Lynnwood, WA residents are foreign-born (15.2% born in Asia, 6.5% born in Latin America, 4.5% born in Africa, 3.4% born in Europe), which is 51.4% greater than the foreign-born rate of 15.0% across the entire state of Washington.
Race distribution in Lynnwood
2000 2022
24,009 70.9% White alone 4,679 13.8% Asian alone 2,356 7.0% Hispanic 1,235 3.6% Two or more races 1,070 3.2% Black alone 314 0.9% American Indian alone 134 0.4% Native Hawaiian and Other 50 0.1% Other race alone
19,852 49.1% White alone 7,830 19.4% Asian alone 6,726 16.6% Hispanic 3,555 8.8% Black alone 2,744 6.8% Two or more races 161 0.4% Native Hawaiian and Other 62 0.2% American Indian alone 69 0.2% Other race alone
2000 2022
4,652,490 78.9% White alone 441,509 7.5% Hispanic 319,401 5.4% Asian alone 184,631 3.1% Black alone 175,926 3.0% Two or more races 85,396 1.4% American Indian alone 22,779 0.4% Native Hawaiian and Other 11,989 0.2% Other race alone
4,941,456 63.5% White alone 1,093,313 14.0% Hispanic 755,832 9.7% Asian alone 523,448 6.7% Two or more races 299,537 3.8% Black alone 69,024 0.9% American Indian alone 52,231 0.7% Native Hawaiian and Other 50,945 0.7% Other race alone
Income and house value in Lynnwood Median household income in 2022 $78,285 White non-Hispanic householders$78,875 Black householdersover $200,000 American Indian and Alaska Native householders$70,148 Asian householders$58,714 Some other race householders$64,367 Two or more races householders$55,635 Hispanic or Latino race householdersMedian 2022 house value $752,240 White Non-Hispanic householders$822,953 Black or African American householders$914,393 American Indian or Alaska Native householders $911,954 Asian householders$761,994 Native Hawaiian and other Pacific Islander householders$773,373 Some other race householders$718,916 Two or more races householders$754,679 Hispanic or Latino householders
Median age by race in Lynnwood
44.3 Median age for White residents41.4 47.3 41.8 Median age for Black or African American residents39.8 44.3 53.0 Median age for American Indian / Alaska Native residents67.8 26.0 43.7 Median age for Asian residents42.2 45.0 40.0 Median age for Native Hawaiian / Pacific Islander residents-661,202,185.1 45.3 25.9 Median age for Other race residents24.8 27.5 27.1 Median age for Two or more races residents28.1 30.8 45.1 Median age for White alone residents42.4 47.5 26.6 Median age for Hispanic or Latino residents26.7 26.7
Owner/renter occupied households by race in Lynnwood
House owners and renters - White residents 5,420 55.5% Owner occupied4,349 44.5% Renter occupiedHouse owners and renters - Black or African American residents 459 32.0% Owner occupied977 68.0% Renter occupiedHouse owners and renters - American Indian / Alaska Native residents 31 48.1% Owner occupied34 51.9% Renter occupiedHouse owners and renters - Asian residents 1,627 61.4% Owner occupied1,024 38.6% Renter occupiedHouse owners and renters - Other race residents 222 32.7% Owner occupied456 67.3% Renter occupiedHouse owners and renters - Two or more races residents 694 38.9% Owner occupied1,090 61.1% Renter occupiedHouse owners and renters - White alone residents 5,313 56.4% Owner occupied4,103 43.6% Renter occupiedHouse owners and renters - Hispanic or Latino residents 516 29.8% Owner occupied1,215 70.2% Renter occupied
Language usage in Lynnwood
English speakers - Total 61.9% of residents of Lynnwood speak English at home.
10.2% of residents speak Spanish at home 2,276 58.9% Speak English very well1,585 41.1% Speak English less than very well28.0% of residents speak other language at home 5,380 50.5% Speak English very well5,266 49.5% Speak English less than very well
English speakers - Born in the United States 89.9% of residents of Lynnwood speak English at home.
6.1% of residents speak Spanish at home 511 83.4% Speak English very well102 16.6% Speak English less than very well4.1% of residents speak other language at home 316 76.1% Speak English very well99 23.9% Speak English less than very well
English speakers - Native, born elsewhere 72.4% of residents of Lynnwood speak English at home.
2.8% of residents speak Spanish at home 29 100.0% Speak English very well25.5% of residents speak other language at home 228 86.0% Speak English very well37 14.0% Speak English less than very well
English speakers - Foreign-born 10.8% of residents of Lynnwood speak English at home.
19.4% of residents speak Spanish at home 1,068 44.2% Speak English very well1,346 55.8% Speak English less than very well68.5% of residents speak other language at home 3,705 43.4% Speak English very well4,837 56.6% Speak English less than very well
White (Caucasian) - Speak only English Native:
96.0% (17,211)Foreign-born:
27.7% (500)
White (Caucasian) - Speak another language Native:
3.9% (696)Foreign-born:
72.1% (1,299)
Black or African American - Speak only English Native:
68.4% (1,023)Foreign-born:
4.6% (90)
Black or African American - Speak another language Native:
33.4% (500)Foreign-born:
80.3% (1,583)
Asian - Speak only English Native:
40.7% (589)Foreign-born:
8.8% (539)
Asian - Speak another language Native:
59.5% (861)Foreign-born:
90.5% (5,538)
Other race - Speak only English Native:
7.3% (81)Foreign-born:
3.6% (49)
Other race - Speak another language Native:
97.2% (1,083)Foreign-born:
94.1% (1,285)
Two or more races - Speak only English Native:
85.7% (3,083)Foreign-born:
7.4% (85)
Two or more races - Speak another language Native:
13.7% (493)Foreign-born:
90.1% (1,039)
White alone - Speak only English Native:
96.6% (16,702)Foreign-born:
29.6% (489)
White alone - Speak another language Native:
3.4% (591)Foreign-born:
70.6% (1,166)
Hispanic or Latino - Speak only English Native:
59.8% (1,911)Foreign-born:
3.8% (98)
Hispanic or Latino - Speak another language Native:
39.8% (1,272)Foreign-born:
95.7% (2,465)
Foreign-born residents in Lynnwood 12,490 residents are foreign born (15.2% Asia , 6.5% Latin America , 4.5% Africa , 3.4% Europe ).
This city:
30.9%Washington:
14.9%
Marital status for residents in Lynnwood Marital status - White (Caucasian) population 15 years and over
Males 36.5% Never married45.6% Now married1.1% Separated2.6% Widowed14.2% DivorcedFemales 28.2% Never married39.4% Now married1.8% Separated11.4% Widowed19.2% DivorcedWomen who gave birth in the past 12 months Now married:
82.9% (259)Unmarried:
17.1% (54)
Women who did not give birth in the past 12 months Now married:
36.2% (1,534)Unmarried:
63.8% (2,699)
Marital status - Black or African American population 15 years and over
Males 49.9% Never married31.0% Now married2.3% Separated1.0% Widowed15.8% DivorcedFemales 41.1% Never married30.9% Now married12.9% Separated2.1% Widowed13.0% DivorcedWomen who gave birth in the past 12 months Now married:
100.0% (49)Unmarried:
0.0% (0)
Women who did not give birth in the past 12 months Now married:
17.5% (132)Unmarried:
82.5% (623)
Marital status - American Indian / Alaska Native population 15 years and over
Males 25.6% Never married20.3% Now married0.0% Separated9.7% Widowed44.4% DivorcedFemales 69.0% Never married31.0% Now married0.0% Separated0.0% Widowed0.0% DivorcedWomen who did not give birth in the past 12 months Now married:
0.0% (0)Unmarried:
100.0% (129)
Marital status - Asian population 15 years and over
Males 35.0% Never married53.1% Now married2.2% Separated5.0% Widowed4.7% DivorcedFemales 25.8% Never married53.7% Now married0.8% Separated12.7% Widowed7.1% DivorcedWomen who gave birth in the past 12 months Now married:
1.5% (1)Unmarried:
98.5% (71)
Women who did not give birth in the past 12 months Now married:
55.5% (1,066)Unmarried:
44.5% (856)
Marital status - Native Hawaiian / Pacific Islander population 15 years and over
Males 0.0% Never married100.0% Now married0.0% Separated0.0% Widowed0.0% DivorcedFemales 10.7% Never married89.3% Now married0.0% Separated0.0% Widowed0.0% DivorcedWomen who did not give birth in the past 12 months Now married:
89.3% (72)Unmarried:
10.7% (9)
Marital status - Other race population 15 years and over
Males 54.6% Never married43.0% Now married2.4% Separated0.0% Widowed0.0% DivorcedFemales 20.2% Never married36.2% Now married29.1% Separated7.1% Widowed7.5% DivorcedWomen who gave birth in the past 12 months Now married:
100.0% (39)Unmarried:
0.0% (0)
Women who did not give birth in the past 12 months Now married:
75.5% (322)Unmarried:
24.5% (104)
Marital status - Two or more races population 15 years and over
Males 46.3% Never married40.2% Now married0.0% Separated0.2% Widowed13.3% DivorcedFemales 35.5% Never married47.7% Now married3.3% Separated4.8% Widowed8.7% DivorcedWomen who gave birth in the past 12 months Now married:
83.5% (309)Unmarried:
16.5% (61)
Women who did not give birth in the past 12 months Now married:
50.7% (552)Unmarried:
49.3% (537)
Marital status - White alone, not Hispanic / Latino population 15 years and over
Males 36.2% Never married45.3% Now married1.2% Separated2.8% Widowed14.6% DivorcedFemales 27.0% Never married39.2% Now married1.9% Separated11.9% Widowed20.1% DivorcedWomen who gave birth in the past 12 months Now married:
89.9% (247)Unmarried:
10.1% (28)
Women who did not give birth in the past 12 months Now married:
36.9% (1,499)Unmarried:
63.1% (2,562)
Marital status - Hispanic or Latino population 15 years and over
Males 45.3% Never married47.3% Now married0.9% Separated0.1% Widowed6.4% DivorcedFemales 39.3% Never married40.7% Now married9.8% Separated4.1% Widowed6.2% DivorcedWomen who gave birth in the past 12 months Now married:
77.6% (293)Unmarried:
22.4% (85)
Women who did not give birth in the past 12 months Now married:
40.1% (494)Unmarried:
59.9% (738)
Ancestries in Lynnwood
1,216 5.9% English1,118 5.4% Ethiopian1,108 5.3% German822 4.0% European669 3.2% American560 2.7% African432 2.1% Irish403 1.9% Norwegian247 1.2% Armenian163 0.8% Russian152 0.7% Polish135 0.7% Ukrainian125 0.6% Lebanese121 0.6% Swedish120 0.6% Serbian111 0.5% Scandinavian102 0.5% Italian99 0.5% Scotch-Irish95 0.5% Portuguese93 0.4% Ghanaian90 0.4% Czech86 0.4% Yugoslavian86 0.4% Danish85 0.4% Lithuanian77 0.4% Bulgarian74 0.4% Slavic73 0.4% Northern European73 0.4% Scottish72 0.3% Dutch60 0.3% Iranian59 0.3% Belgian48 0.2% British45 0.2% French Canadian45 0.2% Nigerian30 0.1% Turkish29 0.1% French29 0.1% Slovak24 0.1% British West Indian23 0.1% Welsh21 0.1% Icelander20 0.10% Romanian20 0.10% Canadian19 0.09% Estonian14 0.07% Egyptian14 0.07% Finnish7 0.03% Croatian6 0.03% Eastern European3 0.01% Swiss
Geographical mobility in Lynnwood Same house 1 year ago 17,757 86.2% White (Caucasian)2,943 81.3% Black or African American380 100.0% American Indian / Alaska Native6,534 83.9% Asian105 90.9% Native Hawaiian / Pacific Islander2,250 84.1% Other race4,523 85.7% Two or more races17,228 87.5% White alone, not Hispanic / Latino5,247 82.0% Hispanic or LatinoMoved within same county 1,309 6.4% White / Caucasian353 9.8% Black or African American730 9.4% Asian4 3.8% Native Hawaiian / Pacific Islander169 6.3% Other race292 5.5% Two or more races1,099 5.6% White alone, not Hispanic / Latino456 7.1% Hispanic or LatinoMoved within same state 990 4.8% White / Caucasian119 3.3% Black or African American231 3.0% Asian8 0.3% Other race109 2.1% Two or more races920 4.7% White alone, not Hispanic / Latino169 2.6% Hispanic or LatinoMoved from different state 478 2.3% White / Caucasian52 1.4% Black or African American57 0.7% Asian314 6.0% Two or more races405 2.1% White alone, not Hispanic / Latino178 2.8% Hispanic or LatinoMoved from abroad 60 0.3% White108 3.0% Black or African American247 3.2% Asian7 5.7% Native Hawaiian / Pacific Islander191 7.1% Other race30 0.6% Two or more races62 0.3% White alone, not Hispanic / Latino359 5.6% Hispanic or Latino
Children Nativity (place of birth) in Lynnwood
Children under 6 years - Living with two parents Both parents native 1,176 100.0% NativeBoth parents foreign-born 801 83.5% Native158 16.5% Foreign-bornOne native, one foreign-born parent 253 100.0% NativeChildren under 6 years - Living with one parent Native parent 348 100.0% NativeForeign-born parent 18 72.4% Native7 27.6% Foreign-bornChildren 6 to 17 years - Living with two parents Both parents native 931 100.0% NativeBoth parents foreign-born 912 58.0% Native659 42.0% Foreign-bornOne native, one foreign-born parent 688 100.0% NativeChildren 6 to 17 years - Living with one parent Native parent 753 100.0% NativeForeign-born parent 574 55.5% Native460 44.5% Foreign-born
Place of birth for residents in Lynnwood 6,293 Asia2,784 Americas2,705 Latin America2,560 South Eastern Asia2,170 Eastern Asia1,978 Central America1,870 Africa1,443 Eastern Africa1,389 Europe1,188 South Central Asia955 Eastern Europe776 China568 South America423 Western Africa373 Western Asia224 Western Europe157 Caribbean152 Oceania131 Northern Europe83 Australia and New Zealand Subregion78 Northern America77 Southern Europe4 Southern Africa1,738 Mexico1,100 Philippines1,088 Korea1,047 Ethiopia814 Vietnam813 India565 China353 Cambodia328 Eritrea303 Ivory Coast257 Armenia224 Russia192 Indonesia188 Ukraine184 Germany180 Japan179 Pakistan177 Peru171 Taiwan171 Colombia144 Bosnia and Herzegovina142 Cuba138 Bulgaria123 El Salvador111 Poland111 Sri Lanka102 Venezuela84 Iran84 Thailand81 Lebanon78 Canada72 Argentina70 Honduras67 Belarus67 Kenya63 New Zealand51 Lithuania50 England47 Ghana43 Portugal40 Fiji39 Hong Kong35 Brazil30 Norway29 Nigeria28 Turkey25 Costa Rica24 Romania23 Spain21 France21 United Kingdom19 Australia19 Nicaragua17 Netherlands15 Laos15 Haiti14 Scotland14 Denmark10 Italy8 Chile6 Israel5 Micronesia4 South Africa
Grandparents responsible for own grandchildren in Lynnwood
Grandparents (30 to 59 years) White / Caucasian 10 67.6% Responsible for grandchildren5 32.4% Not responsible for grandchildrenBlack or African American 4 100.0% Not responsible for grandchildrenAsian 31 100.0% Responsible for grandchildrenNative Hawaiian / Pacific Islander 3 100.0% Not responsible for grandchildrenTwo or more races 25 100.0% Not responsible for grandchildrenWhite alone, not Hispanic / Latino 10 67.8% Responsible for grandchildren5 32.2% Not responsible for grandchildrenHispanic or Latino 23 100.0% Not responsible for grandchildrenGrandparents (60 years and over) White / Caucasian 44 9.8% Responsible for grandchildren407 90.2% Not responsible for grandchildrenBlack or African American 5 100.0% Responsible for grandchildrenAsian 63 23.8% Responsible for grandchildren200 76.2% Not responsible for grandchildrenTwo or more races 170 100.0% Not responsible for grandchildrenWhite alone, not Hispanic / Latino 44 11.7% Responsible for grandchildren334 88.3% Not responsible for grandchildrenHispanic or Latino 193 100.0% Not responsible for grandchildren