Longview, WA (Washington) Houses and Residents
| Longview: | $382,257 |
| Washington: | $569,500 |
Mean price in 2022:
Detached houses: $320,538
Here: $320,538 State: $734,307 Townhouses or other attached units: $331,642
Here: $331,642 State: $657,697 In 2-unit structures: $274,596
Here: $274,596 State: $534,634 In 3-to-4-unit structures: $376,021
Here: $376,021 State: $510,239 In 5-or-more-unit structures: $262,560
Here: $262,560 State: $503,183 Mobile homes: $63,979
Here: $63,979 State: $218,362 Occupied boats, RVs, vans, etc.: $42,630
Here: $42,630 State: $159,523
Total population: 36,483 (Urban population: 34,804, Rural population: 0)
Houses: 17,089 (16,260 occupied: 8,617 owner occupied, 7,739 renter occupied)
| % of renters here: | 47% |
| State: | 36% |
Housing density: 1,247 houses/condos per square mile
Median price asked for vacant for-sale houses and condos in 2022: $981,489.
Median contract rent in 2022: $946 (lower quartile is $797, upper quartile is $1,156)
Median rent asked for vacant for-rent units in 2022: $2,397
Median gross rent in Longview, WA in 2022: $1,099
Housing units in Longview with a mortgage: 5,782 (381 second mortgage, 26 home equity loan, 304 both second mortgage and home equity loan)
Houses without a mortgage: 13
Median household income for houses/condos with a mortgage: $87,656
Median household income for apartments without a mortgage: $74,666
Median monthly housing costs: $1,145
Compare current foreclosures in Longview, WA:
| Photo | Address | Area | Beds / Baths | Price | Details |
|---|---|---|---|---|---|

|
#1
Columbia Heights Rd
Longview, WA 98632
|
1,056 sq. feet
|
1 baths 3 beds |
show details | |

|
#2
Coal Creek Rd
Longview, WA 98632
|
912 sq. feet
|
1 baths 2 beds |
show details | |

|
#3
Sunset Pl
Longview, WA 98632
|
2,658 sq. feet
|
3 baths 3 beds |
show details | |

|
#4
Maple St
Longview, WA 98632
|
1,090 sq. feet
|
2 baths 3 beds |
show details | |

|
#5
Ammons Dr
Longview, WA 98632
|
1,293 sq. feet
|
2 baths 3 beds |
show details | |

|
#6
Ocean Beach Hwy
Longview, WA 98632
|
- sq. feet
|
1 baths 3 beds |
show details | |

|
#7
Alpha Dr
Longview, WA 98632
|
1,782 sq. feet
|
2 baths 3 beds |
show details | |

|
#8
Fir St
Longview, WA 98632
|
1,426 sq. feet
|
1 baths 4 beds |
show details | |

|
#9
Inglewood Dr
Longview, WA 98632
|
1,776 sq. feet
|
2 baths 3 beds |
show details | |

|
#10
Maple St
Longview, WA 98632
|
1,414 sq. feet
|
2 baths 3 beds |
show details |
| Photo | Address | Area | Beds / Baths | Price | Details |
|---|---|---|---|---|---|

|
#11
16th Ave
Longview, WA 98632
|
1,406 sq. feet
|
1 baths 3 beds |
show details | |

|
#12
Heritage Blvd
Longview, WA 98632
|
1,349 sq. feet
|
2 baths 3 beds |
show details | |

|
#13
Dover St
Longview, WA 98632
|
948 sq. feet
|
1 baths 2 beds |
show details | |

|
#14
Terry Ave
Longview, WA 98632
|
2,056 sq. feet
|
2 baths 4 beds |
show details | |

|
#15
Spruce Creek Rd
Longview, WA 98632
|
1,404 sq. feet
|
2 baths 3 beds |
show details | |

|
#16
Baltimore St
Longview, WA 98632
|
781 sq. feet
|
1 baths 3 beds |
show details | |

|
#17
Victoria St
Longview, WA 98632
|
1,611 sq. feet
|
1 baths 3 beds |
show details | |

|
#18
Stella Rd # C
Longview, WA 98632
|
5,076 sq. feet
|
3 baths 5 beds |
show details | |

|
#19
Island Dr
Longview, WA 98632
|
2,150 sq. feet
|
2 baths 3 beds |
show details | |

|
#20
Ocean Beach Hwy
Longview, WA 98632
|
3,155 sq. feet
|
3 baths 4 beds |
show details |
| Photo | Address | Area | Beds / Baths | Price | Details |
|---|---|---|---|---|---|

|
#21
Merlin St
Longview, WA 98632
|
1,397 sq. feet
|
2 baths 3 beds |
show details | |

|
#22
29th Ave
Longview, WA 98632
|
800 sq. feet
|
1 baths 2 beds |
show details | |

|
#23
19th Ave
Longview, WA 98632
|
2,106 sq. feet
|
3 baths 4 beds |
show details | |

|
#24
Larch St
Longview, WA 98632
|
1,110 sq. feet
|
1 baths 3 beds |
show details | |

|
#25
Horizon Ct
Longview, WA 98632
|
1,157 sq. feet
|
2 baths 2 beds |
show details | |

|
#26
48th Ave
Longview, WA 98632
|
1,376 sq. feet
|
2 baths 3 beds |
show details | |

|
#27
Stewart Creek Rd
Longview, WA 98632
|
1,278 sq. feet
|
1 baths 3 beds |
show details | |

|
#28
Ferncrest Rd
Longview, WA 98632
|
1,456 sq. feet
|
2 baths 3 beds |
show details | |

|
#29
Olson Rd
Longview, WA 98632
|
1,360 sq. feet
|
2 baths 3 beds |
show details | |

|
#30
Clark Creek Rd
Longview, WA 98632
|
1,290 sq. feet
|
1 baths 3 beds |
show details |
| Photo | Address | Area | Beds / Baths | Price | Details |
|---|---|---|---|---|---|

|
#31
Clark St
Longview, WA 98632
|
840 sq. feet
|
1 baths 3 beds |
show details | |

|
#32
Inglewood Dr
Longview, WA 98632
|
1,335 sq. feet
|
2 baths 3 beds |
show details | |

|
#33
Dorothy St
Longview, WA 98632
|
1,655 sq. feet
|
2 baths 4 beds |
show details | |

|
#34
31st Ave
Longview, WA 98632
|
1,056 sq. feet
|
1 baths 3 beds |
show details | |

|
#35
21st Ave
Longview, WA 98632
|
1,036 sq. feet
|
1 baths 3 beds |
show details | |

|
#36
Selix Ln
Longview, WA 98632
|
2,032 sq. feet
|
2 baths 4 beds |
show details | |

|
#37
Pine St
Longview, WA 98632
|
982 sq. feet
|
1 baths 4 beds |
show details | |

|
#38
Wren Dr
Longview, WA 98632
|
- sq. feet
|
- baths - beds |
show details | |

|
#39
32nd Ave
Longview, WA 98632
|
- sq. feet
|
- baths - beds |
show details | |

|
#40
Colorado St
Longview, WA 98632
|
- sq. feet
|
- baths - beds |
show details |
| Photo | Address | Area | Beds / Baths | Price | Details |
|---|---|---|---|---|---|

|
#41
Windemere St
Longview, WA 98632
|
1,493 sq. feet
|
- baths - beds |
show details | |

|
#42
16th Ave
Longview, WA 98632
|
- sq. feet
|
- baths - beds |
show details | |

|
#43
Sunset Way
Longview, WA 98632
|
- sq. feet
|
- baths - beds |
show details | |

|
#44
Grandview Ter
Longview, WA 98632
|
- sq. feet
|
- baths - beds |
show details | |

|
#45
34th Ave
Longview, WA 98632
|
- sq. feet
|
- baths - beds |
show details | |

|
#46
California Way Unit 4
Longview, WA 98632
|
- sq. feet
|
- baths - beds |
show details | |

|
#47
Constitution Ln
Longview, WA 98632
|
- sq. feet
|
- baths - beds |
show details | |

|
#48
30th Ave # B202
Longview, WA 98632
|
- sq. feet
|
- baths - beds |
show details | |

|
#49
24th Ave
Longview, WA 98632
|
- sq. feet
|
- baths - beds |
show details | |

|
Check over 1 million property listings on Foreclosure.com!
|
browse all offers | |||

Latest news about housing in Longview, WA collected exclusively by city-data.com from local newspapers, TV, and radio stations

 | Salem OR vs Vancouver WA - best quality of life for the rent prices (95 replies) |
| Retiring and buying $450k house possible? (37 replies) |
| Fiber Optic Internet to Homes in Washington by County (20 replies) |
| Affordable housing in Western WA? (54 replies) |
| Longview/Kelso or Warrenton/Astoria (10 replies) |
| Have things improved in Longview/Kelso in 2020 (12 replies) |

Median year apartment built: 1965
Household type by relationship:
Households: 38,177- Male householders: 7,301 (2,501 living alone), Female householders: 8,922 (3,320 living alone)
5,775 spouses (5,723 opposite-sex spouses), 1,897 unmarried partners, (1,854 opposite-sex unmarried partners), 9,758 children (8,997 natural, 200 adopted, 560 stepchildren), 685 grandchildren, 302 brothers or sisters, 492 parents, 14 foster children, 526 other relatives, 1,591 non-relatives
- In group quarters: 908
Size of family households: 4,088 2-persons, 2,232 3-persons, 1,317 4-persons, 1,437 5-persons, 231 6-persons, 343 7-or-more-persons.
Size of nonfamily households: 4,357 1-person, 1,714 2-persons, 192 3-persons, 52 4-persons, 30 6-persons.
3,681 married couples with children.
3,034 single-parent households (533 men, 2,501 women).
91.2% of residents of Longview speak English at home.
6.0% of residents speak Spanish at home (66% speak English very well, 20% speak English well, 10% speak English not well, 3% don't speak English at all).
0.8% of residents speak other Indo-European language at home (85% speak English very well, 10% speak English well, 5% speak English not well).
1.5% of residents speak Asian or Pacific Island language at home (50% speak English very well, 35% speak English well, 12% speak English not well, 4% don't speak English at all).
0.2% of residents speak other language at home (49% speak English very well, 51% speak English well).
Foreign born population: 1,564 (4.1%)
(66.0% of them are naturalized citizens)
| Here: | 6.1 |
| State: | 6.5 |
| Here: | 4.5 |
| State: | 3.9 |

- Bedrooms in owner-occupied houses and condos in Longview, Washington
- 50no bedroom
- 2001 bedroom
- 1,7522 bedrooms
- 4,7563 bedrooms
- 1,4474 bedrooms
- 4125+ bedrooms

- Bedrooms in renter-occupied apartments in Longview, Washington
- 615no bedroom
- 1,7661 bedroom
- 3,3592 bedrooms
- 1,6323 bedrooms
- 2954 bedrooms
- 725+ bedrooms

- Cars and other vehicles available in Longview in owner-occupied houses/condos
- 279no vehicle
- 2,6171 vehicle
- 3,3812 vehicles
- 1,5113 vehicles
- 4964 vehicles
- 3345+ vehicles

- Cars and other vehicles available in Longview in renter-occupied apartments
- 1,527no vehicle
- 3,0661 vehicle
- 2,2262 vehicles
- 6003 vehicles
- 1734 vehicles
- 1485+ vehicles

- Rooms in owner-occupied houses in Longview, Washington
- 501 room
- 202 rooms
- 2053 rooms
- 1,0624 rooms
- 1,6215 rooms
- 2,0986 rooms
- 1,3137 rooms
- 9938 rooms
- 1,2549+ rooms

- Rooms in renter-occupied apartments in Longview, Washington
- 5201 room
- 5802 rooms
- 9383 rooms
- 2,4794 rooms
- 1,7495 rooms
- 8306 rooms
- 3837 rooms
- 1008 rooms
- 1629+ rooms


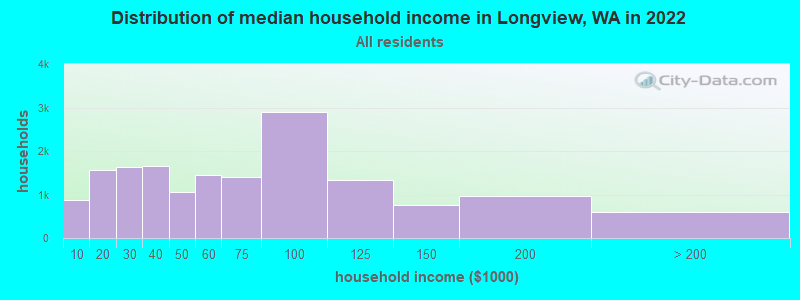
Longview, WA household income distribution

- 866Less than $10,000
- 1,564$10,000 to $19,999
- 1,628$20,000 to $29,999
- 1,655$30,000 to $39,999
- 1,066$40,000 to $49,999
- 1,446$50,000 to $59,999
- 1,399$60,000 to $74,999
- 2,897$75,000 to $99,999
- 1,340$100,000 to $124,999
- 760$125,000 to $149,999
- 973$150,000 to $199,999
- 603$200,000 or more
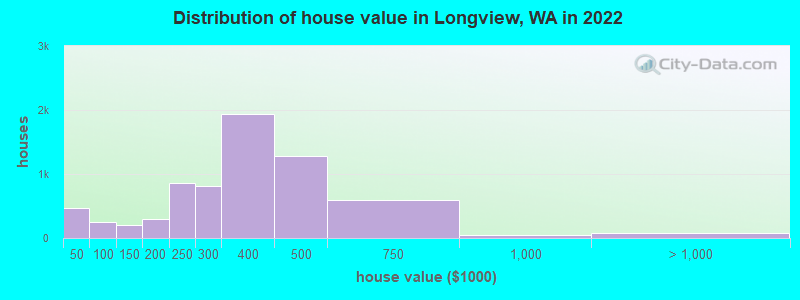
Home value of owner - occupied houses in 2022 in Longview, WA
-
- 185Less than $10,000
- 3$10,000 to $14,999
- 90$20,000 to $24,999
- 21$25,000 to $29,999
- 34$30,000 to $34,999
- 50$35,000 to $39,999
- 87$40,000 to $49,999
- 38$50,000 to $59,999
- 21$60,000 to $69,999
- 40$70,000 to $79,999
- 31$80,000 to $89,999
- 32$90,000 to $99,999
- 121$100,000 to $124,999
- 83$125,000 to $149,999
- 150$150,000 to $174,999
- 149$175,000 to $199,999
- 857$200,000 to $249,999
- 810$250,000 to $299,999
- 1,936$300,000 to $399,999
- 1,280$400,000 to $499,999
- 587$500,000 to $749,999
- 41$750,000 to $999,999
- 29$1,000,000 to $1,499,999
- 21$1,500,000 to $1,999,999
- 32$2,000,000 or more
Rent paid by renters in 2022 in Longview, WA
-
- 26Less than $100
- 154$100 to $149
- 76$150 to $199
- 80$200 to $249
- 22$250 to $299
- 7$300 to $349
- 47$350 to $399
- 85$400 to $449
- 74$450 to $499
- 309$500 to $549
- 96$550 to $599
- 161$600 to $649
- 88$650 to $699
- 259$700 to $749
- 468$750 to $799
- 742$800 to $899
- 1,304$900 to $999
- 1,498$1,000 to $1,249
- 687$1,250 to $1,499
- 484$1,500 to $1,999
- 77$2,000 to $2,499
- 43$3,500 or more
- 177No cash rent

Percentage of workers working in this county: 79.4%
Number of people working at home: 1,189 (7.2% of all workers)
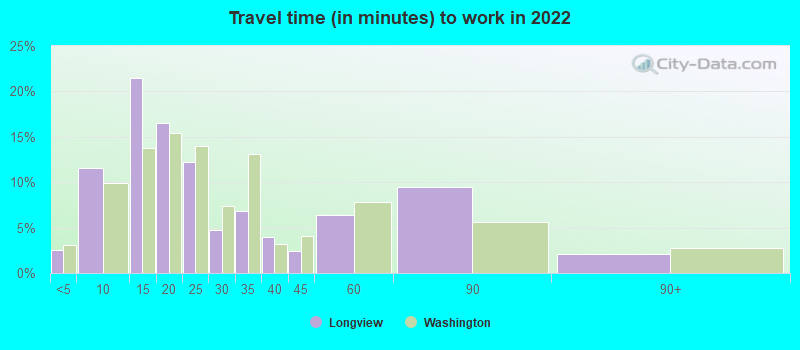
Travel time to work (commute)
- Less than 5 minutes: 604
- 5 to 9 minutes: 2,485
- 10 to 14 minutes: 3,058
- 15 to 19 minutes: 2,551
- 20 to 24 minutes: 1,298
- 25 to 29 minutes: 449
- 30 to 34 minutes: 880
- 35 to 39 minutes: 425
- 40 to 44 minutes: 485
- 45 to 59 minutes: 909
- 60 to 89 minutes: 1,539
- 90 or more minutes: 734
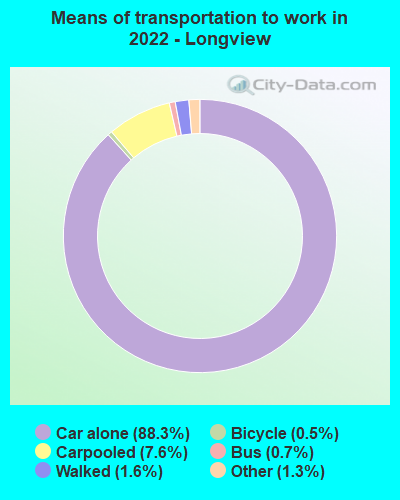
Means of transportation to work:
- Drove a car alone: 18,072 (80.7%)
- Carpooled: 1,602 (7.2%)
- Bus: 96 (0.4%)
- Taxi: 252 (1.1%)
- Bicycle: 83 (0.4%)
- Walked: 339 (1.5%)
- Worked at home: 1,189 (5.3%)
- Unemployment by race in 2022
- Unemployment rate for White non-Hispanic residents
- 3.2%Males
- 5.4%Females
- Unemployment rate for Black residents
- 4.9%Males
- Unemployment rate for American Indian and Alaska Native residents
- 24.5%Males
- 27.2%Females
- Unemployment rate for two or more race residents
- 2.0%Males
- 7.7%Females
- Unemployment rate for Hispanic or Latino residents
- 7.2%Females

- Year of entry for the foreign-born population in Longview, Washington
- 3262010 or later
- 3482000 to 2009
- 4751990 to 1999
- 4101980 to 1989
- 2191970 to 1979
- 382Before 1970

First ancestries reported:
- American: 2,297 (14.8%)
- German: 1,476 (9.5%)
- English: 1,474 (9.5%)
- Irish: 1,339 (8.6%)
- European: 724 (4.7%)
- Norwegian: 516 (3.3%)
- Italian: 431 (2.8%)
- Finnish: 350 (2.3%)
- French: 286 (1.8%)
- Swedish: 273 (1.8%)
- Scottish: 258 (1.7%)
- Ethiopian: 117 (0.8%)
- Dutch: 113 (0.7%)
- Polish: 113 (0.7%)
- French Canadian: 91 (0.6%)
- Danish: 85 (0.5%)
- Eastern European: 77 (0.5%)
- Scandinavian: 61 (0.4%)
- Portuguese: 58 (0.4%)
- Northern European: 54 (0.3%)
- Welsh: 42 (0.3%)
- Russian: 40 (0.3%)
- Scotch-Irish: 31 (0.2%)
- Belgian: 30 (0.2%)
- Swiss: 29 (0.2%)
- Slovene: 25 (0.2%)
- Nigerian: 24 (0.2%)
- Iranian: 23 (0.1%)
- Latvian: 19 (0.1%)
- Slovak: 12 (0.08%)
- Croatian: 10 (0.06%)
- Canadian: 9 (0.06%)
- Ukrainian: 6 (0.04%)
- British: 5 (0.03%)
- Czech: 2 (0.01%)
Most common places of birth for foreign-born residents (%):
| Longview: | 43.7% (722) |
| Washington: | 21.1% (241,655) |
| Longview: | 8.6% (142) |
| Washington: | 6.3% (71,661) |
| Longview: | 6.7% (110) |
| Washington: | 5.4% (62,003) |
| Longview: | 4.7% (78) |
| Washington: | 1.0% (10,993) |
| Longview: | 4.0% (66) |
| Washington: | 0.0% (65) |
| Longview: | 3.4% (56) |
| Washington: | 7.4% (84,470) |
| Longview: | 3.1% (52) |
| Washington: | 1.9% (21,540) |
| Longview: | 2.7% (44) |
| Washington: | 4.1% (47,238) |
| Longview: | 2.4% (40) |
| Washington: | 1.6% (17,938) |
| Longview: | 2.4% (39) |
| Washington: | 0.2% (2,090) |
| Longview: | 2.3% (38) |
| Washington: | 0.1% (801) |
| Longview: | 1.7% (28) |
| Washington: | 1.5% (17,453) |
| Longview: | 1.6% (26) |
| Washington: | 0.3% (3,373) |
Place of birth for U.S.-born residents:
- This state: 20,020
- Other state: 16,235
- Northeast: 799
- Midwest: 2,667
- South: 1,296
- West: 11,395
83.9% of Longview residents lived in the same house 1 years ago.
Out of people who lived in different houses, 35.1% lived in this county.
Out of people who lived in different counties, 45.0% lived in Washington.
| Longview: | 83.9% |
| State average: | 85.2% |
Education attainment for males 25 years and older:
- No schooling: 339
- Nursery to 4th grade: 32
- 5th and 6th grade: 75
- 7th and 8th grade: 270
- 9th grade: 102
- 10th grade: 92
- 11th grade: 457
- 12th grade, no diploma: 778
- High school graduate (or equivalency): 4,155
- Less than 1 year of college: 1,517
- Some college more than 1 year, no degree: 1,595
- Associate degree: 1,685
- Bachelor's degree: 946
- Master's degree: 631
- Professional school degree: 42
- Doctorate degree: 175

Education attainment for females 25 years and older:
- No schooling: 180
- Nursery to 4th grade: 79
- 5th and 6th grade: 84
- 7th and 8th grade: 83
- 9th grade: 292
- 10th grade: 135
- 11th grade: 301
- 12th grade, no diploma: 209
- High school graduate (or equivalency): 4,698
- Less than 1 year of college: 1,146
- Some college more than 1 year, no degree: 2,665
- Associate degree: 2,055
- Bachelor's degree: 1,528
- Master's degree: 787
- Professional school degree: 66
- Doctorate degree: 135


Housing units in structures:
- One, detached: 10,369
- One, attached: 530
- Two: 640
- 3 or 4: 467
- 5 to 9: 1,061
- 10 to 19: 1,302
- 20 to 49: 820
- 50 or more: 1,201
- Mobile homes: 625
- Boats, RVs, vans, etc.: 71
Median worth of mobile homes: $42,383
Housing units lacking complete kitchen facilities in 2022: 4.1%
House/condo owner moved in on average 9 years ago
Renter moved in on average 2 years ago

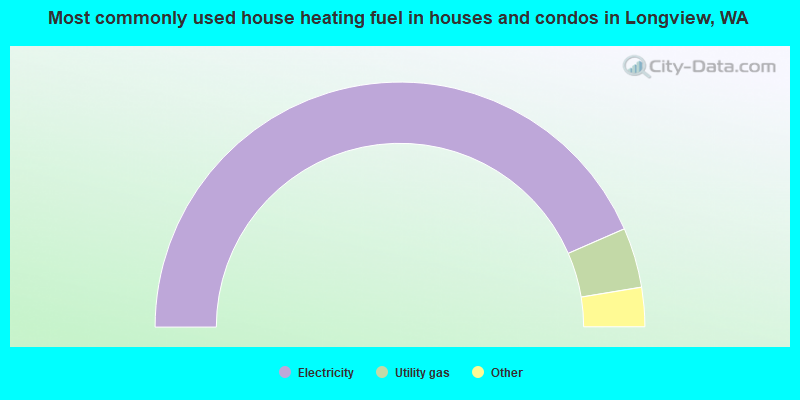
- 86.9%Electricity
- 7.9%Utility gas
- 2.7%Wood
- 0.8%Fuel oil, kerosene, etc.
- 0.7%Other fuel
- 0.6%Bottled, tank, or LP gas
- 0.3%No fuel used
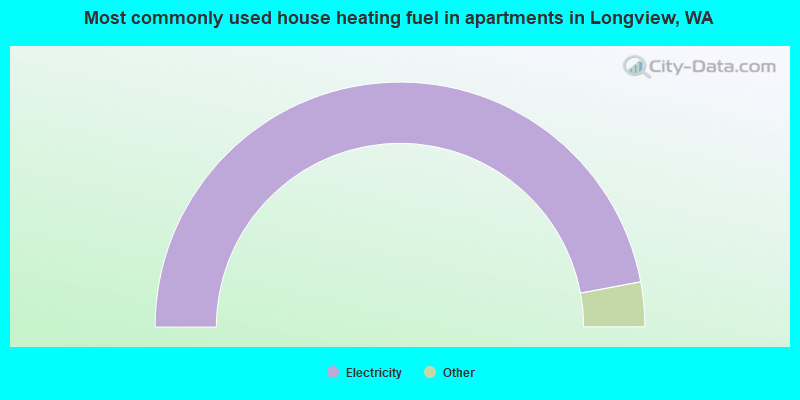
- 94.1%Electricity
- 2.5%Utility gas
- 2.0%Wood
- 0.7%No fuel used
- 0.2%Bottled, tank, or LP gas
- 0.2%Coal or coke
- 0.2%Fuel oil, kerosene, etc.
- 0.1%Other fuel
Private vs. public school enrollment:
| Here: | 8.8% |
| Washington: | 12.4% |
| Here: | 7.1% |
| Washington: | 9.2% |
| Here: | 11.2% |
| Washington: | 16.5% |


