Races in Longview, Washington (WA) Detailed Stats
Data:
Races - White alone (%)
Races - White alone (% change since 2000)
Races - Black alone (%)
Races - Black alone (% change since 2000)
Races - American Indian alone (%)
Races - American Indian alone (% change since 2000)
Races - Asian alone (%)
Races - Asian alone (% change since 2000)
Races - Hispanic (%)
Races - Hispanic (% change since 2000)
Races - Native Hawaiian and Other Pacific Islander alone (%)
Races - Native Hawaiian and Other Pacific Islander alone (% change since 2000)
Races - Two or more races(%)
Races - Two or more races(% change since 2000)
Races - Other race alone (%)
Races - Other race alone (% change since 2000)
Racial diversity
Place of birth - Born in state of residence (%)
Place of birth - Born in state of residence (%) - White
Place of birth - Born in state of residence (%) - Black or African American
Place of birth - Born in state of residence (%) - Asian
Place of birth - Born in state of residence (%) - Hispanic or Latino
Place of birth - Born in state of residence (%) - American Indian and Alaska Native
Place of birth - Born in state of residence (%) - Multirace
Place of birth - Born in state of residence (%) - Other Race
Place of birth - Born in other state (%)
Place of birth - Born in other state (%) - White
Place of birth - Born in other state (%) - Black or African American
Place of birth - Born in other state (%) - Asian
Place of birth - Born in other state (%) - Hispanic or Latino
Place of birth - Born in other state (%) - American Indian and Alaska Native
Place of birth - Born in other state (%) - Multirace
Place of birth - Born in other state (%) - Other Race
Place of birth - Native, outside of US (%)
Place of birth - Native, outside of US (%) - White
Place of birth - Native, outside of US (%) - Black or African American
Place of birth - Native, outside of US (%) - Asian
Place of birth - Native, outside of US (%) - Hispanic or Latino
Place of birth - Native, outside of US (%) - American Indian and Alaska Native
Place of birth - Native, outside of US (%) - Multirace
Place of birth - Native, outside of US (%) - Other Race
Place of birth - Foreign born (%)
Place of birth - Foreign born (%) - White
Place of birth - Foreign born (%) - Black or African American
Place of birth - Foreign born (%) - Asian
Place of birth - Foreign born (%) - Hispanic or Latino
Place of birth - Foreign born (%) - American Indian and Alaska Native
Place of birth - Foreign born (%) - Multirace
Place of birth - Foreign born (%) - Other Race
Residents speaking English at home (%)
Residents speaking English at home - Born in the United States (%)
Residents speaking English at home - Native, born elsewhere (%)
Residents speaking English at home - Foreign born (%)
Residents speaking Spanish at home (%)
Residents speaking Spanish at home - Born in the United States (%)
Residents speaking Spanish at home - Native, born elsewhere (%)
Residents speaking Spanish at home - Foreign born (%)
Residents speaking other language at home (%)
Residents speaking other language at home - Born in the United States (%)
Residents speaking other language at home - Native, born elsewhere (%)
Residents speaking other language at home - Foreign born (%)
Marital status - Never married (%)
Marital status - Now married (%)
Marital status - Separated (%)
Marital status - Widowed (%)
Marital status - Divorced (%)
Ancestries Reported - Arab (%)
Ancestries Reported - Czech (%)
Ancestries Reported - Danish (%)
Ancestries Reported - Dutch (%)
Ancestries Reported - English (%)
Ancestries Reported - French (%)
Ancestries Reported - French Canadian (%)
Ancestries Reported - German (%)
Ancestries Reported - Greek (%)
Ancestries Reported - Hungarian (%)
Ancestries Reported - Irish (%)
Ancestries Reported - Italian (%)
Ancestries Reported - Lithuanian (%)
Ancestries Reported - Norwegian (%)
Ancestries Reported - Polish (%)
Ancestries Reported - Portuguese (%)
Ancestries Reported - Russian (%)
Ancestries Reported - Scotch-Irish (%)
Ancestries Reported - Scottish (%)
Ancestries Reported - Slovak (%)
Ancestries Reported - Subsaharan African (%)
Ancestries Reported - Swedish (%)
Ancestries Reported - Swiss (%)
Ancestries Reported - Ukrainian (%)
Ancestries Reported - United States (%)
Ancestries Reported - Welsh (%)
Ancestries Reported - West Indian (%)
Ancestries Reported - Other (%)
Geographical mobility - Same house 1 year ago (%)
Geographical mobility - Same house 1 year ago (%) - White
Geographical mobility - Same house 1 year ago (%) - Black or African American
Geographical mobility - Same house 1 year ago (%) - Asian
Geographical mobility - Same house 1 year ago (%) - Hispanic or Latino
Geographical mobility - Same house 1 year ago (%) - American Indian and Alaska Native
Geographical mobility - Same house 1 year ago (%) - Multirace
Geographical mobility - Same house 1 year ago (%) - Other Race
Geographical mobility - Moved within same county (%)
Geographical mobility - Moved within same county (%) - White
Geographical mobility - Moved within same county (%) - Black or African American
Geographical mobility - Moved within same county (%) - Asian
Geographical mobility - Moved within same county (%) - Hispanic or Latino
Geographical mobility - Moved within same county (%) - American Indian and Alaska Native
Geographical mobility - Moved within same county (%) - Multirace
Geographical mobility - Moved within same county (%) - Other Race
Geographical mobility - Moved from different county within same state (%)
Geographical mobility - Moved from different county within same state (%) - White
Geographical mobility - Moved from different county within same state (%) - Black or African American
Geographical mobility - Moved from different county within same state (%) - Asian
Geographical mobility - Moved from different county within same state (%) - Hispanic or Latino
Geographical mobility - Moved from different county within same state (%) - American Indian and Alaska Native
Geographical mobility - Moved from different county within same state (%) - Multirace
Geographical mobility - Moved from different county within same state (%) - Other Race
Geographical mobility - Moved from different state (%)
Geographical mobility - Moved from different state (%) - White
Geographical mobility - Moved from different state (%) - Black or African American
Geographical mobility - Moved from different state (%) - Asian
Geographical mobility - Moved from different state (%) - Hispanic or Latino
Geographical mobility - Moved from different state (%) - American Indian and Alaska Native
Geographical mobility - Moved from different state (%) - Multirace
Geographical mobility - Moved from different state (%) - Other Race
Geographical mobility - Moved from abroad (%)
Geographical mobility - Moved from abroad (%) - White
Geographical mobility - Moved from abroad (%) - Black or African American
Geographical mobility - Moved from abroad (%) - Asian
Geographical mobility - Moved from abroad (%) - Hispanic or Latino
Geographical mobility - Moved from abroad (%) - American Indian and Alaska Native
Geographical mobility - Moved from abroad (%) - Multirace
Geographical mobility - Moved from abroad (%) - Other Race
Place of birth for the foreign-born population - Ireland (%)
Place of birth for the foreign-born population - Denmark (%)
Place of birth for the foreign-born population - Norway (%)
Place of birth for the foreign-born population - Sweden (%)
Place of birth for the foreign-born population - United Kingdom (%)
Place of birth for the foreign-born population - England (%)
Place of birth for the foreign-born population - Scotland (%)
Place of birth for the foreign-born population - Other Northern Europe (%)
Place of birth for the foreign-born population - Austria (%)
Place of birth for the foreign-born population - Belgium (%)
Place of birth for the foreign-born population - France (%)
Place of birth for the foreign-born population - Germany (%)
Place of birth for the foreign-born population - Netherlands (%)
Place of birth for the foreign-born population - Switzerland (%)
Place of birth for the foreign-born population - Other Western Europe (%)
Place of birth for the foreign-born population - Greece (%)
Place of birth for the foreign-born population - Italy (%)
Place of birth for the foreign-born population - Portugal (%)
Place of birth for the foreign-born population - Spain (%)
Place of birth for the foreign-born population - Other Southern Europe (%)
Place of birth for the foreign-born population - Albania (%)
Place of birth for the foreign-born population - Belarus (%)
Place of birth for the foreign-born population - Bosnia and Herzegovina (%)
Place of birth for the foreign-born population - Bulgaria (%)
Place of birth for the foreign-born population - Croatia (%)
Place of birth for the foreign-born population - Czechoslovakia (%)
Place of birth for the foreign-born population - Hungary (%)
Place of birth for the foreign-born population - Latvia (%)
Place of birth for the foreign-born population - Lithuania (%)
Place of birth for the foreign-born population - North Macedonia (Macedonia) (%)
Place of birth for the foreign-born population - Moldova (%)
Place of birth for the foreign-born population - Poland (%)
Place of birth for the foreign-born population - Romania (%)
Place of birth for the foreign-born population - Russia (%)
Place of birth for the foreign-born population - Serbia (%)
Place of birth for the foreign-born population - Ukraine (%)
Place of birth for the foreign-born population - Other Eastern Europe (%)
Place of birth for the foreign-born population - China (%)
Place of birth for the foreign-born population - Hong Kong (%)
Place of birth for the foreign-born population - Taiwan (%)
Place of birth for the foreign-born population - Japan (%)
Place of birth for the foreign-born population - Korea (%)
Place of birth for the foreign-born population - Other Eastern Asia (%)
Place of birth for the foreign-born population - Afghanistan (%)
Place of birth for the foreign-born population - Bangladesh (%)
Place of birth for the foreign-born population - India (%)
Place of birth for the foreign-born population - Iran (%)
Place of birth for the foreign-born population - Kazakhstan (%)
Place of birth for the foreign-born population - Nepal (%)
Place of birth for the foreign-born population - Pakistan (%)
Place of birth for the foreign-born population - Sri Lanka (%)
Place of birth for the foreign-born population - Uzbekistan (%)
Place of birth for the foreign-born population - Other South Central Asia (%)
Place of birth for the foreign-born population - Burma (%)
Place of birth for the foreign-born population - Cambodia (%)
Place of birth for the foreign-born population - Indonesia (%)
Place of birth for the foreign-born population - Laos (%)
Place of birth for the foreign-born population - Malaysia (%)
Place of birth for the foreign-born population - Philippines (%)
Place of birth for the foreign-born population - Singapore (%)
Place of birth for the foreign-born population - Thailand (%)
Place of birth for the foreign-born population - Vietnam (%)
Place of birth for the foreign-born population - Other South Eastern Asia (%)
Place of birth for the foreign-born population - Armenia (%)
Place of birth for the foreign-born population - Iraq (%)
Place of birth for the foreign-born population - Israel (%)
Place of birth for the foreign-born population - Jordan (%)
Place of birth for the foreign-born population - Kuwait (%)
Place of birth for the foreign-born population - Lebanon (%)
Place of birth for the foreign-born population - Saudi Arabia (%)
Place of birth for the foreign-born population - Syria (%)
Place of birth for the foreign-born population - Turkey (%)
Place of birth for the foreign-born population - Yemen (%)
Place of birth for the foreign-born population - Other Western Asia (%)
Place of birth for the foreign-born population - Eritrea (%)
Place of birth for the foreign-born population - Ethiopia (%)
Place of birth for the foreign-born population - Kenya (%)
Place of birth for the foreign-born population - Somalia (%)
Place of birth for the foreign-born population - Uganda (%)
Place of birth for the foreign-born population - Zimbabwe (%)
Place of birth for the foreign-born population - Other Eastern Africa (%)
Place of birth for the foreign-born population - Cameroon (%)
Place of birth for the foreign-born population - Congo (%)
Place of birth for the foreign-born population - Democratic Republic of Congo (Zaire) (%)
Place of birth for the foreign-born population - Other Middle Africa (%)
Place of birth for the foreign-born population - Egypt (%)
Place of birth for the foreign-born population - Morocco (%)
Place of birth for the foreign-born population - Sudan (%)
Place of birth for the foreign-born population - Other Northern Africa (%)
Place of birth for the foreign-born population - South Africa (%)
Place of birth for the foreign-born population - Other Southern Africa (%)
Place of birth for the foreign-born population - Cabo Verde (%)
Place of birth for the foreign-born population - Ghana (%)
Place of birth for the foreign-born population - Liberia (%)
Place of birth for the foreign-born population - Nigeria (%)
Place of birth for the foreign-born population - Senegal (%)
Place of birth for the foreign-born population - Sierra Leone (%)
Place of birth for the foreign-born population - Other Western Africa (%)
Place of birth for the foreign-born population - Australia (%)
Place of birth for the foreign-born population - New Zealand (%)
Place of birth for the foreign-born population - Fiji (%)
Place of birth for the foreign-born population - Micronesia (%)
Place of birth for the foreign-born population - Bahamas (%)
Place of birth for the foreign-born population - Barbados (%)
Place of birth for the foreign-born population - Cuba (%)
Place of birth for the foreign-born population - Dominica (%)
Place of birth for the foreign-born population - Dominican Republic (%)
Place of birth for the foreign-born population - Grenada (%)
Place of birth for the foreign-born population - Haiti (%)
Place of birth for the foreign-born population - Jamaica (%)
Place of birth for the foreign-born population - St. Vincent and the Grenadines (%)
Place of birth for the foreign-born population - Trinidad and Tobago (%)
Place of birth for the foreign-born population - West Indies (%)
Place of birth for the foreign-born population - Other Caribbean (%)
Place of birth for the foreign-born population - Belize (%)
Place of birth for the foreign-born population - Costa Rica (%)
Place of birth for the foreign-born population - El Salvador (%)
Place of birth for the foreign-born population - Guatemala (%)
Place of birth for the foreign-born population - Honduras (%)
Place of birth for the foreign-born population - Mexico (%)
Place of birth for the foreign-born population - Nicaragua (%)
Place of birth for the foreign-born population - Panama (%)
Place of birth for the foreign-born population - Other Central America (%)
Place of birth for the foreign-born population - Argentina (%)
Place of birth for the foreign-born population - Bolivia (%)
Place of birth for the foreign-born population - Brazil (%)
Place of birth for the foreign-born population - Chile (%)
Place of birth for the foreign-born population - Colombia (%)
Place of birth for the foreign-born population - Ecuador (%)
Place of birth for the foreign-born population - Guyana (%)
Place of birth for the foreign-born population - Peru (%)
Place of birth for the foreign-born population - Uruguay (%)
Place of birth for the foreign-born population - Venezuela (%)
Place of birth for the foreign-born population - Other South America (%)
Place of birth for the foreign-born population - Canada (%)
Place of birth for the foreign-born population - Other Northern America (%)
Place of birth for the foreign-born population - Other (%)
Latest news about races in Longview, WA collected exclusively by city-data.com from local newspapers, TV, and radio stations
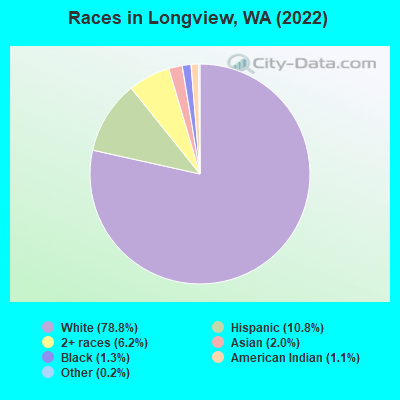
According to 2022 data, the most numerous races in Longview, WA are White alone (30,073 residents), Hispanic (4,124 residents), and Asian alone (749 residents). 90.0% of Longview residents speak English at home. 4.3% of Longview, WA residents are foreign-born (1.9% born in Latin America, 1.3% born in Asia, 0.7% born in Europe), which is 246.9% less than the foreign-born rate of 15.0% across the entire state of Washington.
Race distribution in Longview
2000 2022
4,652,490 78.9% White alone 441,509 7.5% Hispanic 319,401 5.4% Asian alone 184,631 3.1% Black alone 175,926 3.0% Two or more races 85,396 1.4% American Indian alone 22,779 0.4% Native Hawaiian and Other 11,989 0.2% Other race alone
4,941,456 63.5% White alone 1,093,313 14.0% Hispanic 755,832 9.7% Asian alone 523,448 6.7% Two or more races 299,537 3.8% Black alone 69,024 0.9% American Indian alone 52,231 0.7% Native Hawaiian and Other 50,945 0.7% Other race alone
Income and house value in Longview Median household income in 2022 $57,130 White non-Hispanic householders$78,211 Black householders$42,756 American Indian and Alaska Native householders$122,762 Asian householders$74,839 Some other race householders$75,380 Two or more races householders$57,594 Hispanic or Latino race householdersMedian 2022 house value $396,093 White Non-Hispanic householders$276,718 Black or African American householders$353,941 American Indian or Alaska Native householders $384,831 Asian householders$305,677 Native Hawaiian and other Pacific Islander householders$299,885 Some other race householders$314,042 Two or more races householders$395,127 Hispanic or Latino householders
Median age by race in Longview
41.9 Median age for White residents40.6 44.8 38.0 Median age for Black or African American residents36.2 42.5 36.5 Median age for American Indian / Alaska Native residents39.2 40.6 37.4 Median age for Asian residents57.5 39.0 -681,388,011.9 Median age for Native Hawaiian / Pacific Islander residents-696,774,192.9 -666,666,666.0 29.1 Median age for Other race residents27.5 33.0 27.9 Median age for Two or more races residents30.8 26.1 42.7 Median age for White alone residents41.3 46.0 25.1 Median age for Hispanic or Latino residents28.1 23.0
Owner/renter occupied households by race in Longview
House owners and renters - White residents 8,171 59.9% Owner occupied5,479 40.1% Renter occupiedHouse owners and renters - Black or African American residents 47 33.3% Owner occupied94 66.7% Renter occupiedHouse owners and renters - American Indian / Alaska Native residents 143 48.8% Owner occupied150 51.2% Renter occupiedHouse owners and renters - Asian residents 240 87.6% Owner occupied34 12.4% Renter occupiedHouse owners and renters - Other race residents 135 42.1% Owner occupied186 57.9% Renter occupiedHouse owners and renters - Two or more races residents 628 50.2% Owner occupied623 49.8% Renter occupiedHouse owners and renters - White alone residents 8,036 59.6% Owner occupied5,440 40.4% Renter occupiedHouse owners and renters - Hispanic or Latino residents 397 43.0% Owner occupied527 57.0% Renter occupied
Language usage in Longview
English speakers - Total 90.0% of residents of Longview speak English at home.
7.4% of residents speak Spanish at home 1,999 75.0% Speak English very well665 25.0% Speak English less than very well2.8% of residents speak other language at home 726 70.9% Speak English very well298 29.1% Speak English less than very well
English speakers - Born in the United States 94.7% of residents of Longview speak English at home.
4.9% of residents speak Spanish at home 499 65.1% Speak English very well268 34.9% Speak English less than very well0.5% of residents speak other language at home 71 100.0% Speak English very well
English speakers - Native, born elsewhere 56.6% of residents of Longview speak English at home.
23.4% of residents speak Spanish at home 56 83.6% Speak English very well11 16.4% Speak English less than very well0.7% of residents speak other language at home 2 100.0% Speak English very well
English speakers - Foreign-born 22.8% of residents of Longview speak English at home.
36.6% of residents speak Spanish at home 307 53.8% Speak English very well264 46.2% Speak English less than very well39.5% of residents speak other language at home 336 54.5% Speak English very well280 45.5% Speak English less than very well
White (Caucasian) - Speak only English Native:
97.3% (28,424)Foreign-born:
36.9% (190)
White (Caucasian) - Speak another language Native:
2.4% (703)Foreign-born:
63.1% (326)
Black or African American - Speak another language Native:
13.6% (48)Foreign-born:
97.1% (37)
American Indian / Alaska Native - Speak another language Native:
8.1% (41)Foreign-born:
100.0% (29)
Asian - Speak only English Native:
25.9% (53)Foreign-born:
25.6% (128)
Asian - Speak another language Native:
100.0% (205)Foreign-born:
75.3% (375)
Other race - Speak only English Native:
36.8% (393)Foreign-born:
7.2% (24)
Other race - Speak another language Native:
72.8% (778)Foreign-born:
100.0% (334)
Two or more races - Speak only English Native:
73.3% (2,367)Foreign-born:
24.2% (65)
Two or more races - Speak another language Native:
16.2% (524)Foreign-born:
71.5% (191)
White alone - Speak only English Native:
98.8% (27,953)Foreign-born:
40.7% (154)
White alone - Speak another language Native:
1.2% (347)Foreign-born:
61.6% (232)
Hispanic or Latino - Speak only English Native:
47.2% (1,604)Foreign-born:
15.4% (91)
Hispanic or Latino - Speak another language Native:
53.7% (1,826)Foreign-born:
97.2% (575)
Foreign-born residents in Longview 1,651 residents are foreign born (1.9% Latin America , 1.3% Asia , 0.7% Europe ).
This city:
4.3%Washington:
14.9%
Marital status for residents in Longview Marital status - White (Caucasian) population 15 years and over
Males 38.1% Never married42.0% Now married2.2% Separated3.4% Widowed14.3% DivorcedFemales 26.5% Never married38.3% Now married3.1% Separated12.4% Widowed19.8% DivorcedWomen who gave birth in the past 12 months Now married:
54.2% (176)Unmarried:
45.8% (149)
Women who did not give birth in the past 12 months Now married:
38.3% (2,447)Unmarried:
61.7% (3,934)
Marital status - Black or African American population 15 years and over
Males 25.1% Never married65.5% Now married5.1% Separated0.4% Widowed3.8% DivorcedFemales 23.0% Never married66.7% Now married2.4% Separated7.9% Widowed0.0% DivorcedWomen who did not give birth in the past 12 months Now married:
67.4% (60)Unmarried:
32.6% (29)
Marital status - American Indian / Alaska Native population 15 years and over
Males 40.5% Never married28.9% Now married10.5% Separated0.0% Widowed20.0% DivorcedFemales 38.8% Never married28.0% Now married0.0% Separated10.8% Widowed22.4% DivorcedWomen who did not give birth in the past 12 months Now married:
31.4% (59)Unmarried:
68.6% (129)
Marital status - Asian population 15 years and over
Males 21.9% Never married64.8% Now married0.0% Separated3.2% Widowed10.0% DivorcedFemales 30.9% Never married51.3% Now married0.0% Separated12.2% Widowed5.5% DivorcedWomen who gave birth in the past 12 months Now married:
100.0% (9)Unmarried:
0.0% (0)
Women who did not give birth in the past 12 months Now married:
56.8% (132)Unmarried:
43.2% (100)
Marital status - Other race population 15 years and over
Males 42.1% Never married29.7% Now married0.0% Separated16.0% Widowed12.2% DivorcedFemales 59.1% Never married25.3% Now married4.0% Separated0.0% Widowed11.6% DivorcedWomen who gave birth in the past 12 months Now married:
0.0% (0)Unmarried:
100.0% (21)
Women who did not give birth in the past 12 months Now married:
22.9% (41)Unmarried:
77.1% (139)
Marital status - Two or more races population 15 years and over
Males 52.5% Never married35.0% Now married2.8% Separated2.9% Widowed6.8% DivorcedFemales 43.5% Never married30.1% Now married4.1% Separated11.4% Widowed11.0% DivorcedWomen who gave birth in the past 12 months Now married:
40.0% (5)Unmarried:
60.0% (8)
Women who did not give birth in the past 12 months Now married:
30.2% (320)Unmarried:
69.8% (739)
Marital status - White alone, not Hispanic / Latino population 15 years and over
Males 36.7% Never married42.7% Now married2.3% Separated3.5% Widowed14.7% DivorcedFemales 25.6% Never married38.4% Now married3.2% Separated12.8% Widowed20.0% DivorcedWomen who gave birth in the past 12 months Now married:
50.9% (160)Unmarried:
49.1% (154)
Women who did not give birth in the past 12 months Now married:
38.6% (2,378)Unmarried:
61.4% (3,790)
Marital status - Hispanic or Latino population 15 years and over
Males 50.2% Never married34.8% Now married0.0% Separated6.4% Widowed8.5% DivorcedFemales 54.9% Never married28.4% Now married0.7% Separated3.2% Widowed12.8% DivorcedWomen who gave birth in the past 12 months Now married:
60.0% (28)Unmarried:
40.0% (19)
Women who did not give birth in the past 12 months Now married:
28.4% (296)Unmarried:
71.6% (748)
Ancestries in Longview
2,297 14.8% American1,476 9.5% German1,474 9.5% English1,339 8.6% Irish724 4.7% European516 3.3% Norwegian431 2.8% Italian350 2.3% Finnish286 1.8% French273 1.8% Swedish258 1.7% Scottish117 0.8% Ethiopian113 0.7% Dutch113 0.7% Polish91 0.6% French Canadian85 0.5% Danish77 0.5% Eastern European61 0.4% Scandinavian58 0.4% Portuguese54 0.3% Northern European42 0.3% Welsh40 0.3% Russian31 0.2% Scotch-Irish30 0.2% Belgian29 0.2% Swiss25 0.2% Slovene24 0.2% Nigerian23 0.1% Iranian19 0.1% Latvian12 0.08% Slovak10 0.06% Croatian9 0.06% Canadian6 0.04% Ukrainian5 0.03% British2 0.01% Czech
Geographical mobility in Longview Same house 1 year ago 26,992 87.7% White (Caucasian)455 91.4% Black or African American441 80.0% American Indian / Alaska Native616 84.0% Asian868 78.5% Other race3,211 76.5% Two or more races26,016 87.2% White alone, not Hispanic / Latino3,567 85.6% Hispanic or LatinoMoved within same county 2,569 8.3% White / Caucasian26 5.1% Black or African American8 1.5% American Indian / Alaska Native33 4.4% Asian72 6.5% Other race378 9.0% Two or more races2,727 9.1% White alone, not Hispanic / Latino250 6.0% Hispanic or LatinoMoved within same state 406 1.3% White / Caucasian5 1.1% Black or African American55 9.9% American Indian / Alaska Native43 5.8% Asian1 100.0% Native Hawaiian / Pacific Islander41 3.7% Other race111 2.6% Two or more races480 1.6% White alone, not Hispanic / Latino147 3.5% Hispanic or LatinoMoved from different state 666 2.2% White / Caucasian16 3.2% Black or African American60 10.8% American Indian / Alaska Native33 4.5% Asian93 8.4% Other race185 4.4% Two or more races426 1.4% White alone, not Hispanic / Latino513 12.3% Hispanic or LatinoMoved from abroad 10 2.0% Black or African American42 3.8% Other race32 0.8% Hispanic or Latino
Children Nativity (place of birth) in Longview
Children under 6 years - Living with two parents Both parents native 1,069 100.0% NativeBoth parents foreign-born 17 100.0% NativeOne native, one foreign-born parent 282 100.0% NativeChildren under 6 years - Living with one parent Native parent 930 100.0% NativeForeign-born parent 4 100.0% NativeChildren 6 to 17 years - Living with two parents Both parents native 1,773 100.0% NativeBoth parents foreign-born 181 100.0% NativeOne native, one foreign-born parent 195 81.7% Native44 18.3% Foreign-bornChildren 6 to 17 years - Living with one parent Native parent 2,559 100.0% NativeForeign-born parent 114 48.7% Native121 51.3% Foreign-born
Grandparents responsible for own grandchildren in Longview
Grandparents (30 to 59 years) White / Caucasian 52 11.1% Responsible for grandchildren415 88.9% Not responsible for grandchildrenBlack or African American 3 100.0% Responsible for grandchildrenAmerican Indian / Alaska Native 6 100.0% Not responsible for grandchildrenAsian 13 100.0% Not responsible for grandchildrenTwo or more races 24 58.8% Responsible for grandchildren17 41.2% Not responsible for grandchildrenWhite alone, not Hispanic / Latino 52 22.6% Responsible for grandchildren177 77.4% Not responsible for grandchildrenHispanic or Latino 15 100.0% Not responsible for grandchildrenGrandparents (60 years and over) White / Caucasian 217 34.1% Responsible for grandchildren419 65.9% Not responsible for grandchildrenAsian 3 100.0% Not responsible for grandchildrenWhite alone, not Hispanic / Latino 237 36.2% Responsible for grandchildren417 63.8% Not responsible for grandchildrenHispanic or Latino 2 9.1% Responsible for grandchildren22 90.9% Not responsible for grandchildren