Little Ferry, NJ (New Jersey) Houses and Residents
| Little Ferry: | $401,671 |
| New Jersey: | $428,900 |
Total population: 10,866 (Urban population: 10,800, Rural population: 0)
Houses: 4,494 (4,361 occupied: 1,762 owner occupied, 2,622 renter occupied)
| % of renters here: | 60% |
| State: | 35% |
Housing density: 2,944 houses/condos per square mile
Median price asked for vacant for-sale houses and condos in 2022 in this county: $777,739.
Median contract rent in 2022: $1,474 (lower quartile is $1,282, upper quartile is $1,896)
Median rent asked for vacant for-rent units in 2022: $2,020
Median gross rent in Little Ferry, NJ in 2022: $1,677
Housing units in Little Ferry with a mortgage: 1,066 (57 second mortgage, 33 home equity loan, 38 both second mortgage and home equity loan)
Houses without a mortgage: 96
Median household income for houses/condos with a mortgage: $118,435
Median household income for apartments without a mortgage: $46,019
Median monthly housing costs: $1,612
Compare current foreclosures in Little Ferry, NJ:
| Photo | Address | Area | Beds / Baths | Price | Details |
|---|---|---|---|---|---|

|
#1
Charles St
Little Ferry, NJ 07643
|
1,814 sq. feet
|
- baths - beds |
show details | |

|
#2
River Street Ext Apt 55
Little Ferry, NJ 07643
|
- sq. feet
|
- baths - beds |
show details | |

|
#3
Pickens St
Little Ferry, NJ 07643
|
1,712 sq. feet
|
- baths - beds |
show details | |

|
#4
Brandt St
Little Ferry, NJ 07643
|
2,496 sq. feet
|
- baths - beds |
show details | |

|
#5
Elizabeth Ct
Little Ferry, NJ 07643
|
2,100 sq. feet
|
- baths - beds |
show details | |

|
#6
Liberty St Apt 101
Little Ferry, NJ 07643
|
1,213 sq. feet
|
- baths - beds |
show details | |

|
#7
Liberty St # A8
Little Ferry, NJ 07643
|
- sq. feet
|
- baths - beds |
show details | |

|
#8
Waterside Dr # 6
Little Ferry, NJ 07643
|
- sq. feet
|
- baths - beds |
show details | |

|
#9
Washington Ave Apt 3
Little Ferry, NJ 07643
|
- sq. feet
|
- baths - beds |
show details | |

|
#10
Gates Rd
Little Ferry, NJ 07643
|
- sq. feet
|
- baths - beds |
show details |
| Photo | Address | Area | Beds / Baths | Price | Details |
|---|---|---|---|---|---|

|
#11
Liberty St, Unit 101
Little Ferry, NJ 07643
|
- sq. feet
|
- baths - beds |
show details | |

|
#12
Jackson St
Little Ferry, NJ 07643
|
1,406 sq. feet
|
- baths - beds |
show details | |

|
#13
Washington Ave # 9
Little Ferry, NJ 07643
|
- sq. feet
|
- baths - beds |
show details | |

|
#14
Columbus Ave
Little Ferry, NJ 07643
|
1,846 sq. feet
|
- baths - beds |
show details | |

|
#15
Woodland Ave # No2
Little Ferry, NJ 07643
|
1,800 sq. feet
|
- baths - beds |
show details | |

|
#16
Prospect Ave
Little Ferry, NJ 07643
|
1,305 sq. feet
|
- baths - beds |
show details | |

|
#17
Henches Pl
Little Ferry, NJ 07643
|
1,723 sq. feet
|
- baths - beds |
show details | |

|
#18
Saint John St
Little Ferry, NJ 07643
|
2,580 sq. feet
|
- baths - beds |
show details | |

|
#19
River Street Ext Apt 50
Little Ferry, NJ 07643
|
- sq. feet
|
- baths - beds |
show details | |

|
#20
Bertolotto Ave
Little Ferry, NJ 07643
|
1,454 sq. feet
|
- baths - beds |
show details |
| Photo | Address | Area | Beds / Baths | Price | Details |
|---|---|---|---|---|---|

|
#21
Treptow St
Little Ferry, NJ 07643
|
2,517 sq. feet
|
- baths - beds |
show details | |

|
#22
Hester St
Little Ferry, NJ 07643
|
1,960 sq. feet
|
- baths - beds |
show details | |

|
#23
Eckel Rd
Little Ferry, NJ 07643
|
1,991 sq. feet
|
- baths - beds |
show details | |

|
#24
Grand St
Little Ferry, NJ 07643
|
- sq. feet
|
- baths - beds |
show details | |

|
#25
Mehrhof Rd
Little Ferry, NJ 07643
|
2,440 sq. feet
|
- baths - beds |
show details | |

|
#26
Eckel Rd
Little Ferry, NJ 07643
|
1,640 sq. feet
|
- baths - beds |
show details | |

|
#27
Bertolotto Ave
Little Ferry, NJ 07643
|
1,454 sq. feet
|
- baths - beds |
show details | |

|
#28
Columbus Ave
Little Ferry, NJ 07643
|
2,408 sq. feet
|
- baths - beds |
show details | |

|
#29
Carlson St
Little Ferry, NJ 07643
|
1,400 sq. feet
|
- baths - beds |
show details | |

|
#30
Mehrhof Rd
Little Ferry, NJ 07643
|
- sq. feet
|
- baths - beds |
show details |
| Photo | Address | Area | Beds / Baths | Price | Details |
|---|---|---|---|---|---|

|
Check over 1 million property listings on Foreclosure.com!
|
browse all offers | |||
| Photo | Address | Area | Beds / Baths | Price | Details |
|---|


 | Where to rent in NJ, moving from FL (8 replies) |
| How safe is the neighbourhood of Carol Apartments, Hackensack, NJ? (2 replies) |
| 2 family house in Bergen County (8 replies) |
| opinions on Colt's Neck (69 replies) |
| Asian Indian family moving to NJ (14 replies) |
| Korean Community Palisades Park Area? (7 replies) |

Median year apartment built: 1971
Household type by relationship:
Households: 10,951- Male householders: 2,322 (664 living alone), Female householders: 2,010 (644 living alone)
2,241 spouses (2,195 opposite-sex spouses), 87 unmarried partners, (87 opposite-sex unmarried partners), 3,068 children (2,989 natural, 20 adopted, 57 stepchildren), 102 grandchildren, 166 brothers or sisters, 435 parents, 0 foster children, 175 other relatives, 332 non-relatives
- In group quarters: 5
Size of family households: 1,245 2-persons, 598 3-persons, 567 4-persons, 235 5-persons, 303 6-persons, 26 7-or-more-persons.
Size of nonfamily households: 1,353 1-person, 80 2-persons, 13 3-persons.
1,355 married couples with children.
223 single-parent households (45 men, 178 women).
43.1% of residents of Little Ferry speak English at home.
28.8% of residents speak Spanish at home (53% speak English very well, 22% speak English well, 18% speak English not well, 8% don't speak English at all).
13.4% of residents speak other Indo-European language at home (63% speak English very well, 23% speak English well, 8% speak English not well, 7% don't speak English at all).
13.1% of residents speak Asian or Pacific Island language at home (41% speak English very well, 22% speak English well, 36% speak English not well, 1% don't speak English at all).
2.9% of residents speak other language at home (65% speak English very well, 12% speak English well, 23% speak English not well).
Foreign born population: 4,734 (43.2%)
(63.6% of them are naturalized citizens)
| Here: | 6.3 |
| State: | 6.8 |
| Here: | 3.5 |
| State: | 3.9 |

- Bedrooms in owner-occupied houses and condos in Little Ferry, New Jersey
- 0no bedroom
- 1811 bedroom
- 3452 bedrooms
- 7193 bedrooms
- 3924 bedrooms
- 1255+ bedrooms

- Bedrooms in renter-occupied apartments in Little Ferry, New Jersey
- 228no bedroom
- 1,2101 bedroom
- 6172 bedrooms
- 4713 bedrooms
- 594 bedrooms
- 375+ bedrooms

- Cars and other vehicles available in Little Ferry in owner-occupied houses/condos
- 113no vehicle
- 6941 vehicle
- 3982 vehicles
- 3603 vehicles
- 1324 vehicles
- 665+ vehicles

- Cars and other vehicles available in Little Ferry in renter-occupied apartments
- 316no vehicle
- 1,1691 vehicle
- 7202 vehicles
- 2903 vehicles
- 624 vehicles
- 655+ vehicles

- Rooms in owner-occupied houses in Little Ferry, New Jersey
- 01 room
- 252 rooms
- 803 rooms
- 1184 rooms
- 2975 rooms
- 3926 rooms
- 2147 rooms
- 2888 rooms
- 3479+ rooms

- Rooms in renter-occupied apartments in Little Ferry, New Jersey
- 2281 room
- 2142 rooms
- 8133 rooms
- 5424 rooms
- 3575 rooms
- 2646 rooms
- 1477 rooms
- 198 rooms
- 379+ rooms


Little Ferry, NJ household income distribution

- 203Less than $10,000
- 202$10,000 to $19,999
- 312$20,000 to $29,999
- 342$30,000 to $39,999
- 438$40,000 to $49,999
- 284$50,000 to $59,999
- 482$60,000 to $74,999
- 429$75,000 to $99,999
- 411$100,000 to $124,999
- 335$125,000 to $149,999
- 510$150,000 to $199,999
- 440$200,000 or more

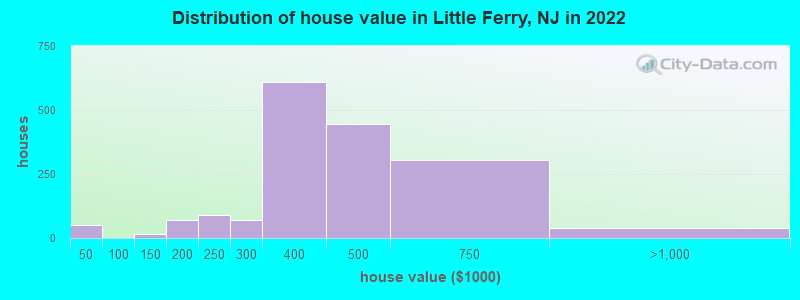
Home value of owner - occupied houses in 2022 in Little Ferry, NJ
-
- 8Less than $10,000
- 6$15,000 to $19,999
- 35$25,000 to $29,999
- 8$100,000 to $124,999
- 7$125,000 to $149,999
- 39$150,000 to $174,999
- 32$175,000 to $199,999
- 89$200,000 to $249,999
- 69$250,000 to $299,999
- 608$300,000 to $399,999
- 443$400,000 to $499,999
- 304$500,000 to $749,999
- 36$750,000 to $999,999
- 5$1,000,000 to $1,499,999
Rent paid by renters in 2022 in Little Ferry, NJ
-
- 16$350 to $399
- 18$450 to $499
- 8$550 to $599
- 44$750 to $799
- 49$800 to $899
- 6$900 to $999
- 346$1,000 to $1,249
- 827$1,250 to $1,499
- 693$1,500 to $1,999
- 241$2,000 to $2,499
- 238$2,500 to $2,999
- 28$3,000 to $3,499
- 53No cash rent

Percentage of workers working in this county: 61.3%
Number of people working at home: 334 (5.6% of all workers)
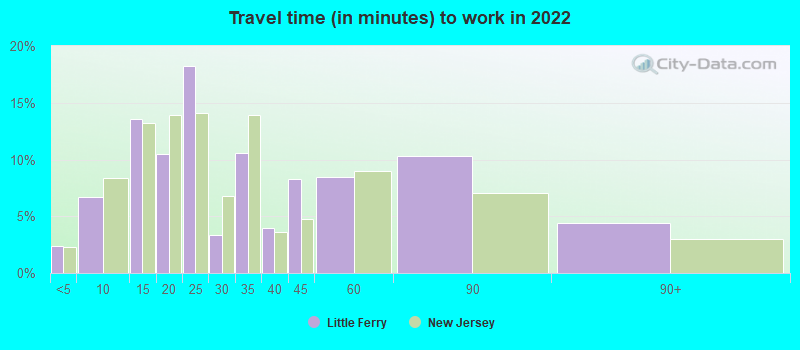
Travel time to work (commute)
- Less than 5 minutes: 185
- 5 to 9 minutes: 382
- 10 to 14 minutes: 985
- 15 to 19 minutes: 584
- 20 to 24 minutes: 768
- 25 to 29 minutes: 255
- 30 to 34 minutes: 424
- 35 to 39 minutes: 229
- 40 to 44 minutes: 399
- 45 to 59 minutes: 749
- 60 to 89 minutes: 351
- 90 or more minutes: 144
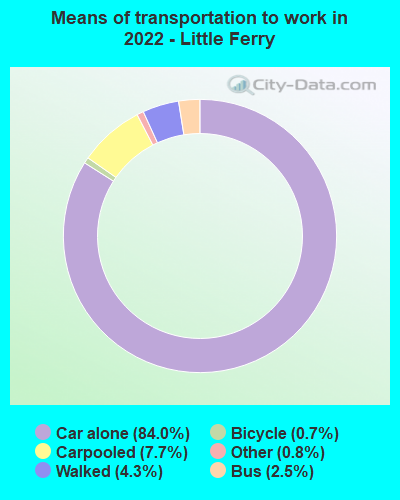
Means of transportation to work:
- Drove a car alone: 2,497 (72.3%)
- Carpooled: 275 (8.0%)
- Bus: 67 (1.9%)
- Taxi: 28 (0.8%)
- Bicycle: 13 (0.4%)
- Walked: 136 (3.9%)
- Worked at home: 334 (9.7%)
- Unemployment by race in 2022
- Unemployment rate for White non-Hispanic residents
- 5.8%Males
- 6.6%Females
- Unemployment rate for Asian residents
- 5.4%Males
- 8.1%Females
- Unemployment rate for other race residents
- 3.7%Males
- Unemployment rate for two or more race residents
- 14.5%Males
- Unemployment rate for Hispanic or Latino residents
- 7.4%Males
- 3.3%Females

- Year of entry for the foreign-born population in Little Ferry, New Jersey
- 1,1822010 or later
- 1,3282000 to 2009
- 1,0691990 to 1999
- 1,0861980 to 1989
- 4401970 to 1979
- 509Before 1970

First ancestries reported:
- Italian: 836 (10.9%)
- Irish: 253 (3.3%)
- Albanian: 203 (2.7%)
- Egyptian: 196 (2.6%)
- Turkish: 186 (2.4%)
- Polish: 160 (2.1%)
- English: 154 (2.0%)
- American: 123 (1.6%)
- German: 108 (1.4%)
- Greek: 108 (1.4%)
- Palestinian: 47 (0.6%)
- Portuguese: 43 (0.6%)
- Jordanian: 42 (0.5%)
- Czech: 32 (0.4%)
- Scotch-Irish: 30 (0.4%)
- French: 29 (0.4%)
- Brazilian: 22 (0.3%)
- French Canadian: 13 (0.2%)
- Russian: 6 (0.08%)
- Austrian: 5 (0.07%)
- Danish: 4 (0.05%)
- Nigerian: 1 (0.01%)
Most common places of birth for foreign-born residents (%):
| Little Ferry: | 16.5% (781) |
| New Jersey: | 4.4% (95,275) |
| Little Ferry: | 15.6% (738) |
| New Jersey: | 3.3% (70,512) |
| Little Ferry: | 11.0% (521) |
| New Jersey: | 9.7% (209,055) |
| Little Ferry: | 6.5% (307) |
| New Jersey: | 4.2% (90,817) |
| Little Ferry: | 5.5% (261) |
| New Jersey: | 0.5% (10,042) |
| Little Ferry: | 5.0% (236) |
| New Jersey: | 12.8% (274,609) |
| Little Ferry: | 4.3% (203) |
| New Jersey: | 4.0% (85,934) |
| Little Ferry: | 4.1% (195) |
| New Jersey: | 1.7% (37,335) |
| Little Ferry: | 3.9% (186) |
| New Jersey: | 1.5% (33,198) |
| Little Ferry: | 3.3% (155) |
| New Jersey: | 0.3% (6,130) |
| Little Ferry: | 3.3% (155) |
| New Jersey: | 2.7% (58,563) |
| Little Ferry: | 2.9% (138) |
| New Jersey: | 2.1% (45,435) |
| Little Ferry: | 2.8% (132) |
| New Jersey: | 1.6% (33,678) |
| Little Ferry: | 2.4% (113) |
| New Jersey: | 3.7% (78,969) |
| Little Ferry: | 2.2% (105) |
| New Jersey: | 0.2% (4,579) |
| Little Ferry: | 1.8% (85) |
| New Jersey: | 0.3% (7,501) |
| Little Ferry: | 1.5% (73) |
| New Jersey: | 0.7% (15,644) |
Place of birth for U.S.-born residents:
- This state: 3,738
- Other state: 2,071
- Northeast: 1,860
- Midwest: 111
- South: 34
- West: 36
85.8% of Little Ferry residents lived in the same house 1 years ago.
Out of people who lived in different houses, 39.7% lived in this county.
Out of people who lived in different counties, 55.1% lived in New Jersey.
| Little Ferry: | 85.8% |
| State average: | 90.4% |
Education attainment for males 25 years and older:
- No schooling: 47
- Nursery to 4th grade: 18
- 5th and 6th grade: 123
- 7th and 8th grade: 16
- 9th grade: 16
- 10th grade: 86
- 11th grade: 8
- 12th grade, no diploma: 202
- High school graduate (or equivalency): 1,214
- Less than 1 year of college: 88
- Some college more than 1 year, no degree: 566
- Associate degree: 302
- Bachelor's degree: 877
- Master's degree: 302
- Professional school degree: 95
- Doctorate degree: 6

Education attainment for females 25 years and older:
- No schooling: 111
- Nursery to 4th grade: 0
- 5th and 6th grade: 10
- 7th and 8th grade: 67
- 9th grade: 7
- 10th grade: 17
- 11th grade: 43
- 12th grade, no diploma: 75
- High school graduate (or equivalency): 1,106
- Less than 1 year of college: 233
- Some college more than 1 year, no degree: 627
- Associate degree: 332
- Bachelor's degree: 1,021
- Master's degree: 275
- Professional school degree: 104
- Doctorate degree: 60


Housing units in structures:
- One, detached: 1,800
- One, attached: 221
- Two: 623
- 3 or 4: 354
- 5 to 9: 320
- 10 to 19: 541
- 20 to 49: 333
- 50 or more: 299
House/condo owner moved in on average 17 years ago
Renter moved in on average 5 years ago

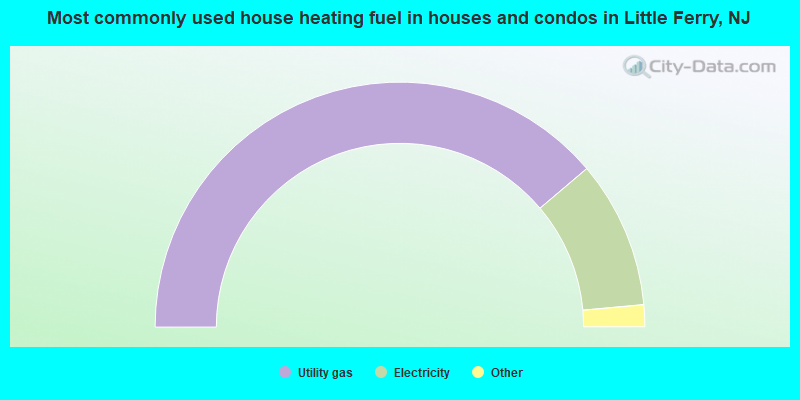
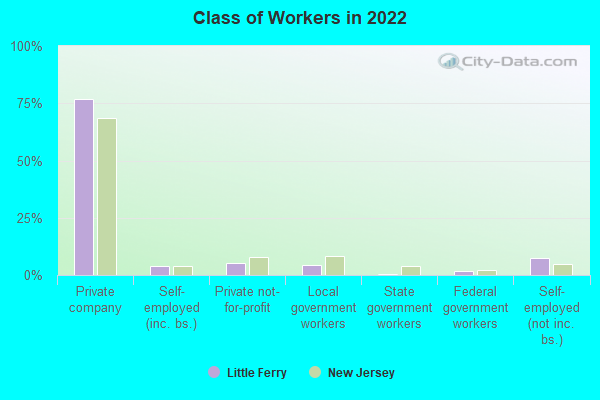
- 77.7%Utility gas
- 19.5%Electricity
- 1.8%Bottled, tank, or LP gas
- 1.1%Fuel oil, kerosene, etc.
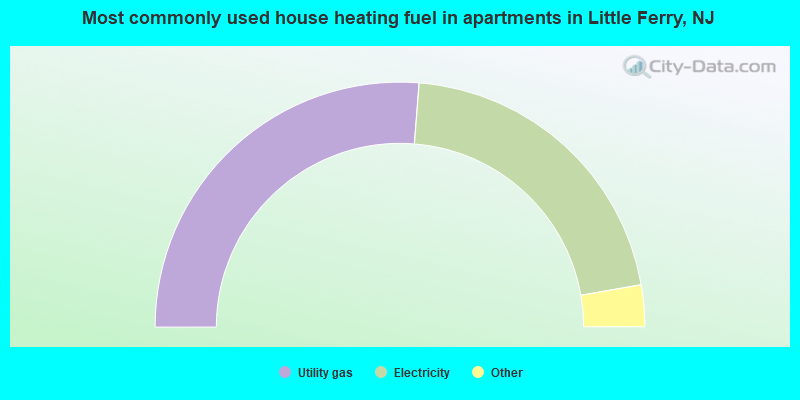
- 52.5%Utility gas
- 42.0%Electricity
- 3.5%Fuel oil, kerosene, etc.
- 1.3%Bottled, tank, or LP gas
- 0.5%No fuel used
- 0.1%Other fuel
Private vs. public school enrollment:
| Here: | 3.6% |
| New Jersey: | 12.3% |
| Here: | 5.8% |
| New Jersey: | 13.1% |
| Here: | 18.0% |
| New Jersey: | 33.2% |


