Races in Little Ferry, New Jersey (NJ) Detailed Stats
Data:
Races - White alone (%)
Races - White alone (% change since 2000)
Races - Black alone (%)
Races - Black alone (% change since 2000)
Races - American Indian alone (%)
Races - American Indian alone (% change since 2000)
Races - Asian alone (%)
Races - Asian alone (% change since 2000)
Races - Hispanic (%)
Races - Hispanic (% change since 2000)
Races - Native Hawaiian and Other Pacific Islander alone (%)
Races - Native Hawaiian and Other Pacific Islander alone (% change since 2000)
Races - Two or more races(%)
Races - Two or more races(% change since 2000)
Races - Other race alone (%)
Races - Other race alone (% change since 2000)
Racial diversity
Place of birth - Born in state of residence (%)
Place of birth - Born in state of residence (%) - White
Place of birth - Born in state of residence (%) - Black or African American
Place of birth - Born in state of residence (%) - Asian
Place of birth - Born in state of residence (%) - Hispanic or Latino
Place of birth - Born in state of residence (%) - American Indian and Alaska Native
Place of birth - Born in state of residence (%) - Multirace
Place of birth - Born in state of residence (%) - Other Race
Place of birth - Born in other state (%)
Place of birth - Born in other state (%) - White
Place of birth - Born in other state (%) - Black or African American
Place of birth - Born in other state (%) - Asian
Place of birth - Born in other state (%) - Hispanic or Latino
Place of birth - Born in other state (%) - American Indian and Alaska Native
Place of birth - Born in other state (%) - Multirace
Place of birth - Born in other state (%) - Other Race
Place of birth - Native, outside of US (%)
Place of birth - Native, outside of US (%) - White
Place of birth - Native, outside of US (%) - Black or African American
Place of birth - Native, outside of US (%) - Asian
Place of birth - Native, outside of US (%) - Hispanic or Latino
Place of birth - Native, outside of US (%) - American Indian and Alaska Native
Place of birth - Native, outside of US (%) - Multirace
Place of birth - Native, outside of US (%) - Other Race
Place of birth - Foreign born (%)
Place of birth - Foreign born (%) - White
Place of birth - Foreign born (%) - Black or African American
Place of birth - Foreign born (%) - Asian
Place of birth - Foreign born (%) - Hispanic or Latino
Place of birth - Foreign born (%) - American Indian and Alaska Native
Place of birth - Foreign born (%) - Multirace
Place of birth - Foreign born (%) - Other Race
Residents speaking English at home (%)
Residents speaking English at home - Born in the United States (%)
Residents speaking English at home - Native, born elsewhere (%)
Residents speaking English at home - Foreign born (%)
Residents speaking Spanish at home (%)
Residents speaking Spanish at home - Born in the United States (%)
Residents speaking Spanish at home - Native, born elsewhere (%)
Residents speaking Spanish at home - Foreign born (%)
Residents speaking other language at home (%)
Residents speaking other language at home - Born in the United States (%)
Residents speaking other language at home - Native, born elsewhere (%)
Residents speaking other language at home - Foreign born (%)
Marital status - Never married (%)
Marital status - Now married (%)
Marital status - Separated (%)
Marital status - Widowed (%)
Marital status - Divorced (%)
Ancestries Reported - Arab (%)
Ancestries Reported - Czech (%)
Ancestries Reported - Danish (%)
Ancestries Reported - Dutch (%)
Ancestries Reported - English (%)
Ancestries Reported - French (%)
Ancestries Reported - French Canadian (%)
Ancestries Reported - German (%)
Ancestries Reported - Greek (%)
Ancestries Reported - Hungarian (%)
Ancestries Reported - Irish (%)
Ancestries Reported - Italian (%)
Ancestries Reported - Lithuanian (%)
Ancestries Reported - Norwegian (%)
Ancestries Reported - Polish (%)
Ancestries Reported - Portuguese (%)
Ancestries Reported - Russian (%)
Ancestries Reported - Scotch-Irish (%)
Ancestries Reported - Scottish (%)
Ancestries Reported - Slovak (%)
Ancestries Reported - Subsaharan African (%)
Ancestries Reported - Swedish (%)
Ancestries Reported - Swiss (%)
Ancestries Reported - Ukrainian (%)
Ancestries Reported - United States (%)
Ancestries Reported - Welsh (%)
Ancestries Reported - West Indian (%)
Ancestries Reported - Other (%)
Geographical mobility - Same house 1 year ago (%)
Geographical mobility - Same house 1 year ago (%) - White
Geographical mobility - Same house 1 year ago (%) - Black or African American
Geographical mobility - Same house 1 year ago (%) - Asian
Geographical mobility - Same house 1 year ago (%) - Hispanic or Latino
Geographical mobility - Same house 1 year ago (%) - American Indian and Alaska Native
Geographical mobility - Same house 1 year ago (%) - Multirace
Geographical mobility - Same house 1 year ago (%) - Other Race
Geographical mobility - Moved within same county (%)
Geographical mobility - Moved within same county (%) - White
Geographical mobility - Moved within same county (%) - Black or African American
Geographical mobility - Moved within same county (%) - Asian
Geographical mobility - Moved within same county (%) - Hispanic or Latino
Geographical mobility - Moved within same county (%) - American Indian and Alaska Native
Geographical mobility - Moved within same county (%) - Multirace
Geographical mobility - Moved within same county (%) - Other Race
Geographical mobility - Moved from different county within same state (%)
Geographical mobility - Moved from different county within same state (%) - White
Geographical mobility - Moved from different county within same state (%) - Black or African American
Geographical mobility - Moved from different county within same state (%) - Asian
Geographical mobility - Moved from different county within same state (%) - Hispanic or Latino
Geographical mobility - Moved from different county within same state (%) - American Indian and Alaska Native
Geographical mobility - Moved from different county within same state (%) - Multirace
Geographical mobility - Moved from different county within same state (%) - Other Race
Geographical mobility - Moved from different state (%)
Geographical mobility - Moved from different state (%) - White
Geographical mobility - Moved from different state (%) - Black or African American
Geographical mobility - Moved from different state (%) - Asian
Geographical mobility - Moved from different state (%) - Hispanic or Latino
Geographical mobility - Moved from different state (%) - American Indian and Alaska Native
Geographical mobility - Moved from different state (%) - Multirace
Geographical mobility - Moved from different state (%) - Other Race
Geographical mobility - Moved from abroad (%)
Geographical mobility - Moved from abroad (%) - White
Geographical mobility - Moved from abroad (%) - Black or African American
Geographical mobility - Moved from abroad (%) - Asian
Geographical mobility - Moved from abroad (%) - Hispanic or Latino
Geographical mobility - Moved from abroad (%) - American Indian and Alaska Native
Geographical mobility - Moved from abroad (%) - Multirace
Geographical mobility - Moved from abroad (%) - Other Race
Place of birth for the foreign-born population - Ireland (%)
Place of birth for the foreign-born population - Denmark (%)
Place of birth for the foreign-born population - Norway (%)
Place of birth for the foreign-born population - Sweden (%)
Place of birth for the foreign-born population - United Kingdom (%)
Place of birth for the foreign-born population - England (%)
Place of birth for the foreign-born population - Scotland (%)
Place of birth for the foreign-born population - Other Northern Europe (%)
Place of birth for the foreign-born population - Austria (%)
Place of birth for the foreign-born population - Belgium (%)
Place of birth for the foreign-born population - France (%)
Place of birth for the foreign-born population - Germany (%)
Place of birth for the foreign-born population - Netherlands (%)
Place of birth for the foreign-born population - Switzerland (%)
Place of birth for the foreign-born population - Other Western Europe (%)
Place of birth for the foreign-born population - Greece (%)
Place of birth for the foreign-born population - Italy (%)
Place of birth for the foreign-born population - Portugal (%)
Place of birth for the foreign-born population - Spain (%)
Place of birth for the foreign-born population - Other Southern Europe (%)
Place of birth for the foreign-born population - Albania (%)
Place of birth for the foreign-born population - Belarus (%)
Place of birth for the foreign-born population - Bosnia and Herzegovina (%)
Place of birth for the foreign-born population - Bulgaria (%)
Place of birth for the foreign-born population - Croatia (%)
Place of birth for the foreign-born population - Czechoslovakia (%)
Place of birth for the foreign-born population - Hungary (%)
Place of birth for the foreign-born population - Latvia (%)
Place of birth for the foreign-born population - Lithuania (%)
Place of birth for the foreign-born population - North Macedonia (Macedonia) (%)
Place of birth for the foreign-born population - Moldova (%)
Place of birth for the foreign-born population - Poland (%)
Place of birth for the foreign-born population - Romania (%)
Place of birth for the foreign-born population - Russia (%)
Place of birth for the foreign-born population - Serbia (%)
Place of birth for the foreign-born population - Ukraine (%)
Place of birth for the foreign-born population - Other Eastern Europe (%)
Place of birth for the foreign-born population - China (%)
Place of birth for the foreign-born population - Hong Kong (%)
Place of birth for the foreign-born population - Taiwan (%)
Place of birth for the foreign-born population - Japan (%)
Place of birth for the foreign-born population - Korea (%)
Place of birth for the foreign-born population - Other Eastern Asia (%)
Place of birth for the foreign-born population - Afghanistan (%)
Place of birth for the foreign-born population - Bangladesh (%)
Place of birth for the foreign-born population - India (%)
Place of birth for the foreign-born population - Iran (%)
Place of birth for the foreign-born population - Kazakhstan (%)
Place of birth for the foreign-born population - Nepal (%)
Place of birth for the foreign-born population - Pakistan (%)
Place of birth for the foreign-born population - Sri Lanka (%)
Place of birth for the foreign-born population - Uzbekistan (%)
Place of birth for the foreign-born population - Other South Central Asia (%)
Place of birth for the foreign-born population - Burma (%)
Place of birth for the foreign-born population - Cambodia (%)
Place of birth for the foreign-born population - Indonesia (%)
Place of birth for the foreign-born population - Laos (%)
Place of birth for the foreign-born population - Malaysia (%)
Place of birth for the foreign-born population - Philippines (%)
Place of birth for the foreign-born population - Singapore (%)
Place of birth for the foreign-born population - Thailand (%)
Place of birth for the foreign-born population - Vietnam (%)
Place of birth for the foreign-born population - Other South Eastern Asia (%)
Place of birth for the foreign-born population - Armenia (%)
Place of birth for the foreign-born population - Iraq (%)
Place of birth for the foreign-born population - Israel (%)
Place of birth for the foreign-born population - Jordan (%)
Place of birth for the foreign-born population - Kuwait (%)
Place of birth for the foreign-born population - Lebanon (%)
Place of birth for the foreign-born population - Saudi Arabia (%)
Place of birth for the foreign-born population - Syria (%)
Place of birth for the foreign-born population - Turkey (%)
Place of birth for the foreign-born population - Yemen (%)
Place of birth for the foreign-born population - Other Western Asia (%)
Place of birth for the foreign-born population - Eritrea (%)
Place of birth for the foreign-born population - Ethiopia (%)
Place of birth for the foreign-born population - Kenya (%)
Place of birth for the foreign-born population - Somalia (%)
Place of birth for the foreign-born population - Uganda (%)
Place of birth for the foreign-born population - Zimbabwe (%)
Place of birth for the foreign-born population - Other Eastern Africa (%)
Place of birth for the foreign-born population - Cameroon (%)
Place of birth for the foreign-born population - Congo (%)
Place of birth for the foreign-born population - Democratic Republic of Congo (Zaire) (%)
Place of birth for the foreign-born population - Other Middle Africa (%)
Place of birth for the foreign-born population - Egypt (%)
Place of birth for the foreign-born population - Morocco (%)
Place of birth for the foreign-born population - Sudan (%)
Place of birth for the foreign-born population - Other Northern Africa (%)
Place of birth for the foreign-born population - South Africa (%)
Place of birth for the foreign-born population - Other Southern Africa (%)
Place of birth for the foreign-born population - Cabo Verde (%)
Place of birth for the foreign-born population - Ghana (%)
Place of birth for the foreign-born population - Liberia (%)
Place of birth for the foreign-born population - Nigeria (%)
Place of birth for the foreign-born population - Senegal (%)
Place of birth for the foreign-born population - Sierra Leone (%)
Place of birth for the foreign-born population - Other Western Africa (%)
Place of birth for the foreign-born population - Australia (%)
Place of birth for the foreign-born population - New Zealand (%)
Place of birth for the foreign-born population - Fiji (%)
Place of birth for the foreign-born population - Micronesia (%)
Place of birth for the foreign-born population - Bahamas (%)
Place of birth for the foreign-born population - Barbados (%)
Place of birth for the foreign-born population - Cuba (%)
Place of birth for the foreign-born population - Dominica (%)
Place of birth for the foreign-born population - Dominican Republic (%)
Place of birth for the foreign-born population - Grenada (%)
Place of birth for the foreign-born population - Haiti (%)
Place of birth for the foreign-born population - Jamaica (%)
Place of birth for the foreign-born population - St. Vincent and the Grenadines (%)
Place of birth for the foreign-born population - Trinidad and Tobago (%)
Place of birth for the foreign-born population - West Indies (%)
Place of birth for the foreign-born population - Other Caribbean (%)
Place of birth for the foreign-born population - Belize (%)
Place of birth for the foreign-born population - Costa Rica (%)
Place of birth for the foreign-born population - El Salvador (%)
Place of birth for the foreign-born population - Guatemala (%)
Place of birth for the foreign-born population - Honduras (%)
Place of birth for the foreign-born population - Mexico (%)
Place of birth for the foreign-born population - Nicaragua (%)
Place of birth for the foreign-born population - Panama (%)
Place of birth for the foreign-born population - Other Central America (%)
Place of birth for the foreign-born population - Argentina (%)
Place of birth for the foreign-born population - Bolivia (%)
Place of birth for the foreign-born population - Brazil (%)
Place of birth for the foreign-born population - Chile (%)
Place of birth for the foreign-born population - Colombia (%)
Place of birth for the foreign-born population - Ecuador (%)
Place of birth for the foreign-born population - Guyana (%)
Place of birth for the foreign-born population - Peru (%)
Place of birth for the foreign-born population - Uruguay (%)
Place of birth for the foreign-born population - Venezuela (%)
Place of birth for the foreign-born population - Other South America (%)
Place of birth for the foreign-born population - Canada (%)
Place of birth for the foreign-born population - Other Northern America (%)
Place of birth for the foreign-born population - Other (%)
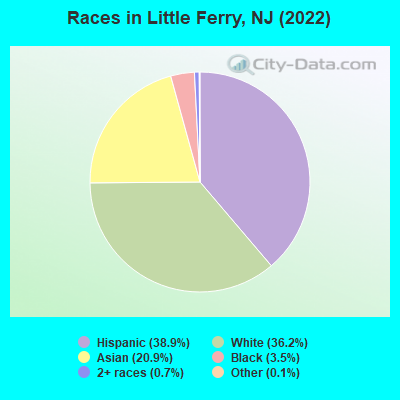
According to 2022 data, the most numerous races in Little Ferry, NJ are White alone (3,967 residents), Hispanic (4,260 residents), and Black alone (385 residents). 43.1% of Little Ferry residents speak English at home. 43.2% of Little Ferry, NJ residents are foreign-born (18.6% born in Latin America, 15.5% born in Asia, 6.6% born in Europe), which is 46.8% greater than the foreign-born rate of 23.0% across the entire state of New Jersey.
Race distribution in Little Ferry
2000 2022
5,557,209 66.0% White alone 1,117,191 13.3% Hispanic 1,096,171 13.0% Black alone 477,012 5.7% Asian alone 133,689 1.6% Two or more races 19,565 0.2% Other race alone 11,338 0.1% American Indian alone 2,175 0.03% Native Hawaiian and Other
4,766,476 51.5% White alone 2,028,470 21.9% Hispanic 1,111,632 12.0% Black alone 923,546 10.0% Asian alone 332,237 3.6% Two or more races 89,847 1.0% Other race alone 8,557 0.09% American Indian alone 934 0.01% Native Hawaiian and Other
Income and house value in Little Ferry Median household income in 2022 $61,217 White non-Hispanic householders$158,801 Black householders$83,980 Asian householders$48,806 Two or more races householders$87,207 Hispanic or Latino race householdersMedian 2022 house value $411,948 White Non-Hispanic householders$340,843 Black or African American householders $392,861 Asian householders$369,789 Some other race householders$495,219 Two or more races householders$387,408 Hispanic or Latino householders
Median age by race in Little Ferry
53.6 Median age for White residents46.0 56.5 43.8 Median age for Black or African American residents33.9 42.7 12.4 Median age for American Indian / Alaska Native residents-686,322,685.6 11.4 48.1 Median age for Asian residents50.4 46.2 -510,460,250.5 Median age for Native Hawaiian / Pacific Islander residents-514,767,932.0 -713,070,378.3 36.5 Median age for Other race residents36.5 38.8 45.6 Median age for Two or more races residents46.4 44.5 55.5 Median age for White alone residents52.9 58.9 39.4 Median age for Hispanic or Latino residents37.8 40.2
Owner/renter occupied households by race in Little Ferry
House owners and renters - White residents 1,160 54.5% Owner occupied970 45.5% Renter occupiedHouse owners and renters - Black or African American residents 13 7.4% Owner occupied160 92.6% Renter occupiedHouse owners and renters - American Indian / Alaska Native residents 30 86.9% Owner occupied4 13.1% Renter occupiedHouse owners and renters - Asian residents 252 26.6% Owner occupied694 73.4% Renter occupiedHouse owners and renters - Other race residents 104 20.4% Owner occupied405 79.6% Renter occupiedHouse owners and renters - Two or more races residents 261 34.7% Owner occupied491 65.3% Renter occupiedHouse owners and renters - White alone residents 1,020 53.3% Owner occupied895 46.7% Renter occupiedHouse owners and renters - Hispanic or Latino residents 531 39.9% Owner occupied801 60.1% Renter occupied
Language usage in Little Ferry
English speakers - Total 43.1% of residents of Little Ferry speak English at home.
28.9% of residents speak Spanish at home 1,586 52.5% Speak English very well1,434 47.5% Speak English less than very well29.4% of residents speak other language at home 1,627 53.0% Speak English very well1,440 47.0% Speak English less than very well
English speakers - Born in the United States 75.0% of residents of Little Ferry speak English at home.
12.1% of residents speak Spanish at home 221 94.0% Speak English very well14 6.0% Speak English less than very well12.2% of residents speak other language at home 183 76.9% Speak English very well55 23.1% Speak English less than very well
English speakers - Native, born elsewhere 55.6% of residents of Little Ferry speak English at home.
14.2% of residents speak Spanish at home 58 100.0% Speak English very well33.1% of residents speak other language at home 37 27.4% Speak English very well98 72.6% Speak English less than very well
English speakers - Foreign-born 14.9% of residents of Little Ferry speak English at home.
41.7% of residents speak Spanish at home 649 33.0% Speak English very well1,318 67.0% Speak English less than very well44.5% of residents speak other language at home 824 39.2% Speak English very well1,279 60.8% Speak English less than very well
White (Caucasian) - Speak only English Native:
79.0% (2,661)Foreign-born:
19.4% (226)
White (Caucasian) - Speak another language Native:
18.4% (618)Foreign-born:
80.0% (930)
American Indian / Alaska Native - Speak another language Native:
100.0% (49)Foreign-born:
100.0% (56)
Asian - Speak only English Native:
38.4% (226)Foreign-born:
20.1% (324)
Asian - Speak another language Native:
61.3% (360)Foreign-born:
79.6% (1,286)
Other race - Speak only English Native:
4.5% (31)Foreign-born:
1.1% (12)
Other race - Speak another language Native:
100.0% (690)Foreign-born:
100.0% (1,099)
Two or more races - Speak only English Native:
61.5% (545)Foreign-born:
15.9% (193)
Two or more races - Speak another language Native:
38.0% (337)Foreign-born:
83.4% (1,011)
White alone - Speak only English Native:
79.6% (2,303)Foreign-born:
23.5% (221)
White alone - Speak another language Native:
19.7% (571)Foreign-born:
76.4% (719)
Hispanic or Latino - Speak only English Native:
44.8% (836)Foreign-born:
8.5% (186)
Hispanic or Latino - Speak another language Native:
54.0% (1,008)Foreign-born:
91.4% (1,999)
Foreign-born residents in Little Ferry 4,734 residents are foreign born (18.6% Latin America , 15.5% Asia , 6.6% Europe ).
This city:
43.2%New Jersey:
23.2%
Marital status for residents in Little Ferry Marital status - White (Caucasian) population 15 years and over
Males 38.2% Never married47.0% Now married0.0% Separated2.9% Widowed11.9% DivorcedFemales 27.7% Never married43.8% Now married1.2% Separated12.6% Widowed14.7% DivorcedWomen who gave birth in the past 12 months Now married:
100.0% (51)Unmarried:
0.0% (0)
Women who did not give birth in the past 12 months Now married:
40.7% (307)Unmarried:
59.3% (448)
Marital status - Black or African American population 15 years and over
Males 56.8% Never married43.2% Now married0.0% Separated0.0% Widowed0.0% DivorcedFemales 61.9% Never married19.2% Now married0.0% Separated15.0% Widowed3.9% DivorcedWomen who did not give birth in the past 12 months Now married:
16.3% (33)Unmarried:
83.7% (169)
Marital status - American Indian / Alaska Native population 15 years and over
Males 10.0% Never married90.0% Now married0.0% Separated0.0% Widowed0.0% DivorcedFemales 0.0% Never married100.0% Now married0.0% Separated0.0% Widowed0.0% DivorcedWomen who did not give birth in the past 12 months Now married:
100.0% (34)Unmarried:
0.0% (0)
Marital status - Asian population 15 years and over
Males 18.4% Never married74.7% Now married1.0% Separated0.0% Widowed5.9% DivorcedFemales 22.7% Never married68.0% Now married0.0% Separated1.8% Widowed7.5% DivorcedWomen who gave birth in the past 12 months Now married:
100.0% (18)Unmarried:
0.0% (0)
Women who did not give birth in the past 12 months Now married:
56.6% (326)Unmarried:
43.4% (250)
Marital status - Other race population 15 years and over
Males 21.7% Never married73.2% Now married0.0% Separated2.3% Widowed2.7% DivorcedFemales 16.0% Never married84.0% Now married0.0% Separated0.0% Widowed0.0% DivorcedWomen who gave birth in the past 12 months Now married:
100.0% (14)Unmarried:
0.0% (0)
Women who did not give birth in the past 12 months Now married:
77.5% (376)Unmarried:
22.5% (110)
Marital status - Two or more races population 15 years and over
Males 37.2% Never married62.8% Now married0.0% Separated0.0% Widowed0.0% DivorcedFemales 42.9% Never married42.6% Now married0.0% Separated0.0% Widowed14.5% DivorcedWomen who gave birth in the past 12 months Now married:
0.0% (0)Unmarried:
100.0% (1)
Women who did not give birth in the past 12 months Now married:
28.6% (156)Unmarried:
71.4% (390)
Marital status - White alone, not Hispanic / Latino population 15 years and over
Males 38.8% Never married41.1% Now married0.0% Separated3.6% Widowed16.5% DivorcedFemales 27.7% Never married42.2% Now married0.0% Separated15.1% Widowed15.0% DivorcedWomen who gave birth in the past 12 months Now married:
100.0% (59)Unmarried:
0.0% (0)
Women who did not give birth in the past 12 months Now married:
32.6% (188)Unmarried:
67.4% (389)
Marital status - Hispanic or Latino population 15 years and over
Males 32.5% Never married65.8% Now married0.0% Separated1.0% Widowed0.7% DivorcedFemales 29.1% Never married57.6% Now married2.0% Separated0.8% Widowed10.4% DivorcedWomen who gave birth in the past 12 months Now married:
88.9% (8)Unmarried:
11.1% (1)
Women who did not give birth in the past 12 months Now married:
54.4% (541)Unmarried:
45.6% (453)
Ancestries in Little Ferry
836 10.9% Italian253 3.3% Irish203 2.7% Albanian196 2.6% Egyptian186 2.4% Turkish160 2.1% Polish154 2.0% English123 1.6% American108 1.4% German108 1.4% Greek47 0.6% Palestinian43 0.6% Portuguese42 0.5% Jordanian32 0.4% Czech30 0.4% Scotch-Irish29 0.4% French22 0.3% Brazilian13 0.2% French Canadian6 0.08% Russian5 0.07% Austrian4 0.05% Danish1 0.01% Nigerian
Geographical mobility in Little Ferry Same house 1 year ago 4,157 86.9% White (Caucasian)369 89.8% Black or African American4 2.6% American Indian / Alaska Native2,074 89.3% Asian1,614 85.8% Other race1,659 82.6% Two or more races3,344 84.9% White alone, not Hispanic / Latino3,529 83.4% Hispanic or LatinoMoved within same county 432 9.0% White / Caucasian234 100.0% American Indian / Alaska Native88 3.8% Asian306 15.2% Two or more races465 11.8% White alone, not Hispanic / Latino393 9.3% Hispanic or LatinoMoved within same state 93 1.9% White / Caucasian72 17.6% Black or African American7 0.3% Asian20 1.1% Other race34 1.7% Two or more races36 0.9% White alone, not Hispanic / Latino191 4.5% Hispanic or LatinoMoved from different state 69 1.4% White / Caucasian24 1.0% Asian74 3.9% Other race67 1.7% White alone, not Hispanic / Latino85 2.0% Hispanic or LatinoMoved from abroad 43 0.9% White138 5.9% Asian90 4.8% Other race62 1.6% White alone, not Hispanic / Latino86 2.0% Hispanic or Latino
Children Nativity (place of birth) in Little Ferry
Children under 6 years - Living with two parents Both parents native 114 100.0% NativeBoth parents foreign-born 196 93.6% Native13 6.4% Foreign-bornOne native, one foreign-born parent 228 100.0% NativeChildren under 6 years - Living with one parent Native parent 28 100.0% NativeChildren 6 to 17 years - Living with two parents Both parents native 202 98.0% Native4 2.0% Foreign-bornBoth parents foreign-born 524 90.9% Native52 9.1% Foreign-bornOne native, one foreign-born parent 47 100.0% NativeChildren 6 to 17 years - Living with one parent Native parent 61 100.0% NativeForeign-born parent 125 49.5% Native127 50.5% Foreign-born
Grandparents responsible for own grandchildren in Little Ferry
Grandparents (30 to 59 years) Two or more races 11 100.0% Not responsible for grandchildrenHispanic or Latino 3 100.0% Not responsible for grandchildren
Grandparents (60 years and over) Hispanic or Latino 172 100.0% Not responsible for grandchildren