Laurence Harbor, NJ (New Jersey) Houses and Residents
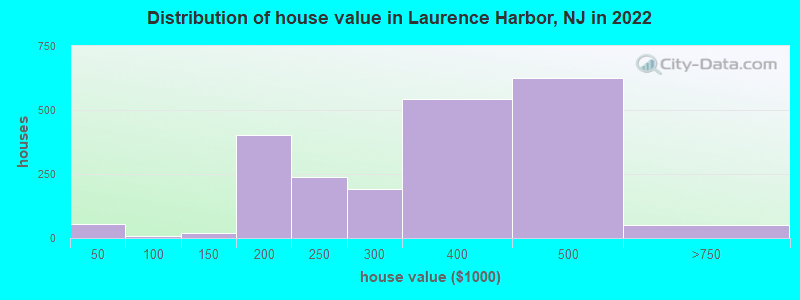
Estimated median house or condo value in 2022: $335,421 (it was $120,200 in 2000 )
Laurence Harbor:
$335,421New Jersey:
$428,900
Lower value quartile - upper value quartile: $230,696 - $444,407Mean price in 2022: Detached houses: $293,016 Here:
$293,016State:
$537,591
Townhouses or other attached units: $406,303 Here:
$406,303State:
$381,113
In 2-unit structures: $350,294 Here:
$350,294State:
$444,476
Total population: 6,536 (Urban population: 6,227, Rural population: 0)
Houses: 2,894 (2,722 occupied: 2,288 owner occupied, 457 renter occupied )
% of renters here:
17%State:
35%
Housing density: 1,027 houses/condos per square mile
Median price asked for vacant for-sale houses and condos in 2022: $997,891.
Median contract rent in 2022: $1,420 (lower quartile is $1,143, upper quartile is $1,693)
Median rent asked for vacant for-rent units in 2022: $1,238
Median gross rent in Laurence Harbor, NJ in 2022: $1,472
Housing units in Laurence Harbor with a mortgage: 1,641 (124 second mortgage, 0 home equity loan, 70 both second mortgage and home equity loan )Houses without a mortgage: 0
Median household income for houses/condos with a mortgage: $99,989
Median household income for apartments without a mortgage: $75,988
Median monthly housing costs: $1,705
Data:
Median house or condo value ($)
Median house or condo value ($ change since 2000)
Median house or condo value ($) - White
Median house or condo value ($) - Black or African American
Median house or condo value ($) - Asian
Median house or condo value ($) - Hispanic or Latino
Median house or condo value ($) - American Indian and Alaska Native
Median house or condo value ($) - Multirace
Median house or condo value ($) - Other Race
Median price asked for mobile homes ($)
Household density (households per square mile)
Mean house or condo value by units in structure - 1, detached ($)
Mean house or condo value by units in structure - 1, attached ($)
Mean house or condo value by units in structure - 2 ($)
Mean house or condo value by units in structure by units in structure - 3 or 4 ($)
Mean house or condo value by units in structure - 5 or more ($)
Mean house or condo value by units in structure - Boat, RV, van, etc. ($)
Mean house or condo value by units in structure - Mobile home ($)
Median contract rent ($)
Median contract rent - Lower quartile ($)
Median contract rent - Upper quartile ($)
Median gross rent ($)
Urban houses (%)
Rural houses (%)
Houses occupied (%)
Houses occupied (% change since 2000)
Houses owner occupied (%)
Houses owner occupied (% change since 2000)
Houses renter occupied (%)
Houses renter occupied (% change since 2000)
Vacant housing units - For rent (%)
Vacant housing units - For rent (% change since 2000)
Vacant housing units - For sale only (%)
Vacant housing units - For sale only (% change since 2000)
Vacant housing units - Rented or sold, not occupied (%)
Vacant housing units - Rented or sold, not occupied (% change since 2000)
Vacant housing units - For seasonal, recreational, or occasional use (%)
Vacant housing units - For seasonal, recreational, or occasional use (% change since 2000)
Vacant housing units - For migrant workers (%)
Vacant housing units - For migrant workers (% change since 2000)
Vacant housing units - Other vacant (%)
Vacant housing units - Other vacant (% change since 2000)
Median monthly housing costs ($)
Median household income for houses/condos with a mortgage ($)
Median household income for houses/condos without a mortgage ($)
Median household income ($)
Median household income ($) - White
Median household income ($) - Black or African American
Median household income ($) - Asian
Median household income ($) - Hispanic or Latino
Median household income ($) - American Indian and Alaska Native
Median household income ($) - Multirace
Median household income ($) - Other Race
Mortgage status - with mortgage (%)
Mortgage status - with second mortgage (%)
Mortgage status - with home equity loan (%)
Mortgage status - with both second mortgage and home equity loan (%)
Mortgage status - without a mortgage (%)
Median year house/condo built
Median year apartment built
Household type by relationship - Male householder living alone (%)
Household type by relationship - Male householder not living alone (%)
Household type by relationship - Female householder living alone (%)
Household type by relationship - Female householder not living alone (%)
Household type by relationship - Opposite-Sex spouse (%)
Household type by relationship - Same-Sex spouse (%)
Household type by relationship - Opposite-Sex unmarried partner (%)
Household type by relationship - Same-Sex unmarried partner (%)
Household type by relationship - In group quarters (%)
Size of family households - 2-person household (%)
Size of family households - 3-person household (%)
Size of family households - 4-person household (%)
Size of family households - 5-person household (%)
Size of family households - 6-person household (%)
Size of family households - 7-or-more-person household (%)
Size of nonfamily households - 1-person household (%)
Size of nonfamily households - 2-person household (%)
Size of nonfamily households - 3-person household (%)
Size of nonfamily households - 4-person household (%)
Size of nonfamily households - 5-person household (%)
Size of nonfamily households - 6-person household (%)
Size of nonfamily households - 7-or-moreperson household (%)
Year house built - Built 2010 or later (%)
Year house built - Built 2000 to 2009 (%)
Year house built - Built 1990 to 1999 (%)
Year house built - Built 1980 to 1989 (%)
Year house built - Built 1970 to 1979 (%)
Year house built - Built 1960 to 1969 (%)
Year house built - Built 1950 to 1959 (%)
Year house built - Built 1940 to 1949 (%)
Year house built - Built 1939 or earlier (%)
Median number of rooms in houses and condos
Median number of rooms in apartments
Median number of bedrooms in owner occupied houses
Mean number of bedrooms in owner occupied houses
Median number of bedrooms in renter occupied houses
Mean number of bedrooms in renter occupied houses
Median number of vehichles in owner occupied houses
Mean number of vehichles in owner occupied houses
Median number of vehichles in renter occupied houses
Mean number of vehichles in renter occupied houses
Rooms in owner-occupied houses - 1 room (%)
Rooms in owner-occupied houses - 2 rooms (%)
Rooms in owner-occupied houses - 3 rooms (%)
Rooms in owner-occupied houses - 4 rooms (%)
Rooms in owner-occupied houses - 5 rooms (%)
Rooms in owner-occupied houses - 6 rooms (%)
Rooms in owner-occupied houses - 7 rooms (%)
Rooms in owner-occupied houses - 8 rooms (%)
Rooms in owner-occupied houses - 9+ rooms (%)
Rooms in renter-occupied houses - 1 room (%)
Rooms in renter-occupied houses - 2 rooms (%)
Rooms in renter-occupied houses - 3 rooms (%)
Rooms in renter-occupied houses - 4 rooms (%)
Rooms in renter-occupied houses - 5 rooms (%)
Rooms in renter-occupied houses - 6 rooms (%)
Rooms in renter-occupied houses - 7 rooms (%)
Rooms in renter-occupied houses - 8 rooms (%)
Rooms in renter-occupied houses - 9+ rooms (%)
Bedrooms in owner-occupied houses - no bedrooms (%)
Bedrooms in owner-occupied houses - 1 bedroom (%)
Bedrooms in owner-occupied houses - 2 bedrooms (%)
Bedrooms in owner-occupied houses - 3 bedrooms (%)
Bedrooms in owner-occupied houses - 4 bedrooms (%)
Bedrooms in owner-occupied houses - 5+ bedrooms (%)
Bedrooms in renter-occupied houses - no bedrooms (%)
Bedrooms in renter-occupied houses - 1 bedroom (%)
Bedrooms in renter-occupied houses - 2 bedrooms (%)
Bedrooms in renter-occupied houses - 3 bedrooms (%)
Bedrooms in renter-occupied houses - 4 bedrooms (%)
Bedrooms in renter-occupied houses - 5+ bedrooms (%)
Vehicles available in owner-occupied houses - no vehicle available (%)
Vehicles available in owner-occupied houses - 1 vehicle available(%)
Vehicles available in owner-occupied houses - 2 Vehicles available (%)
Vehicles available in owner-occupied houses - 3 Vehicles available (%)
Vehicles available in owner-occupied houses - 4 Vehicles available (%)
Vehicles available in owner-occupied houses - 5+ Vehicles available (%)
Vehicles available in renter-occupied houses - no vehicle available (%)
Vehicles available in renter-occupied houses - 1 vehicle available (%)
Vehicles available in renter-occupied houses - 2 Vehicles available (%)
Vehicles available in renter-occupied houses - 3 Vehicles available (%)
Vehicles available in renter-occupied houses - 4 Vehicles available (%)
Vehicles available in renter-occupied houses - 5+ Vehicles available (%)
Housing units in structures - 1, detached (%)
Housing units in structures - 1, attached (%)
Housing units in structures - 2 (%)
Housing units in structures - 3 or 4 (%)
Housing units in structures - 5 to 9 (%)
Housing units in structures - 10 to 19 (%)
Housing units in structures - 20 to 49 (%)
Housing units in structures - 50 or more (%)
Housing units in structures - Mobile home (%)
Housing units in structures - Boat, RV, van, etc. (%)
Housing units in structures - Owners - 1, detached (%)
Housing units in structures - Owners - 1, attached (%)
Housing units in structures - Owners - 2 (%)
Housing units in structures - Owners - 3 or 4 (%)
Housing units in structures - Owners - 5 to 9 (%)
Housing units in structures - Owners - 10 to 19 (%)
Housing units in structures - Owners - 20 to 49 (%)
Housing units in structures - Owners - 50 or more (%)
Housing units in structures - Owners - Mobile home (%)
Housing units in structures - Owners - Boat, RV, van, etc. (%)
Housing units in structures - Renters - 1, detached (%)
Housing units in structures - Renters - 1, attached (%)
Housing units in structures - Renters - 2 (%)
Housing units in structures - Renters - 3 or 4 (%)
Housing units in structures - Renters - 5 to 9 (%)
Housing units in structures - Renters - 10 to 19 (%)
Housing units in structures - Renters - 20 to 49 (%)
Housing units in structures - Renters - 50 or more (%)
Housing units in structures - Renters - Mobile home (%)
Housing units in structures - Renters - Boat, RV, van, etc. (%)
House/condo owner moved in on average (years ago)
Renter moved in on average (years ago)
Year householder moved into unit - Moved in 1999 to March 2000 (%)
Year householder moved into unit - Moved in 1999 to March 2000 (%) - White
Year householder moved into unit - Moved in 1999 to March 2000 (%) - Black or African American
Year householder moved into unit - Moved in 1999 to March 2000 (%) - Asian
Year householder moved into unit - Moved in 1999 to March 2000 (%) - Hispanic or Latino
Year householder moved into unit - Moved in 1999 to March 2000 (%) - American Indian and Alaska Native
Year householder moved into unit - Moved in 1999 to March 2000 (%) - Multirace
Year householder moved into unit - Moved in 1999 to March 2000 (%) - Other Race
Year householder moved into unit - Moved in 1995 to 1998 (%)
Year householder moved into unit - Moved in 1995 to 1998 (%) - White
Year householder moved into unit - Moved in 1995 to 1998 (%) - Black or African American
Year householder moved into unit - Moved in 1995 to 1998 (%) - Asian
Year householder moved into unit - Moved in 1995 to 1998 (%) - Hispanic or Latino
Year householder moved into unit - Moved in 1995 to 1998 (%) - American Indian and Alaska Native
Year householder moved into unit - Moved in 1995 to 1998 (%) - Multirace
Year householder moved into unit - Moved in 1995 to 1998 (%) - Other Race
Year householder moved into unit - Moved in 1990 to 1994 (%)
Year householder moved into unit - Moved in 1990 to 1994 (%) - White
Year householder moved into unit - Moved in 1990 to 1994 (%) - Black or African American
Year householder moved into unit - Moved in 1990 to 1994 (%) - Asian
Year householder moved into unit - Moved in 1990 to 1994 (%) - Hispanic or Latino
Year householder moved into unit - Moved in 1990 to 1994 (%) - American Indian and Alaska Native
Year householder moved into unit - Moved in 1990 to 1994 (%) - Multirace
Year householder moved into unit - Moved in 1990 to 1994 (%) - Other Race
Year householder moved into unit - Moved in 1980 to 1989 (%)
Year householder moved into unit - Moved in 1980 to 1989 (%) - White
Year householder moved into unit - Moved in 1980 to 1989 (%) - Black or African American
Year householder moved into unit - Moved in 1980 to 1989 (%) - Asian
Year householder moved into unit - Moved in 1980 to 1989 (%) - Hispanic or Latino
Year householder moved into unit - Moved in 1980 to 1989 (%) - American Indian and Alaska Native
Year householder moved into unit - Moved in 1980 to 1989 (%) - Multirace
Year householder moved into unit - Moved in 1980 to 1989 (%) - Other Race
Year householder moved into unit - Moved in 1970 to 1979 (%)
Year householder moved into unit - Moved in 1970 to 1979 (%) - White
Year householder moved into unit - Moved in 1970 to 1979 (%) - Black or African American
Year householder moved into unit - Moved in 1970 to 1979 (%) - Asian
Year householder moved into unit - Moved in 1970 to 1979 (%) - Hispanic or Latino
Year householder moved into unit - Moved in 1970 to 1979 (%) - American Indian and Alaska Native
Year householder moved into unit - Moved in 1970 to 1979 (%) - Multirace
Year householder moved into unit - Moved in 1970 to 1979 (%) - Other Race
Year householder moved into unit - Moved in 1969 or earlier (%)
Year householder moved into unit - Moved in 1969 or earlier (%) - White
Year householder moved into unit - Moved in 1969 or earlier (%) - Black or African American
Year householder moved into unit - Moved in 1969 or earlier (%) - Asian
Year householder moved into unit - Moved in 1969 or earlier (%) - Hispanic or Latino
Year householder moved into unit - Moved in 1969 or earlier (%) - American Indian and Alaska Native
Year householder moved into unit - Moved in 1969 or earlier (%) - Multirace
Year householder moved into unit - Moved in 1969 or earlier (%) - Other Race
Housing units lacking complete plumbing facilities (%)
Housing units lacking complete kitchen facilities (%)
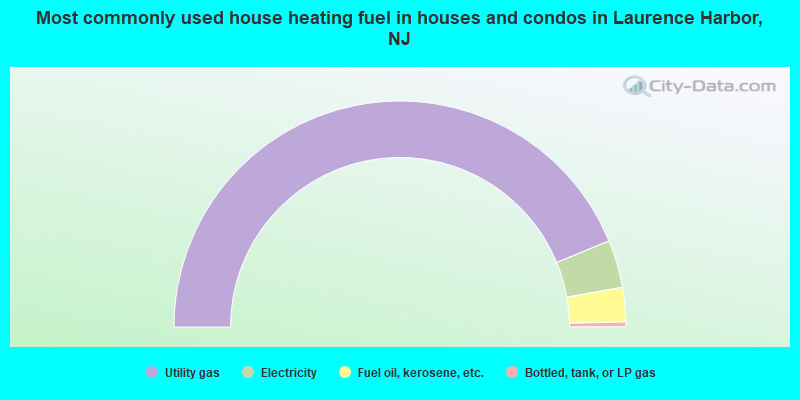
House heating fuel used in houses and condos - Utility gas (%)
House heating fuel used in houses and condos - Bottled, tank, or LP gas (%)
House heating fuel used in houses and condos - Electricity (%)
House heating fuel used in houses and condos - Fuel oil, kerosene, etc. (%)
House heating fuel used in houses and condos - Coal or coke (%)
House heating fuel used in houses and condos - Wood (%)
House heating fuel used in houses and condos - Solar energy (%)
House heating fuel used in houses and condos - Other fuel (%)
House heating fuel used in houses and condos - No fuel used (%)
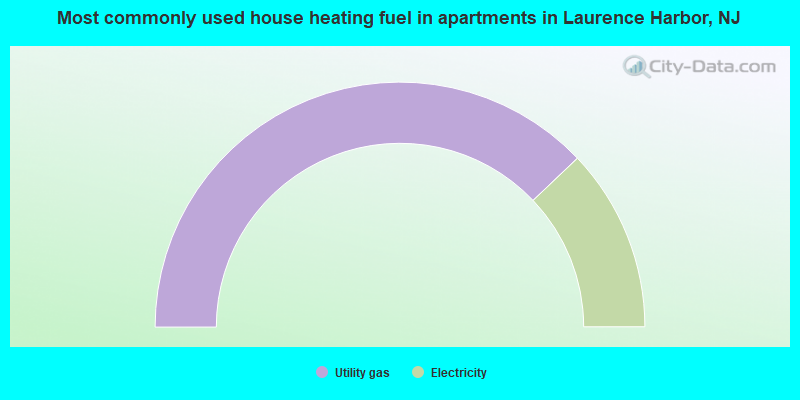
House heating fuel used in apartments - Utility gas (%)
House heating fuel used in apartments - Bottled, tank, or LP gas (%)
House heating fuel used in apartments - Electricity (%)
House heating fuel used in apartments - Fuel oil, kerosene, etc. (%)
House heating fuel used in apartments - Coal or coke (%)
House heating fuel used in apartments - Wood (%)
House heating fuel used in apartments - Solar energy (%)
House heating fuel used in apartments - Other fuel (%)
House heating fuel used in apartments - No fuel used (%)
Median year house/condo built: 1963Median year apartment built: 1975Household type by relationship:
Households: 6,427
Male householders: 1,319 (330 living alone ), Female householders: 1,385 (351 living alone )1,173 spouses (1,150 opposite-sex spouses ), 215 unmarried partners , (215 opposite-sex unmarried partners ), 1,492 children (1,442 natural , 0 adopted , 50 stepchildren ), 333 grandchildren , 155 brothers or sisters , 74 parents , 0 foster children , 96 other relatives , 177 non-relatives In group quarters: 5
Size of family households: 706 2-persons , 547 3-persons , 371 4-persons , 42 5-persons , 65 7-or-more-persons .
Size of nonfamily households: 693 1-person , 365 2-persons .
661 married couples with children. single-parent households (31 men , 137 women ).
82.7% of residents of Laurence Harbor speak English at home. of residents speak Spanish at home (94% speak English very well , 6% speak English not well ).of residents speak other Indo-European language at home (80% speak English very well , 7% speak English well , 9% speak English not well , 4% don't speak English at all ).of residents speak Asian or Pacific Island language at home (30% speak English very well , 62% speak English well , 8% speak English not well ).
Foreign born population: 1,072 (16.7%)of them are naturalized citizens )
Median number of rooms in houses and condos:
Median number of rooms in apartments
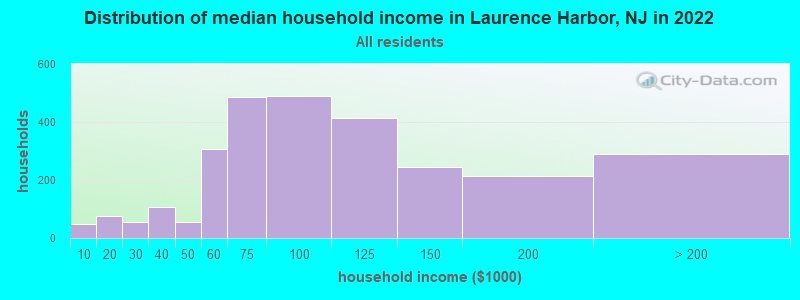
Laurence Harbor, NJ household income distribution 48 Less than $10,00077 $10,000 to $19,99956 $20,000 to $29,999108 $30,000 to $39,99956 $40,000 to $49,999306 $50,000 to $59,999485 $60,000 to $74,999489 $75,000 to $99,999415 $100,000 to $124,999245 $125,000 to $149,999215 $150,000 to $199,999288 $200,000 or more
Home value of owner - occupied houses in 2022 in Laurence Harbor, NJ 31 Less than $10,00022 $15,000 to $19,9996 $90,000 to $99,99911 $100,000 to $124,9996 $125,000 to $149,999336 $150,000 to $174,99966 $175,000 to $199,999240 $200,000 to $249,999192 $250,000 to $299,999543 $300,000 to $399,999623 $400,000 to $499,99949 $500,000 to $749,999Rent paid by renters in 2022 in Laurence Harbor, NJ 22 $500 to $54947 $900 to $99986 $1,000 to $1,249112 $1,250 to $1,499184 $1,500 to $1,99912 $2,500 to $2,999
Percentage of workers working in this county: 42.0%Number of people working at home: 432 (13.8% of all workers )
Travel time to work (commute)
Less than 5 minutes: 485 to 9 minutes: 5110 to 14 minutes: 23815 to 19 minutes: 24020 to 24 minutes: 47125 to 29 minutes: 17530 to 34 minutes: 34935 to 39 minutes: 3940 to 44 minutes: 17945 to 59 minutes: 23560 to 89 minutes: 35990 or more minutes: 200
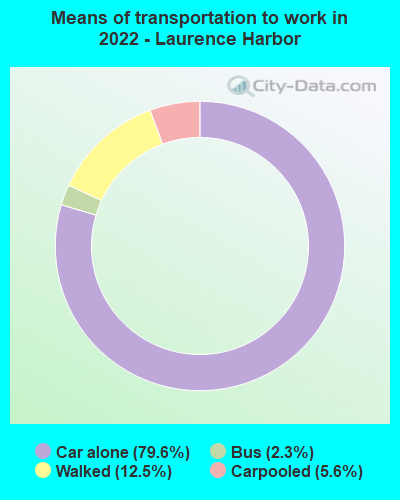
Means of transportation to work:
Drove a car alone: 573 (61.0%)Carpooled: 38 (4.0%)Bus or trolley bus : 12 (1.3%)Walked: 93 (9.9%)Worked at home: 446 (47.5%)
Unemployment by race in 2022
Unemployment rate for White non-Hispanic residents 12.1% MalesUnemployment rate for Black residents 23.7% MalesUnemployment rate for Asian residents 5.7% MalesUnemployment rate for other race residents 22.6% FemalesUnemployment rate for two or more race residents 3.7% FemalesUnemployment rate for Hispanic or Latino residents 8.9% Females
Year of entry for the foreign-born population in Laurence Harbor, New Jersey
198 2010 or later 378 2000 to 2009 226 1990 to 1999 145 1980 to 1989 63 1970 to 1979 134 Before 1970
First ancestries reported:
Italian: 468 (15.9%)
Irish: 266 (9.0%)
Trinidadian and Tobagonian: 142 (4.8%)
German: 107 (3.6%)
Polish: 106 (3.6%)
Romanian: 55 (1.9%)
Scottish: 52 (1.8%)
Albanian: 44 (1.5%)
American: 24 (0.8%)
Ukrainian: 23 (0.8%)
Slavic: 12 (0.4%)
Eastern European: 9 (0.3%)
French Canadian: 8 (0.3%)
Portuguese: 7 (0.2%)
Egyptian: 1 (0.03%) Most common places of birth for foreign-born residents (%): Philippines Laurence Harbor:
39.4% (411)New Jersey:
4.0% (85,934)
Trinidad and Tobago Laurence Harbor:
9.9% (103)New Jersey:
0.7% (15,533)
India Laurence Harbor:
8.4% (88)New Jersey:
12.8% (274,609)
Peru Laurence Harbor:
8.2% (86)New Jersey:
2.7% (58,563)
Brazil Laurence Harbor:
4.7% (49)New Jersey:
2.1% (46,020)
Ukraine Laurence Harbor:
4.4% (46)New Jersey:
1.1% (22,760)
Albania Laurence Harbor:
4.2% (44)New Jersey:
0.3% (6,130)
Dominican Republic Laurence Harbor:
4.0% (42)New Jersey:
9.7% (209,055)
China, excluding Hong Kong and Taiwan Laurence Harbor:
3.7% (39)New Jersey:
3.7% (78,969)
Romania Laurence Harbor:
3.4% (36)New Jersey:
0.3% (6,033)
Korea Laurence Harbor:
2.4% (25)New Jersey:
3.3% (70,512)
Canada Laurence Harbor:
2.4% (25)New Jersey:
0.9% (18,317)
Sri Lanka Laurence Harbor:
1.9% (20)New Jersey:
0.2% (3,488)
Guatemala Laurence Harbor:
1.6% (17)New Jersey:
2.2% (46,813)
Place of birth for U.S.-born residents:
This state: 4,103Other state: 926Northeast: 756Midwest: 0South: 61West: 115 94.4% of Laurence Harbor residents lived in the same house 1 years ago.
Out of people who lived in different houses, 24.1% lived in this county.
Out of people who lived in different counties, 97.0% lived in New Jersey.
Laurence Harbor:
94.4%State average:
90.4%
Education attainment for males 25 years and older:
No schooling: 18Nursery to 4th grade: 175th and 6th grade: 07th and 8th grade: 09th grade: 4810th grade: 011th grade: 2012th grade, no diploma: 84High school graduate (or equivalency): 833Less than 1 year of college: 202Some college more than 1 year, no degree: 221Associate degree: 318Bachelor's degree: 487Master's degree: 171Professional school degree: 24Doctorate degree: 0
Education attainment for females 25 years and older:
No schooling: 148Nursery to 4th grade: 155th and 6th grade: 57th and 8th grade: 99th grade: 010th grade: 1511th grade: 1512th grade, no diploma: 73High school graduate (or equivalency): 542Less than 1 year of college: 320Some college more than 1 year, no degree: 308Associate degree: 207Bachelor's degree: 486Master's degree: 389Professional school degree: 77Doctorate degree: 28
Housing units in structures:
One, detached: 2,106One, attached: 312Two: 1553 or 4: 305 to 9: 18410 to 19: 5220 to 49: 2150 or more: 31House/condo owner moved in on average 14 years ago
Renter moved in on average 6 years ago
Private vs. public school enrollment:
Students in private schools in grades 1 to 8 (elementary and middle school): 29 Here:
11.4%New Jersey:
12.3%
Students in private schools in grades 9 to 12 (high school): 120 Here:
41.7%New Jersey:
13.1%
Students in private undergraduate colleges: 111 Here:
43.9%New Jersey:
33.2%