Races in Laurence Harbor, New Jersey (NJ) Detailed Stats
Data:
Races - White alone (%)
Races - White alone (% change since 2000)
Races - Black alone (%)
Races - Black alone (% change since 2000)
Races - American Indian alone (%)
Races - American Indian alone (% change since 2000)
Races - Asian alone (%)
Races - Asian alone (% change since 2000)
Races - Hispanic (%)
Races - Hispanic (% change since 2000)
Races - Native Hawaiian and Other Pacific Islander alone (%)
Races - Native Hawaiian and Other Pacific Islander alone (% change since 2000)
Races - Two or more races(%)
Races - Two or more races(% change since 2000)
Races - Other race alone (%)
Races - Other race alone (% change since 2000)
Racial diversity
Place of birth - Born in state of residence (%)
Place of birth - Born in state of residence (%) - White
Place of birth - Born in state of residence (%) - Black or African American
Place of birth - Born in state of residence (%) - Asian
Place of birth - Born in state of residence (%) - Hispanic or Latino
Place of birth - Born in state of residence (%) - American Indian and Alaska Native
Place of birth - Born in state of residence (%) - Multirace
Place of birth - Born in state of residence (%) - Other Race
Place of birth - Born in other state (%)
Place of birth - Born in other state (%) - White
Place of birth - Born in other state (%) - Black or African American
Place of birth - Born in other state (%) - Asian
Place of birth - Born in other state (%) - Hispanic or Latino
Place of birth - Born in other state (%) - American Indian and Alaska Native
Place of birth - Born in other state (%) - Multirace
Place of birth - Born in other state (%) - Other Race
Place of birth - Native, outside of US (%)
Place of birth - Native, outside of US (%) - White
Place of birth - Native, outside of US (%) - Black or African American
Place of birth - Native, outside of US (%) - Asian
Place of birth - Native, outside of US (%) - Hispanic or Latino
Place of birth - Native, outside of US (%) - American Indian and Alaska Native
Place of birth - Native, outside of US (%) - Multirace
Place of birth - Native, outside of US (%) - Other Race
Place of birth - Foreign born (%)
Place of birth - Foreign born (%) - White
Place of birth - Foreign born (%) - Black or African American
Place of birth - Foreign born (%) - Asian
Place of birth - Foreign born (%) - Hispanic or Latino
Place of birth - Foreign born (%) - American Indian and Alaska Native
Place of birth - Foreign born (%) - Multirace
Place of birth - Foreign born (%) - Other Race
Residents speaking English at home (%)
Residents speaking English at home - Born in the United States (%)
Residents speaking English at home - Native, born elsewhere (%)
Residents speaking English at home - Foreign born (%)
Residents speaking Spanish at home (%)
Residents speaking Spanish at home - Born in the United States (%)
Residents speaking Spanish at home - Native, born elsewhere (%)
Residents speaking Spanish at home - Foreign born (%)
Residents speaking other language at home (%)
Residents speaking other language at home - Born in the United States (%)
Residents speaking other language at home - Native, born elsewhere (%)
Residents speaking other language at home - Foreign born (%)
Marital status - Never married (%)
Marital status - Now married (%)
Marital status - Separated (%)
Marital status - Widowed (%)
Marital status - Divorced (%)
Ancestries Reported - Arab (%)
Ancestries Reported - Czech (%)
Ancestries Reported - Danish (%)
Ancestries Reported - Dutch (%)
Ancestries Reported - English (%)
Ancestries Reported - French (%)
Ancestries Reported - French Canadian (%)
Ancestries Reported - German (%)
Ancestries Reported - Greek (%)
Ancestries Reported - Hungarian (%)
Ancestries Reported - Irish (%)
Ancestries Reported - Italian (%)
Ancestries Reported - Lithuanian (%)
Ancestries Reported - Norwegian (%)
Ancestries Reported - Polish (%)
Ancestries Reported - Portuguese (%)
Ancestries Reported - Russian (%)
Ancestries Reported - Scotch-Irish (%)
Ancestries Reported - Scottish (%)
Ancestries Reported - Slovak (%)
Ancestries Reported - Subsaharan African (%)
Ancestries Reported - Swedish (%)
Ancestries Reported - Swiss (%)
Ancestries Reported - Ukrainian (%)
Ancestries Reported - United States (%)
Ancestries Reported - Welsh (%)
Ancestries Reported - West Indian (%)
Ancestries Reported - Other (%)
Geographical mobility - Same house 1 year ago (%)
Geographical mobility - Same house 1 year ago (%) - White
Geographical mobility - Same house 1 year ago (%) - Black or African American
Geographical mobility - Same house 1 year ago (%) - Asian
Geographical mobility - Same house 1 year ago (%) - Hispanic or Latino
Geographical mobility - Same house 1 year ago (%) - American Indian and Alaska Native
Geographical mobility - Same house 1 year ago (%) - Multirace
Geographical mobility - Same house 1 year ago (%) - Other Race
Geographical mobility - Moved within same county (%)
Geographical mobility - Moved within same county (%) - White
Geographical mobility - Moved within same county (%) - Black or African American
Geographical mobility - Moved within same county (%) - Asian
Geographical mobility - Moved within same county (%) - Hispanic or Latino
Geographical mobility - Moved within same county (%) - American Indian and Alaska Native
Geographical mobility - Moved within same county (%) - Multirace
Geographical mobility - Moved within same county (%) - Other Race
Geographical mobility - Moved from different county within same state (%)
Geographical mobility - Moved from different county within same state (%) - White
Geographical mobility - Moved from different county within same state (%) - Black or African American
Geographical mobility - Moved from different county within same state (%) - Asian
Geographical mobility - Moved from different county within same state (%) - Hispanic or Latino
Geographical mobility - Moved from different county within same state (%) - American Indian and Alaska Native
Geographical mobility - Moved from different county within same state (%) - Multirace
Geographical mobility - Moved from different county within same state (%) - Other Race
Geographical mobility - Moved from different state (%)
Geographical mobility - Moved from different state (%) - White
Geographical mobility - Moved from different state (%) - Black or African American
Geographical mobility - Moved from different state (%) - Asian
Geographical mobility - Moved from different state (%) - Hispanic or Latino
Geographical mobility - Moved from different state (%) - American Indian and Alaska Native
Geographical mobility - Moved from different state (%) - Multirace
Geographical mobility - Moved from different state (%) - Other Race
Geographical mobility - Moved from abroad (%)
Geographical mobility - Moved from abroad (%) - White
Geographical mobility - Moved from abroad (%) - Black or African American
Geographical mobility - Moved from abroad (%) - Asian
Geographical mobility - Moved from abroad (%) - Hispanic or Latino
Geographical mobility - Moved from abroad (%) - American Indian and Alaska Native
Geographical mobility - Moved from abroad (%) - Multirace
Geographical mobility - Moved from abroad (%) - Other Race
Place of birth for the foreign-born population - Ireland (%)
Place of birth for the foreign-born population - Denmark (%)
Place of birth for the foreign-born population - Norway (%)
Place of birth for the foreign-born population - Sweden (%)
Place of birth for the foreign-born population - United Kingdom (%)
Place of birth for the foreign-born population - England (%)
Place of birth for the foreign-born population - Scotland (%)
Place of birth for the foreign-born population - Other Northern Europe (%)
Place of birth for the foreign-born population - Austria (%)
Place of birth for the foreign-born population - Belgium (%)
Place of birth for the foreign-born population - France (%)
Place of birth for the foreign-born population - Germany (%)
Place of birth for the foreign-born population - Netherlands (%)
Place of birth for the foreign-born population - Switzerland (%)
Place of birth for the foreign-born population - Other Western Europe (%)
Place of birth for the foreign-born population - Greece (%)
Place of birth for the foreign-born population - Italy (%)
Place of birth for the foreign-born population - Portugal (%)
Place of birth for the foreign-born population - Spain (%)
Place of birth for the foreign-born population - Other Southern Europe (%)
Place of birth for the foreign-born population - Albania (%)
Place of birth for the foreign-born population - Belarus (%)
Place of birth for the foreign-born population - Bosnia and Herzegovina (%)
Place of birth for the foreign-born population - Bulgaria (%)
Place of birth for the foreign-born population - Croatia (%)
Place of birth for the foreign-born population - Czechoslovakia (%)
Place of birth for the foreign-born population - Hungary (%)
Place of birth for the foreign-born population - Latvia (%)
Place of birth for the foreign-born population - Lithuania (%)
Place of birth for the foreign-born population - North Macedonia (Macedonia) (%)
Place of birth for the foreign-born population - Moldova (%)
Place of birth for the foreign-born population - Poland (%)
Place of birth for the foreign-born population - Romania (%)
Place of birth for the foreign-born population - Russia (%)
Place of birth for the foreign-born population - Serbia (%)
Place of birth for the foreign-born population - Ukraine (%)
Place of birth for the foreign-born population - Other Eastern Europe (%)
Place of birth for the foreign-born population - China (%)
Place of birth for the foreign-born population - Hong Kong (%)
Place of birth for the foreign-born population - Taiwan (%)
Place of birth for the foreign-born population - Japan (%)
Place of birth for the foreign-born population - Korea (%)
Place of birth for the foreign-born population - Other Eastern Asia (%)
Place of birth for the foreign-born population - Afghanistan (%)
Place of birth for the foreign-born population - Bangladesh (%)
Place of birth for the foreign-born population - India (%)
Place of birth for the foreign-born population - Iran (%)
Place of birth for the foreign-born population - Kazakhstan (%)
Place of birth for the foreign-born population - Nepal (%)
Place of birth for the foreign-born population - Pakistan (%)
Place of birth for the foreign-born population - Sri Lanka (%)
Place of birth for the foreign-born population - Uzbekistan (%)
Place of birth for the foreign-born population - Other South Central Asia (%)
Place of birth for the foreign-born population - Burma (%)
Place of birth for the foreign-born population - Cambodia (%)
Place of birth for the foreign-born population - Indonesia (%)
Place of birth for the foreign-born population - Laos (%)
Place of birth for the foreign-born population - Malaysia (%)
Place of birth for the foreign-born population - Philippines (%)
Place of birth for the foreign-born population - Singapore (%)
Place of birth for the foreign-born population - Thailand (%)
Place of birth for the foreign-born population - Vietnam (%)
Place of birth for the foreign-born population - Other South Eastern Asia (%)
Place of birth for the foreign-born population - Armenia (%)
Place of birth for the foreign-born population - Iraq (%)
Place of birth for the foreign-born population - Israel (%)
Place of birth for the foreign-born population - Jordan (%)
Place of birth for the foreign-born population - Kuwait (%)
Place of birth for the foreign-born population - Lebanon (%)
Place of birth for the foreign-born population - Saudi Arabia (%)
Place of birth for the foreign-born population - Syria (%)
Place of birth for the foreign-born population - Turkey (%)
Place of birth for the foreign-born population - Yemen (%)
Place of birth for the foreign-born population - Other Western Asia (%)
Place of birth for the foreign-born population - Eritrea (%)
Place of birth for the foreign-born population - Ethiopia (%)
Place of birth for the foreign-born population - Kenya (%)
Place of birth for the foreign-born population - Somalia (%)
Place of birth for the foreign-born population - Uganda (%)
Place of birth for the foreign-born population - Zimbabwe (%)
Place of birth for the foreign-born population - Other Eastern Africa (%)
Place of birth for the foreign-born population - Cameroon (%)
Place of birth for the foreign-born population - Congo (%)
Place of birth for the foreign-born population - Democratic Republic of Congo (Zaire) (%)
Place of birth for the foreign-born population - Other Middle Africa (%)
Place of birth for the foreign-born population - Egypt (%)
Place of birth for the foreign-born population - Morocco (%)
Place of birth for the foreign-born population - Sudan (%)
Place of birth for the foreign-born population - Other Northern Africa (%)
Place of birth for the foreign-born population - South Africa (%)
Place of birth for the foreign-born population - Other Southern Africa (%)
Place of birth for the foreign-born population - Cabo Verde (%)
Place of birth for the foreign-born population - Ghana (%)
Place of birth for the foreign-born population - Liberia (%)
Place of birth for the foreign-born population - Nigeria (%)
Place of birth for the foreign-born population - Senegal (%)
Place of birth for the foreign-born population - Sierra Leone (%)
Place of birth for the foreign-born population - Other Western Africa (%)
Place of birth for the foreign-born population - Australia (%)
Place of birth for the foreign-born population - New Zealand (%)
Place of birth for the foreign-born population - Fiji (%)
Place of birth for the foreign-born population - Micronesia (%)
Place of birth for the foreign-born population - Bahamas (%)
Place of birth for the foreign-born population - Barbados (%)
Place of birth for the foreign-born population - Cuba (%)
Place of birth for the foreign-born population - Dominica (%)
Place of birth for the foreign-born population - Dominican Republic (%)
Place of birth for the foreign-born population - Grenada (%)
Place of birth for the foreign-born population - Haiti (%)
Place of birth for the foreign-born population - Jamaica (%)
Place of birth for the foreign-born population - St. Vincent and the Grenadines (%)
Place of birth for the foreign-born population - Trinidad and Tobago (%)
Place of birth for the foreign-born population - West Indies (%)
Place of birth for the foreign-born population - Other Caribbean (%)
Place of birth for the foreign-born population - Belize (%)
Place of birth for the foreign-born population - Costa Rica (%)
Place of birth for the foreign-born population - El Salvador (%)
Place of birth for the foreign-born population - Guatemala (%)
Place of birth for the foreign-born population - Honduras (%)
Place of birth for the foreign-born population - Mexico (%)
Place of birth for the foreign-born population - Nicaragua (%)
Place of birth for the foreign-born population - Panama (%)
Place of birth for the foreign-born population - Other Central America (%)
Place of birth for the foreign-born population - Argentina (%)
Place of birth for the foreign-born population - Bolivia (%)
Place of birth for the foreign-born population - Brazil (%)
Place of birth for the foreign-born population - Chile (%)
Place of birth for the foreign-born population - Colombia (%)
Place of birth for the foreign-born population - Ecuador (%)
Place of birth for the foreign-born population - Guyana (%)
Place of birth for the foreign-born population - Peru (%)
Place of birth for the foreign-born population - Uruguay (%)
Place of birth for the foreign-born population - Venezuela (%)
Place of birth for the foreign-born population - Other South America (%)
Place of birth for the foreign-born population - Canada (%)
Place of birth for the foreign-born population - Other Northern America (%)
Place of birth for the foreign-born population - Other (%)
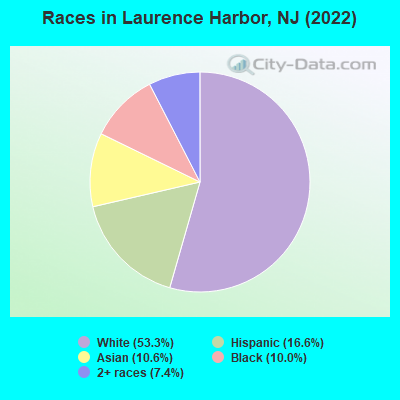
According to 2022 data, the most numerous races in Laurence Harbor, NJ are White alone (3,427 residents), Hispanic (1,070 residents), and Black alone (641 residents). 82.9% of Laurence Harbor residents speak English at home. 16.2% of Laurence Harbor, NJ residents are foreign-born (9.2% born in Asia, 4.2% born in Latin America, 2.0% born in Europe), which is 41.6% less than the foreign-born rate of 23.0% across the entire state of New Jersey.
Race distribution in Laurence Harbor
2000 2022
5,557,209 66.0% White alone 1,117,191 13.3% Hispanic 1,096,171 13.0% Black alone 477,012 5.7% Asian alone 133,689 1.6% Two or more races 19,565 0.2% Other race alone 11,338 0.1% American Indian alone 2,175 0.03% Native Hawaiian and Other
4,766,476 51.5% White alone 2,028,470 21.9% Hispanic 1,111,632 12.0% Black alone 923,546 10.0% Asian alone 332,237 3.6% Two or more races 89,847 1.0% Other race alone 8,557 0.09% American Indian alone 934 0.01% Native Hawaiian and Other
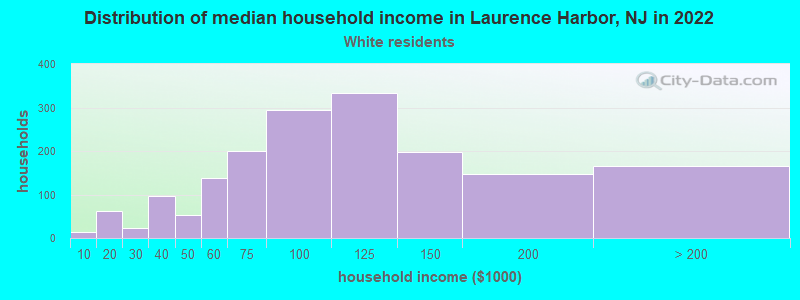
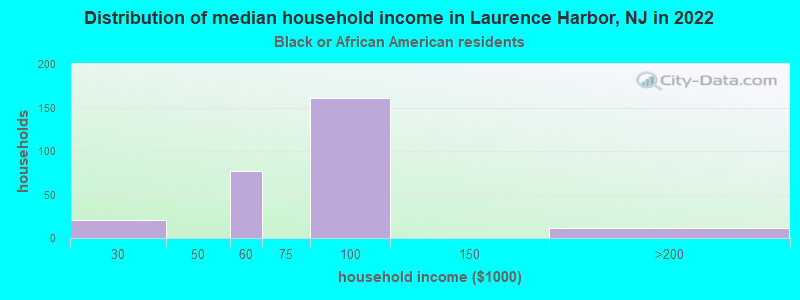
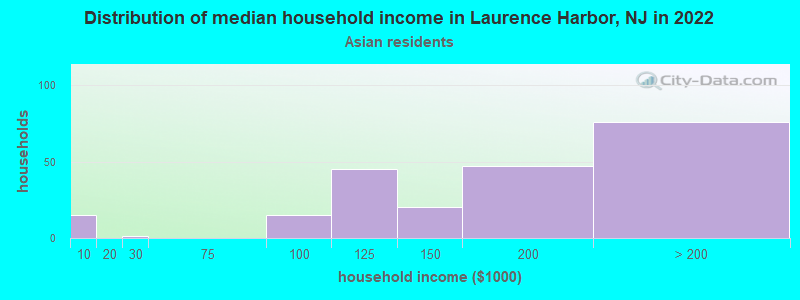
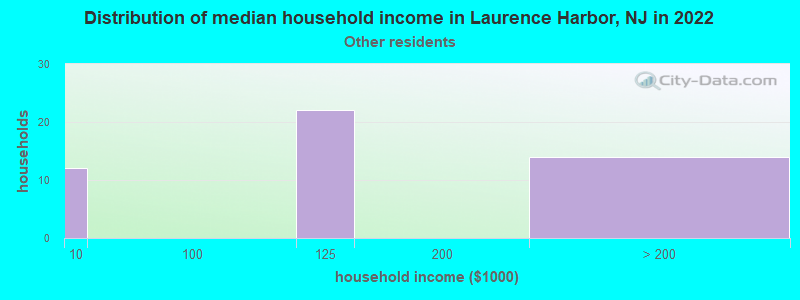
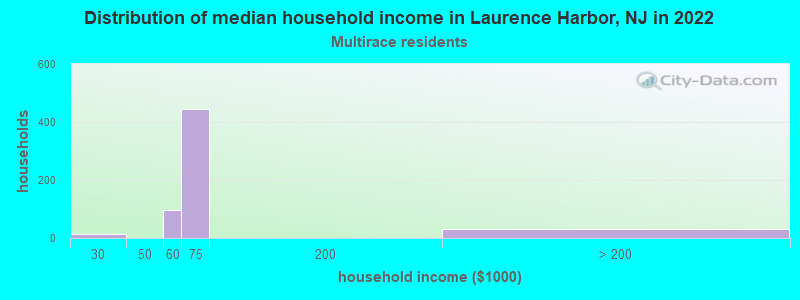
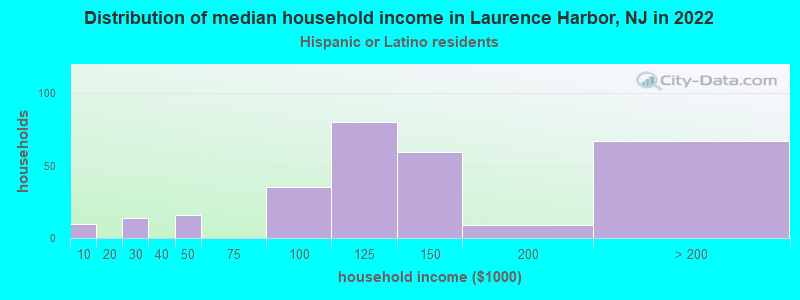
Income and house value in Laurence Harbor Median household income in 2022 $92,253 White non-Hispanic householders$91,153 Black householders$182,044 Asian householders$66,188 Two or more races householders$124,370 Hispanic or Latino race householdersMedian 2022 house value $330,398 White Non-Hispanic householders$483,319 Black or African American householders $539,687 Asian householders$404,626 Some other race householders$453,460 Two or more races householders$332,072 Hispanic or Latino householders
Median age by race in Laurence Harbor
51.3 Median age for White residents52.5 48.3 46.4 Median age for Black or African American residents47.2 46.5 -673,036,092.7 Median age for American Indian / Alaska Native residents-624,624,624.0 -739,999,999.3 38.9 Median age for Asian residents39.6 36.9 -939,393,938.5 Median age for Native Hawaiian / Pacific Islander residents-860,335,194.7 -713,070,378.3 31.5 Median age for Other race residents28.8 31.6 37.7 Median age for Two or more races residents6.4 49.8 53.0 Median age for White alone residents52.9 55.4 30.5 Median age for Hispanic or Latino residents28.8 31.3
Owner/renter occupied households by race in Laurence Harbor
House owners and renters - White residents 1,522 86.5% Owner occupied238 13.5% Renter occupiedHouse owners and renters - Black or African American residents 95 38.0% Owner occupied154 62.0% Renter occupiedHouse owners and renters - Asian residents 210 92.0% Owner occupied18 8.0% Renter occupiedHouse owners and renters - Other race residents 63 100.0% Owner occupiedHouse owners and renters - Two or more races residents 468 100.0% Owner occupiedHouse owners and renters - White alone residents 1,369 83.7% Owner occupied267 16.3% Renter occupiedHouse owners and renters - Hispanic or Latino residents 324 93.6% Owner occupied22 6.4% Renter occupied
Language usage in Laurence Harbor
English speakers - Total 82.9% of residents of Laurence Harbor speak English at home.
4.1% of residents speak Spanish at home 234 93.6% Speak English very well16 6.4% Speak English less than very well12.7% of residents speak other language at home 386 50.1% Speak English very well384 49.9% Speak English less than very well
English speakers - Born in the United States 90.1% of residents of Laurence Harbor speak English at home.
5.0% of residents speak Spanish at home 46 100.0% Speak English very well5.6% of residents speak other language at home 52 100.0% Speak English very well
All residents speak only English at home
English speakers - Foreign-born 28.9% of residents of Laurence Harbor speak English at home.
5.2% of residents speak Spanish at home 54 100.0% Speak English very well65.7% of residents speak other language at home 290 42.6% Speak English very well390 57.4% Speak English less than very well
White (Caucasian) - Speak only English Native:
99.1% (3,408)Foreign-born:
62.1% (134)
White (Caucasian) - Speak another language Native:
4.1% (140)Foreign-born:
52.0% (112)
Asian - Speak only English Native:
90.2% (165)Foreign-born:
35.2% (145)
Asian - Speak another language Native:
8.1% (15)Foreign-born:
67.3% (278)
Other race - Speak another language Native:
21.6% (49)Foreign-born:
97.4% (17)
White alone - Speak only English Native:
99.7% (3,133)Foreign-born:
19.4% (33)
White alone - Speak another language Native:
1.8% (55)Foreign-born:
80.3% (136)
Hispanic or Latino - Speak only English Native:
76.1% (560)Foreign-born:
100.0% (167)
Hispanic or Latino - Speak another language Native:
28.1% (207)Foreign-born:
28.7% (48)
Foreign-born residents in Laurence Harbor 1,044 residents are foreign born (9.2% Asia , 4.2% Latin America , 2.0% Europe ).
This city:
16.2%New Jersey:
23.2%
Marital status for residents in Laurence Harbor Marital status - White (Caucasian) population 15 years and over
Males 23.9% Never married47.7% Now married0.0% Separated2.0% Widowed26.3% DivorcedFemales 23.3% Never married46.4% Now married0.0% Separated12.1% Widowed18.2% DivorcedWomen who gave birth in the past 12 months Now married:
50.0% (20)Unmarried:
50.0% (20)
Women who did not give birth in the past 12 months Now married:
48.9% (300)Unmarried:
51.1% (314)
Marital status - Black or African American population 15 years and over
Males 72.5% Never married27.5% Now married0.0% Separated0.0% Widowed0.0% DivorcedFemales 46.3% Never married34.3% Now married0.0% Separated0.0% Widowed19.4% DivorcedWomen who did not give birth in the past 12 months Now married:
0.0% (0)Unmarried:
100.0% (168)
Marital status - Asian population 15 years and over
Males 34.7% Never married61.0% Now married0.0% Separated0.0% Widowed4.2% DivorcedFemales 36.3% Never married55.3% Now married0.0% Separated3.7% Widowed4.7% DivorcedWomen who gave birth in the past 12 months Now married:
100.0% (20)Unmarried:
0.0% (0)
Women who did not give birth in the past 12 months Now married:
39.5% (72)Unmarried:
60.5% (109)
Marital status - Other race population 15 years and over
Males 70.3% Never married29.7% Now married0.0% Separated0.0% Widowed0.0% DivorcedFemales 17.9% Never married74.1% Now married0.0% Separated0.0% Widowed8.0% DivorcedWomen who did not give birth in the past 12 months Now married:
71.3% (101)Unmarried:
28.7% (41)
Marital status - Two or more races population 15 years and over
Males 0.0% Never married92.9% Now married0.0% Separated7.1% Widowed0.0% DivorcedFemales 4.2% Never married25.8% Now married0.0% Separated70.0% Widowed0.0% DivorcedWomen who gave birth in the past 12 months Now married:
100.0% (83)Unmarried:
0.0% (0)
Women who did not give birth in the past 12 months Now married:
8.9% (30)Unmarried:
91.1% (309)
Marital status - White alone, not Hispanic / Latino population 15 years and over
Males 20.0% Never married47.5% Now married0.0% Separated1.4% Widowed31.1% DivorcedFemales 26.7% Never married41.2% Now married0.0% Separated14.1% Widowed18.1% DivorcedWomen who gave birth in the past 12 months Now married:
50.0% (24)Unmarried:
50.0% (24)
Women who did not give birth in the past 12 months Now married:
36.1% (197)Unmarried:
63.9% (349)
Marital status - Hispanic or Latino population 15 years and over
Males 50.5% Never married45.1% Now married0.0% Separated4.3% Widowed0.0% DivorcedFemales 7.5% Never married73.9% Now married0.0% Separated3.4% Widowed15.2% DivorcedWomen who did not give birth in the past 12 months Now married:
82.2% (246)Unmarried:
17.8% (53)
Ancestries in Laurence Harbor
468 15.9% Italian266 9.0% Irish142 4.8% Trinidadian and Tobagonian107 3.6% German106 3.6% Polish55 1.9% Romanian52 1.8% Scottish44 1.5% Albanian24 0.8% American23 0.8% Ukrainian12 0.4% Slavic9 0.3% Eastern European8 0.3% French Canadian7 0.2% Portuguese1 0.03% Egyptian
Children Nativity (place of birth) in Laurence Harbor
Children under 6 years - Living with two parents Both parents native 355 100.0% NativeBoth parents foreign-born 53 70.2% Native23 29.8% Foreign-bornOne native, one foreign-born parent 24 100.0% NativeChildren under 6 years - Living with one parent Native parent 123 100.0% NativeForeign-born parent 8 27.7% Native20 72.3% Foreign-bornChildren 6 to 17 years - Living with two parents Both parents native 311 100.0% NativeBoth parents foreign-born 45 80.3% Native11 19.7% Foreign-bornOne native, one foreign-born parent 28 100.0% NativeChildren 6 to 17 years - Living with one parent Native parent 138 100.0% Native
Grandparents responsible for own grandchildren in Laurence Harbor
Grandparents (30 to 59 years) White / Caucasian 25 100.0% Not responsible for grandchildrenAsian 18 100.0% Not responsible for grandchildrenWhite alone, not Hispanic / Latino 29 100.0% Not responsible for grandchildren
Grandparents (60 years and over) White / Caucasian 164 100.0% Not responsible for grandchildrenAsian 8 100.0% Not responsible for grandchildrenWhite alone, not Hispanic / Latino 106 100.0% Not responsible for grandchildren