Lakewood, NJ (New Jersey) Houses and Residents
Estimated median house or condo value in 2022: $831,600 (it was $131,600 in 2000 )
Lakewood:
$831,600New Jersey:
$428,900
Lower value quartile - upper value quartile: $462,500 - $1,145,100Mean price in 2022: Detached houses: $616,597 Here:
$616,597State:
$537,591
Townhouses or other attached units: $529,689 Here:
$529,689State:
$381,113
In 2-unit structures: $512,631 Here:
$512,631State:
$444,476
In 5-or-more-unit structures: $423,963 Here:
$423,963State:
$368,745
Total population: 53,805 (Urban population: 36,141, Rural population: 0)
Houses: 14,392 (14,000 occupied: 5,226 owner occupied, 8,774 renter occupied )
% of renters here:
63%State:
35%
Housing density: 2,011 houses/condos per square mile
Median price asked for vacant for-sale houses and condos in 2022: $280,092.
Median contract rent in 2022: $1,381 (lower quartile is $1,062, upper quartile is $1,782)
Median rent asked for vacant for-rent units in 2022: $3,026
Median gross rent in Lakewood, NJ in 2022: $1,494
Housing units in Lakewood with a mortgage: 3,371 (443 second mortgage, 68 home equity loan, 369 both second mortgage and home equity loan )Houses without a mortgage: 200
Median household income for houses/condos with a mortgage: $109,567
Median household income for apartments without a mortgage: $113,464
Median monthly housing costs: $1,787
Data:
Median house or condo value ($)
Median house or condo value ($ change since 2000)
Median house or condo value ($) - White
Median house or condo value ($) - Black or African American
Median house or condo value ($) - Asian
Median house or condo value ($) - Hispanic or Latino
Median house or condo value ($) - American Indian and Alaska Native
Median house or condo value ($) - Multirace
Median house or condo value ($) - Other Race
Median price asked for mobile homes ($)
Household density (households per square mile)
Mean house or condo value by units in structure - 1, detached ($)
Mean house or condo value by units in structure - 1, attached ($)
Mean house or condo value by units in structure - 2 ($)
Mean house or condo value by units in structure by units in structure - 3 or 4 ($)
Mean house or condo value by units in structure - 5 or more ($)
Mean house or condo value by units in structure - Boat, RV, van, etc. ($)
Mean house or condo value by units in structure - Mobile home ($)
Median contract rent ($)
Median contract rent - Lower quartile ($)
Median contract rent - Upper quartile ($)
Median gross rent ($)
Urban houses (%)
Rural houses (%)
Houses occupied (%)
Houses occupied (% change since 2000)
Houses owner occupied (%)
Houses owner occupied (% change since 2000)
Houses renter occupied (%)
Houses renter occupied (% change since 2000)
Vacant housing units - For rent (%)
Vacant housing units - For rent (% change since 2000)
Vacant housing units - For sale only (%)
Vacant housing units - For sale only (% change since 2000)
Vacant housing units - Rented or sold, not occupied (%)
Vacant housing units - Rented or sold, not occupied (% change since 2000)
Vacant housing units - For seasonal, recreational, or occasional use (%)
Vacant housing units - For seasonal, recreational, or occasional use (% change since 2000)
Vacant housing units - For migrant workers (%)
Vacant housing units - For migrant workers (% change since 2000)
Vacant housing units - Other vacant (%)
Vacant housing units - Other vacant (% change since 2000)
Median monthly housing costs ($)
Median household income for houses/condos with a mortgage ($)
Median household income for houses/condos without a mortgage ($)
Median household income ($)
Median household income ($) - White
Median household income ($) - Black or African American
Median household income ($) - Asian
Median household income ($) - Hispanic or Latino
Median household income ($) - American Indian and Alaska Native
Median household income ($) - Multirace
Median household income ($) - Other Race
Mortgage status - with mortgage (%)
Mortgage status - with second mortgage (%)
Mortgage status - with home equity loan (%)
Mortgage status - with both second mortgage and home equity loan (%)
Mortgage status - without a mortgage (%)
Median year house/condo built
Median year apartment built
Household type by relationship - Male householder living alone (%)
Household type by relationship - Male householder not living alone (%)
Household type by relationship - Female householder living alone (%)
Household type by relationship - Female householder not living alone (%)
Household type by relationship - Opposite-Sex spouse (%)
Household type by relationship - Same-Sex spouse (%)
Household type by relationship - Opposite-Sex unmarried partner (%)
Household type by relationship - Same-Sex unmarried partner (%)
Household type by relationship - In group quarters (%)
Size of family households - 2-person household (%)
Size of family households - 3-person household (%)
Size of family households - 4-person household (%)
Size of family households - 5-person household (%)
Size of family households - 6-person household (%)
Size of family households - 7-or-more-person household (%)
Size of nonfamily households - 1-person household (%)
Size of nonfamily households - 2-person household (%)
Size of nonfamily households - 3-person household (%)
Size of nonfamily households - 4-person household (%)
Size of nonfamily households - 5-person household (%)
Size of nonfamily households - 6-person household (%)
Size of nonfamily households - 7-or-moreperson household (%)
Year house built - Built 2010 or later (%)
Year house built - Built 2000 to 2009 (%)
Year house built - Built 1990 to 1999 (%)
Year house built - Built 1980 to 1989 (%)
Year house built - Built 1970 to 1979 (%)
Year house built - Built 1960 to 1969 (%)
Year house built - Built 1950 to 1959 (%)
Year house built - Built 1940 to 1949 (%)
Year house built - Built 1939 or earlier (%)
Median number of rooms in houses and condos
Median number of rooms in apartments
Median number of bedrooms in owner occupied houses
Mean number of bedrooms in owner occupied houses
Median number of bedrooms in renter occupied houses
Mean number of bedrooms in renter occupied houses
Median number of vehichles in owner occupied houses
Mean number of vehichles in owner occupied houses
Median number of vehichles in renter occupied houses
Mean number of vehichles in renter occupied houses
Rooms in owner-occupied houses - 1 room (%)
Rooms in owner-occupied houses - 2 rooms (%)
Rooms in owner-occupied houses - 3 rooms (%)
Rooms in owner-occupied houses - 4 rooms (%)
Rooms in owner-occupied houses - 5 rooms (%)
Rooms in owner-occupied houses - 6 rooms (%)
Rooms in owner-occupied houses - 7 rooms (%)
Rooms in owner-occupied houses - 8 rooms (%)
Rooms in owner-occupied houses - 9+ rooms (%)
Rooms in renter-occupied houses - 1 room (%)
Rooms in renter-occupied houses - 2 rooms (%)
Rooms in renter-occupied houses - 3 rooms (%)
Rooms in renter-occupied houses - 4 rooms (%)
Rooms in renter-occupied houses - 5 rooms (%)
Rooms in renter-occupied houses - 6 rooms (%)
Rooms in renter-occupied houses - 7 rooms (%)
Rooms in renter-occupied houses - 8 rooms (%)
Rooms in renter-occupied houses - 9+ rooms (%)
Bedrooms in owner-occupied houses - no bedrooms (%)
Bedrooms in owner-occupied houses - 1 bedroom (%)
Bedrooms in owner-occupied houses - 2 bedrooms (%)
Bedrooms in owner-occupied houses - 3 bedrooms (%)
Bedrooms in owner-occupied houses - 4 bedrooms (%)
Bedrooms in owner-occupied houses - 5+ bedrooms (%)
Bedrooms in renter-occupied houses - no bedrooms (%)
Bedrooms in renter-occupied houses - 1 bedroom (%)
Bedrooms in renter-occupied houses - 2 bedrooms (%)
Bedrooms in renter-occupied houses - 3 bedrooms (%)
Bedrooms in renter-occupied houses - 4 bedrooms (%)
Bedrooms in renter-occupied houses - 5+ bedrooms (%)
Vehicles available in owner-occupied houses - no vehicle available (%)
Vehicles available in owner-occupied houses - 1 vehicle available(%)
Vehicles available in owner-occupied houses - 2 Vehicles available (%)
Vehicles available in owner-occupied houses - 3 Vehicles available (%)
Vehicles available in owner-occupied houses - 4 Vehicles available (%)
Vehicles available in owner-occupied houses - 5+ Vehicles available (%)
Vehicles available in renter-occupied houses - no vehicle available (%)
Vehicles available in renter-occupied houses - 1 vehicle available (%)
Vehicles available in renter-occupied houses - 2 Vehicles available (%)
Vehicles available in renter-occupied houses - 3 Vehicles available (%)
Vehicles available in renter-occupied houses - 4 Vehicles available (%)
Vehicles available in renter-occupied houses - 5+ Vehicles available (%)
Housing units in structures - 1, detached (%)
Housing units in structures - 1, attached (%)
Housing units in structures - 2 (%)
Housing units in structures - 3 or 4 (%)
Housing units in structures - 5 to 9 (%)
Housing units in structures - 10 to 19 (%)
Housing units in structures - 20 to 49 (%)
Housing units in structures - 50 or more (%)
Housing units in structures - Mobile home (%)
Housing units in structures - Boat, RV, van, etc. (%)
Housing units in structures - Owners - 1, detached (%)
Housing units in structures - Owners - 1, attached (%)
Housing units in structures - Owners - 2 (%)
Housing units in structures - Owners - 3 or 4 (%)
Housing units in structures - Owners - 5 to 9 (%)
Housing units in structures - Owners - 10 to 19 (%)
Housing units in structures - Owners - 20 to 49 (%)
Housing units in structures - Owners - 50 or more (%)
Housing units in structures - Owners - Mobile home (%)
Housing units in structures - Owners - Boat, RV, van, etc. (%)
Housing units in structures - Renters - 1, detached (%)
Housing units in structures - Renters - 1, attached (%)
Housing units in structures - Renters - 2 (%)
Housing units in structures - Renters - 3 or 4 (%)
Housing units in structures - Renters - 5 to 9 (%)
Housing units in structures - Renters - 10 to 19 (%)
Housing units in structures - Renters - 20 to 49 (%)
Housing units in structures - Renters - 50 or more (%)
Housing units in structures - Renters - Mobile home (%)
Housing units in structures - Renters - Boat, RV, van, etc. (%)
House/condo owner moved in on average (years ago)
Renter moved in on average (years ago)
Year householder moved into unit - Moved in 1999 to March 2000 (%)
Year householder moved into unit - Moved in 1999 to March 2000 (%) - White
Year householder moved into unit - Moved in 1999 to March 2000 (%) - Black or African American
Year householder moved into unit - Moved in 1999 to March 2000 (%) - Asian
Year householder moved into unit - Moved in 1999 to March 2000 (%) - Hispanic or Latino
Year householder moved into unit - Moved in 1999 to March 2000 (%) - American Indian and Alaska Native
Year householder moved into unit - Moved in 1999 to March 2000 (%) - Multirace
Year householder moved into unit - Moved in 1999 to March 2000 (%) - Other Race
Year householder moved into unit - Moved in 1995 to 1998 (%)
Year householder moved into unit - Moved in 1995 to 1998 (%) - White
Year householder moved into unit - Moved in 1995 to 1998 (%) - Black or African American
Year householder moved into unit - Moved in 1995 to 1998 (%) - Asian
Year householder moved into unit - Moved in 1995 to 1998 (%) - Hispanic or Latino
Year householder moved into unit - Moved in 1995 to 1998 (%) - American Indian and Alaska Native
Year householder moved into unit - Moved in 1995 to 1998 (%) - Multirace
Year householder moved into unit - Moved in 1995 to 1998 (%) - Other Race
Year householder moved into unit - Moved in 1990 to 1994 (%)
Year householder moved into unit - Moved in 1990 to 1994 (%) - White
Year householder moved into unit - Moved in 1990 to 1994 (%) - Black or African American
Year householder moved into unit - Moved in 1990 to 1994 (%) - Asian
Year householder moved into unit - Moved in 1990 to 1994 (%) - Hispanic or Latino
Year householder moved into unit - Moved in 1990 to 1994 (%) - American Indian and Alaska Native
Year householder moved into unit - Moved in 1990 to 1994 (%) - Multirace
Year householder moved into unit - Moved in 1990 to 1994 (%) - Other Race
Year householder moved into unit - Moved in 1980 to 1989 (%)
Year householder moved into unit - Moved in 1980 to 1989 (%) - White
Year householder moved into unit - Moved in 1980 to 1989 (%) - Black or African American
Year householder moved into unit - Moved in 1980 to 1989 (%) - Asian
Year householder moved into unit - Moved in 1980 to 1989 (%) - Hispanic or Latino
Year householder moved into unit - Moved in 1980 to 1989 (%) - American Indian and Alaska Native
Year householder moved into unit - Moved in 1980 to 1989 (%) - Multirace
Year householder moved into unit - Moved in 1980 to 1989 (%) - Other Race
Year householder moved into unit - Moved in 1970 to 1979 (%)
Year householder moved into unit - Moved in 1970 to 1979 (%) - White
Year householder moved into unit - Moved in 1970 to 1979 (%) - Black or African American
Year householder moved into unit - Moved in 1970 to 1979 (%) - Asian
Year householder moved into unit - Moved in 1970 to 1979 (%) - Hispanic or Latino
Year householder moved into unit - Moved in 1970 to 1979 (%) - American Indian and Alaska Native
Year householder moved into unit - Moved in 1970 to 1979 (%) - Multirace
Year householder moved into unit - Moved in 1970 to 1979 (%) - Other Race
Year householder moved into unit - Moved in 1969 or earlier (%)
Year householder moved into unit - Moved in 1969 or earlier (%) - White
Year householder moved into unit - Moved in 1969 or earlier (%) - Black or African American
Year householder moved into unit - Moved in 1969 or earlier (%) - Asian
Year householder moved into unit - Moved in 1969 or earlier (%) - Hispanic or Latino
Year householder moved into unit - Moved in 1969 or earlier (%) - American Indian and Alaska Native
Year householder moved into unit - Moved in 1969 or earlier (%) - Multirace
Year householder moved into unit - Moved in 1969 or earlier (%) - Other Race
Housing units lacking complete plumbing facilities (%)
Housing units lacking complete kitchen facilities (%)
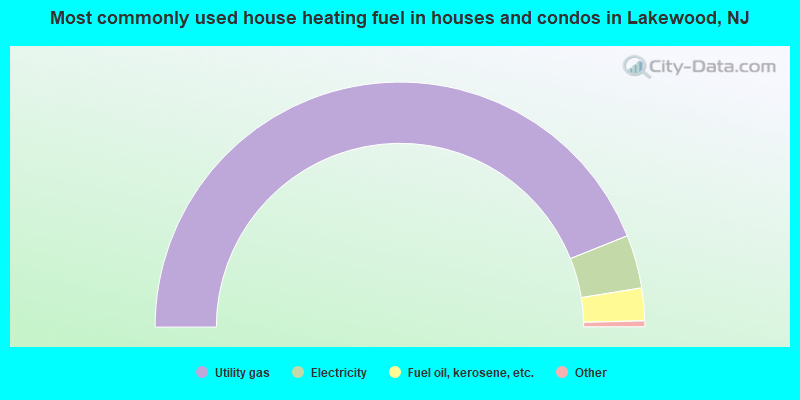
House heating fuel used in houses and condos - Utility gas (%)
House heating fuel used in houses and condos - Bottled, tank, or LP gas (%)
House heating fuel used in houses and condos - Electricity (%)
House heating fuel used in houses and condos - Fuel oil, kerosene, etc. (%)
House heating fuel used in houses and condos - Coal or coke (%)
House heating fuel used in houses and condos - Wood (%)
House heating fuel used in houses and condos - Solar energy (%)
House heating fuel used in houses and condos - Other fuel (%)
House heating fuel used in houses and condos - No fuel used (%)
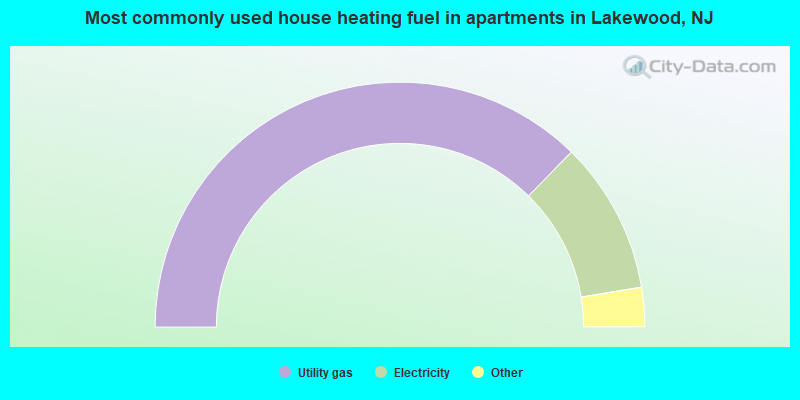
House heating fuel used in apartments - Utility gas (%)
House heating fuel used in apartments - Bottled, tank, or LP gas (%)
House heating fuel used in apartments - Electricity (%)
House heating fuel used in apartments - Fuel oil, kerosene, etc. (%)
House heating fuel used in apartments - Coal or coke (%)
House heating fuel used in apartments - Wood (%)
House heating fuel used in apartments - Solar energy (%)
House heating fuel used in apartments - Other fuel (%)
House heating fuel used in apartments - No fuel used (%)
Latest news about housing in Lakewood, NJ collected exclusively by city-data.com from local newspapers, TV, and radio stations
Median year house/condo built: 1997Median year apartment built: 1996Household type by relationship:
Households: 74,485
Male householders: 10,770 (174 living alone ), Female householders: 3,230 (506 living alone )11,733 spouses (11,733 opposite-sex spouses ), 81 unmarried partners , (81 opposite-sex unmarried partners ), 41,582 children (41,026 natural , 556 adopted , 0 stepchildren ), 759 grandchildren , 1,066 brothers or sisters , 468 parents , 92 foster children , 564 other relatives , 2,689 non-relatives In group quarters: 1,451
Size of family households: 1,869 2-persons , 1,689 3-persons , 2,630 4-persons , 919 5-persons , 598 6-persons , 5,258 7-or-more-persons .
Size of nonfamily households: 680 1-person , 69 2-persons , 288 4-persons .
32,858 married couples with children. single-parent households (1,405 men , 1,001 women ).
76.4% of residents of Lakewood speak English at home. of residents speak Spanish at home (49% speak English very well , 23% speak English well , 25% speak English not well , 4% don't speak English at all ).of residents speak other Indo-European language at home (88% speak English very well , 5% speak English well , 7% speak English not well ).of residents speak Asian or Pacific Island language at home (45% speak English very well , 50% speak English well , 5% speak English not well ).of residents speak other language at home (86% speak English very well , 8% speak English well , 5% speak English not well , 1% don't speak English at all ).
Foreign born population: 6,014 (8.1%)of them are naturalized citizens )
Median number of rooms in houses and condos:
Median number of rooms in apartments
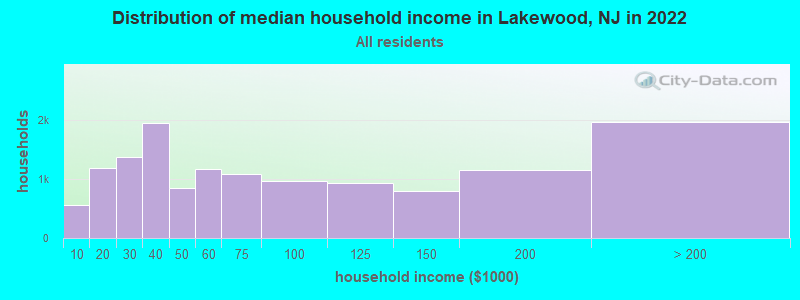
Lakewood, NJ household income distribution 567 Less than $10,0001,191 $10,000 to $19,9991,376 $20,000 to $29,9991,947 $30,000 to $39,999853 $40,000 to $49,9991,161 $50,000 to $59,9991,083 $60,000 to $74,999974 $75,000 to $99,999928 $100,000 to $124,999796 $125,000 to $149,9991,158 $150,000 to $199,9991,966 $200,000 or more
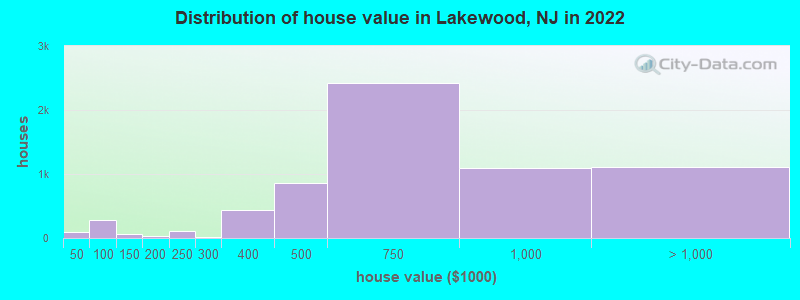
Home value of owner - occupied houses in 2022 in Lakewood, NJ 14 $20,000 to $24,99912 $35,000 to $39,99967 $40,000 to $49,99924 $50,000 to $59,99990 $70,000 to $79,999103 $80,000 to $89,99921 $100,000 to $124,99933 $125,000 to $149,99939 $175,000 to $199,999106 $200,000 to $249,9999 $250,000 to $299,999436 $300,000 to $399,999859 $400,000 to $499,9992,425 $500,000 to $749,9991,093 $750,000 to $999,999704 $1,000,000 to $1,499,999379 $1,500,000 to $1,999,99918 $2,000,000 or moreRent paid by renters in 2022 in Lakewood, NJ 27 $100 to $14951 $150 to $19971 $200 to $24981 $250 to $299106 $300 to $34962 $350 to $39959 $450 to $49952 $600 to $64926 $650 to $69925 $700 to $74955 $750 to $799250 $800 to $899437 $900 to $9991,733 $1,000 to $1,2491,367 $1,250 to $1,4992,447 $1,500 to $1,999482 $2,000 to $2,499286 $2,500 to $2,99932 $3,000 to $3,499316 No cash rent
Percentage of workers working in this county: 81.7%Number of people working at home: 2,869 (16.3% of all workers )
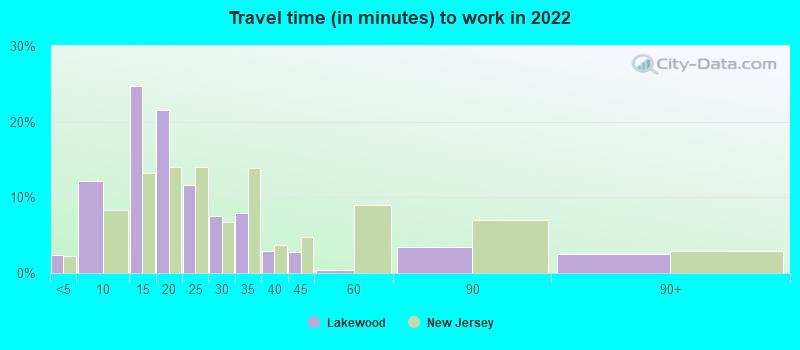
Travel time to work (commute)
Less than 5 minutes: 4545 to 9 minutes: 2,66810 to 14 minutes: 3,46115 to 19 minutes: 3,41520 to 24 minutes: 2,72425 to 29 minutes: 14730 to 34 minutes: 1,45235 to 39 minutes: 5440 to 44 minutes: 36845 to 59 minutes: 26660 to 89 minutes: 58890 or more minutes: 796
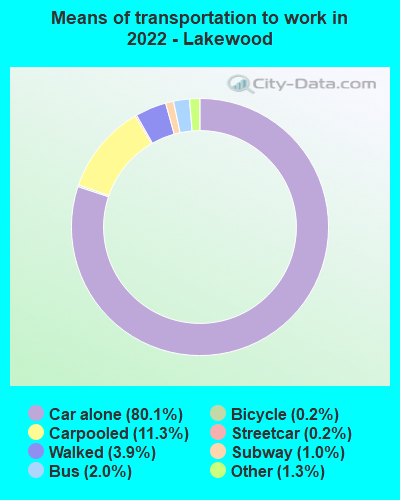
Means of transportation to work:
Drove a car alone: 13,457 (67.2%)Carpooled: 2,160 (10.8%)Bus : 258 (1.3%)Subway or elevated rail : 25 (0.1%)Long-distance train or commuter rail : 162 (0.8%)Taxi: 206 (1.0%)Bicycle: 40 (0.2%)Walked: 841 (4.2%)Worked at home: 2,869 (14.3%)
Unemployment by race in 2022
Unemployment rate for White non-Hispanic residents 5.7% Males5.1% FemalesUnemployment rate for Black residents 21.9% Males18.9% FemalesUnemployment rate for American Indian and Alaska Native residents 100.0% FemalesUnemployment rate for other race residents 7.8% FemalesUnemployment rate for two or more race residents 22.2% MalesUnemployment rate for Hispanic or Latino residents 7.3% Males18.5% Females
Year of entry for the foreign-born population in Lakewood, New Jersey
1,820 2010 or later 2,739 2000 to 2009 896 1990 to 1999 1,080 1980 to 1989 321 1970 to 1979 860 Before 1970
First ancestries reported:
American: 12,091 (29.6%)
European: 2,800 (6.9%)
Polish: 2,136 (5.2%)
Hungarian: 810 (2.0%)
Eastern European: 739 (1.8%)
Lithuanian: 534 (1.3%)
Syrian: 421 (1.0%)
German: 363 (0.9%)
Russian: 282 (0.7%)
Ukrainian: 235 (0.6%)
South African: 180 (0.4%)
Irish: 146 (0.4%)
English: 144 (0.4%)
Canadian: 125 (0.3%)
Italian: 116 (0.3%)
Jamaican: 103 (0.3%)
Israeli: 100 (0.2%)
Brazilian: 97 (0.2%)
French: 79 (0.2%)
Czech: 78 (0.2%)
Romanian: 70 (0.2%)
Austrian: 62 (0.2%)
Lebanese: 49 (0.1%)
Swiss: 31 (0.08%)
British: 30 (0.07%)
Egyptian: 30 (0.07%)
Czechoslovakian: 25 (0.06%)
Latvian: 24 (0.06%)
Guyanese: 24 (0.06%)
Barbadian: 21 (0.05%)
Kenyan: 19 (0.05%)
Ethiopian: 18 (0.04%)
Dutch: 7 (0.02%)
Norwegian: 6 (0.01%)
Portuguese: 6 (0.01%)
Danish: 3 (0.01%) Most common places of birth for foreign-born residents (%): Mexico Lakewood:
30.3% (1,816)New Jersey:
4.8% (102,527)
Dominican Republic Lakewood:
12.2% (735)New Jersey:
9.7% (209,055)
Canada Lakewood:
8.7% (523)New Jersey:
0.9% (18,317)
Israel Lakewood:
5.8% (348)New Jersey:
0.5% (10,975)
South Africa Lakewood:
3.7% (225)New Jersey:
0.2% (3,369)
Ukraine Lakewood:
3.2% (192)New Jersey:
1.1% (22,760)
Poland Lakewood:
2.4% (145)New Jersey:
2.3% (48,811)
Austria Lakewood:
2.4% (143)New Jersey:
0.1% (1,939)
Ecuador Lakewood:
1.7% (104)New Jersey:
4.4% (95,275)
Jamaica Lakewood:
1.7% (104)New Jersey:
2.2% (47,365)
England Lakewood:
1.7% (101)New Jersey:
0.5% (10,886)
Peru Lakewood:
1.6% (98)New Jersey:
2.7% (58,563)
Guatemala Lakewood:
1.6% (97)New Jersey:
2.2% (46,813)
France Lakewood:
1.6% (96)New Jersey:
0.3% (6,882)
Brazil Lakewood:
1.5% (91)New Jersey:
2.1% (46,020)
Place of birth for U.S.-born residents:
This state: 44,998Other state: 21,201Northeast: 18,173Midwest: 1,762South: 287West: 979 95.0% of Lakewood residents lived in the same house 1 years ago.
Out of people who lived in different houses, 44.7% lived in this county.
Out of people who lived in different counties, 26.7% lived in New Jersey.
Lakewood:
95.0%State average:
90.4%
Education attainment for males 25 years and older:
No schooling: 79Nursery to 4th grade: 05th and 6th grade: 3987th and 8th grade: 2779th grade: 010th grade: 911th grade: 17812th grade, no diploma: 776High school graduate (or equivalency): 3,601Less than 1 year of college: 1,042Some college more than 1 year, no degree: 3,405Associate degree: 453Bachelor's degree: 2,832Master's degree: 1,682Professional school degree: 449Doctorate degree: 422
Education attainment for females 25 years and older:
No schooling: 168Nursery to 4th grade: 05th and 6th grade: 7167th and 8th grade: 559th grade: 010th grade: 4511th grade: 012th grade, no diploma: 268High school graduate (or equivalency): 5,092Less than 1 year of college: 1,368Some college more than 1 year, no degree: 1,788Associate degree: 82Bachelor's degree: 1,101Master's degree: 1,248Professional school degree: 298Doctorate degree: 184
Housing units in structures:
One, detached: 5,447One, attached: 4,852Two: 1,0953 or 4: 4525 to 9: 31510 to 19: 32820 to 49: 1,19850 or more: 705House/condo owner moved in on average 12 years ago
Renter moved in on average 6 years ago
Private vs. public school enrollment:
Students in private schools in grades 1 to 8 (elementary and middle school): 15,147 Here:
88.8%New Jersey:
12.3%
Students in private schools in grades 9 to 12 (high school): 6,101 Here:
89.4%New Jersey:
13.1%
Students in private undergraduate colleges: 4,901 Here:
92.9%New Jersey:
33.2%