Races in Lakewood, New Jersey (NJ) Detailed Stats
Data:
Races - White alone (%)
Races - White alone (% change since 2000)
Races - Black alone (%)
Races - Black alone (% change since 2000)
Races - American Indian alone (%)
Races - American Indian alone (% change since 2000)
Races - Asian alone (%)
Races - Asian alone (% change since 2000)
Races - Hispanic (%)
Races - Hispanic (% change since 2000)
Races - Native Hawaiian and Other Pacific Islander alone (%)
Races - Native Hawaiian and Other Pacific Islander alone (% change since 2000)
Races - Two or more races(%)
Races - Two or more races(% change since 2000)
Races - Other race alone (%)
Races - Other race alone (% change since 2000)
Racial diversity
Place of birth - Born in state of residence (%)
Place of birth - Born in state of residence (%) - White
Place of birth - Born in state of residence (%) - Black or African American
Place of birth - Born in state of residence (%) - Asian
Place of birth - Born in state of residence (%) - Hispanic or Latino
Place of birth - Born in state of residence (%) - American Indian and Alaska Native
Place of birth - Born in state of residence (%) - Multirace
Place of birth - Born in state of residence (%) - Other Race
Place of birth - Born in other state (%)
Place of birth - Born in other state (%) - White
Place of birth - Born in other state (%) - Black or African American
Place of birth - Born in other state (%) - Asian
Place of birth - Born in other state (%) - Hispanic or Latino
Place of birth - Born in other state (%) - American Indian and Alaska Native
Place of birth - Born in other state (%) - Multirace
Place of birth - Born in other state (%) - Other Race
Place of birth - Native, outside of US (%)
Place of birth - Native, outside of US (%) - White
Place of birth - Native, outside of US (%) - Black or African American
Place of birth - Native, outside of US (%) - Asian
Place of birth - Native, outside of US (%) - Hispanic or Latino
Place of birth - Native, outside of US (%) - American Indian and Alaska Native
Place of birth - Native, outside of US (%) - Multirace
Place of birth - Native, outside of US (%) - Other Race
Place of birth - Foreign born (%)
Place of birth - Foreign born (%) - White
Place of birth - Foreign born (%) - Black or African American
Place of birth - Foreign born (%) - Asian
Place of birth - Foreign born (%) - Hispanic or Latino
Place of birth - Foreign born (%) - American Indian and Alaska Native
Place of birth - Foreign born (%) - Multirace
Place of birth - Foreign born (%) - Other Race
Residents speaking English at home (%)
Residents speaking English at home - Born in the United States (%)
Residents speaking English at home - Native, born elsewhere (%)
Residents speaking English at home - Foreign born (%)
Residents speaking Spanish at home (%)
Residents speaking Spanish at home - Born in the United States (%)
Residents speaking Spanish at home - Native, born elsewhere (%)
Residents speaking Spanish at home - Foreign born (%)
Residents speaking other language at home (%)
Residents speaking other language at home - Born in the United States (%)
Residents speaking other language at home - Native, born elsewhere (%)
Residents speaking other language at home - Foreign born (%)
Marital status - Never married (%)
Marital status - Now married (%)
Marital status - Separated (%)
Marital status - Widowed (%)
Marital status - Divorced (%)
Ancestries Reported - Arab (%)
Ancestries Reported - Czech (%)
Ancestries Reported - Danish (%)
Ancestries Reported - Dutch (%)
Ancestries Reported - English (%)
Ancestries Reported - French (%)
Ancestries Reported - French Canadian (%)
Ancestries Reported - German (%)
Ancestries Reported - Greek (%)
Ancestries Reported - Hungarian (%)
Ancestries Reported - Irish (%)
Ancestries Reported - Italian (%)
Ancestries Reported - Lithuanian (%)
Ancestries Reported - Norwegian (%)
Ancestries Reported - Polish (%)
Ancestries Reported - Portuguese (%)
Ancestries Reported - Russian (%)
Ancestries Reported - Scotch-Irish (%)
Ancestries Reported - Scottish (%)
Ancestries Reported - Slovak (%)
Ancestries Reported - Subsaharan African (%)
Ancestries Reported - Swedish (%)
Ancestries Reported - Swiss (%)
Ancestries Reported - Ukrainian (%)
Ancestries Reported - United States (%)
Ancestries Reported - Welsh (%)
Ancestries Reported - West Indian (%)
Ancestries Reported - Other (%)
Geographical mobility - Same house 1 year ago (%)
Geographical mobility - Same house 1 year ago (%) - White
Geographical mobility - Same house 1 year ago (%) - Black or African American
Geographical mobility - Same house 1 year ago (%) - Asian
Geographical mobility - Same house 1 year ago (%) - Hispanic or Latino
Geographical mobility - Same house 1 year ago (%) - American Indian and Alaska Native
Geographical mobility - Same house 1 year ago (%) - Multirace
Geographical mobility - Same house 1 year ago (%) - Other Race
Geographical mobility - Moved within same county (%)
Geographical mobility - Moved within same county (%) - White
Geographical mobility - Moved within same county (%) - Black or African American
Geographical mobility - Moved within same county (%) - Asian
Geographical mobility - Moved within same county (%) - Hispanic or Latino
Geographical mobility - Moved within same county (%) - American Indian and Alaska Native
Geographical mobility - Moved within same county (%) - Multirace
Geographical mobility - Moved within same county (%) - Other Race
Geographical mobility - Moved from different county within same state (%)
Geographical mobility - Moved from different county within same state (%) - White
Geographical mobility - Moved from different county within same state (%) - Black or African American
Geographical mobility - Moved from different county within same state (%) - Asian
Geographical mobility - Moved from different county within same state (%) - Hispanic or Latino
Geographical mobility - Moved from different county within same state (%) - American Indian and Alaska Native
Geographical mobility - Moved from different county within same state (%) - Multirace
Geographical mobility - Moved from different county within same state (%) - Other Race
Geographical mobility - Moved from different state (%)
Geographical mobility - Moved from different state (%) - White
Geographical mobility - Moved from different state (%) - Black or African American
Geographical mobility - Moved from different state (%) - Asian
Geographical mobility - Moved from different state (%) - Hispanic or Latino
Geographical mobility - Moved from different state (%) - American Indian and Alaska Native
Geographical mobility - Moved from different state (%) - Multirace
Geographical mobility - Moved from different state (%) - Other Race
Geographical mobility - Moved from abroad (%)
Geographical mobility - Moved from abroad (%) - White
Geographical mobility - Moved from abroad (%) - Black or African American
Geographical mobility - Moved from abroad (%) - Asian
Geographical mobility - Moved from abroad (%) - Hispanic or Latino
Geographical mobility - Moved from abroad (%) - American Indian and Alaska Native
Geographical mobility - Moved from abroad (%) - Multirace
Geographical mobility - Moved from abroad (%) - Other Race
Place of birth for the foreign-born population - Ireland (%)
Place of birth for the foreign-born population - Denmark (%)
Place of birth for the foreign-born population - Norway (%)
Place of birth for the foreign-born population - Sweden (%)
Place of birth for the foreign-born population - United Kingdom (%)
Place of birth for the foreign-born population - England (%)
Place of birth for the foreign-born population - Scotland (%)
Place of birth for the foreign-born population - Other Northern Europe (%)
Place of birth for the foreign-born population - Austria (%)
Place of birth for the foreign-born population - Belgium (%)
Place of birth for the foreign-born population - France (%)
Place of birth for the foreign-born population - Germany (%)
Place of birth for the foreign-born population - Netherlands (%)
Place of birth for the foreign-born population - Switzerland (%)
Place of birth for the foreign-born population - Other Western Europe (%)
Place of birth for the foreign-born population - Greece (%)
Place of birth for the foreign-born population - Italy (%)
Place of birth for the foreign-born population - Portugal (%)
Place of birth for the foreign-born population - Spain (%)
Place of birth for the foreign-born population - Other Southern Europe (%)
Place of birth for the foreign-born population - Albania (%)
Place of birth for the foreign-born population - Belarus (%)
Place of birth for the foreign-born population - Bosnia and Herzegovina (%)
Place of birth for the foreign-born population - Bulgaria (%)
Place of birth for the foreign-born population - Croatia (%)
Place of birth for the foreign-born population - Czechoslovakia (%)
Place of birth for the foreign-born population - Hungary (%)
Place of birth for the foreign-born population - Latvia (%)
Place of birth for the foreign-born population - Lithuania (%)
Place of birth for the foreign-born population - North Macedonia (Macedonia) (%)
Place of birth for the foreign-born population - Moldova (%)
Place of birth for the foreign-born population - Poland (%)
Place of birth for the foreign-born population - Romania (%)
Place of birth for the foreign-born population - Russia (%)
Place of birth for the foreign-born population - Serbia (%)
Place of birth for the foreign-born population - Ukraine (%)
Place of birth for the foreign-born population - Other Eastern Europe (%)
Place of birth for the foreign-born population - China (%)
Place of birth for the foreign-born population - Hong Kong (%)
Place of birth for the foreign-born population - Taiwan (%)
Place of birth for the foreign-born population - Japan (%)
Place of birth for the foreign-born population - Korea (%)
Place of birth for the foreign-born population - Other Eastern Asia (%)
Place of birth for the foreign-born population - Afghanistan (%)
Place of birth for the foreign-born population - Bangladesh (%)
Place of birth for the foreign-born population - India (%)
Place of birth for the foreign-born population - Iran (%)
Place of birth for the foreign-born population - Kazakhstan (%)
Place of birth for the foreign-born population - Nepal (%)
Place of birth for the foreign-born population - Pakistan (%)
Place of birth for the foreign-born population - Sri Lanka (%)
Place of birth for the foreign-born population - Uzbekistan (%)
Place of birth for the foreign-born population - Other South Central Asia (%)
Place of birth for the foreign-born population - Burma (%)
Place of birth for the foreign-born population - Cambodia (%)
Place of birth for the foreign-born population - Indonesia (%)
Place of birth for the foreign-born population - Laos (%)
Place of birth for the foreign-born population - Malaysia (%)
Place of birth for the foreign-born population - Philippines (%)
Place of birth for the foreign-born population - Singapore (%)
Place of birth for the foreign-born population - Thailand (%)
Place of birth for the foreign-born population - Vietnam (%)
Place of birth for the foreign-born population - Other South Eastern Asia (%)
Place of birth for the foreign-born population - Armenia (%)
Place of birth for the foreign-born population - Iraq (%)
Place of birth for the foreign-born population - Israel (%)
Place of birth for the foreign-born population - Jordan (%)
Place of birth for the foreign-born population - Kuwait (%)
Place of birth for the foreign-born population - Lebanon (%)
Place of birth for the foreign-born population - Saudi Arabia (%)
Place of birth for the foreign-born population - Syria (%)
Place of birth for the foreign-born population - Turkey (%)
Place of birth for the foreign-born population - Yemen (%)
Place of birth for the foreign-born population - Other Western Asia (%)
Place of birth for the foreign-born population - Eritrea (%)
Place of birth for the foreign-born population - Ethiopia (%)
Place of birth for the foreign-born population - Kenya (%)
Place of birth for the foreign-born population - Somalia (%)
Place of birth for the foreign-born population - Uganda (%)
Place of birth for the foreign-born population - Zimbabwe (%)
Place of birth for the foreign-born population - Other Eastern Africa (%)
Place of birth for the foreign-born population - Cameroon (%)
Place of birth for the foreign-born population - Congo (%)
Place of birth for the foreign-born population - Democratic Republic of Congo (Zaire) (%)
Place of birth for the foreign-born population - Other Middle Africa (%)
Place of birth for the foreign-born population - Egypt (%)
Place of birth for the foreign-born population - Morocco (%)
Place of birth for the foreign-born population - Sudan (%)
Place of birth for the foreign-born population - Other Northern Africa (%)
Place of birth for the foreign-born population - South Africa (%)
Place of birth for the foreign-born population - Other Southern Africa (%)
Place of birth for the foreign-born population - Cabo Verde (%)
Place of birth for the foreign-born population - Ghana (%)
Place of birth for the foreign-born population - Liberia (%)
Place of birth for the foreign-born population - Nigeria (%)
Place of birth for the foreign-born population - Senegal (%)
Place of birth for the foreign-born population - Sierra Leone (%)
Place of birth for the foreign-born population - Other Western Africa (%)
Place of birth for the foreign-born population - Australia (%)
Place of birth for the foreign-born population - New Zealand (%)
Place of birth for the foreign-born population - Fiji (%)
Place of birth for the foreign-born population - Micronesia (%)
Place of birth for the foreign-born population - Bahamas (%)
Place of birth for the foreign-born population - Barbados (%)
Place of birth for the foreign-born population - Cuba (%)
Place of birth for the foreign-born population - Dominica (%)
Place of birth for the foreign-born population - Dominican Republic (%)
Place of birth for the foreign-born population - Grenada (%)
Place of birth for the foreign-born population - Haiti (%)
Place of birth for the foreign-born population - Jamaica (%)
Place of birth for the foreign-born population - St. Vincent and the Grenadines (%)
Place of birth for the foreign-born population - Trinidad and Tobago (%)
Place of birth for the foreign-born population - West Indies (%)
Place of birth for the foreign-born population - Other Caribbean (%)
Place of birth for the foreign-born population - Belize (%)
Place of birth for the foreign-born population - Costa Rica (%)
Place of birth for the foreign-born population - El Salvador (%)
Place of birth for the foreign-born population - Guatemala (%)
Place of birth for the foreign-born population - Honduras (%)
Place of birth for the foreign-born population - Mexico (%)
Place of birth for the foreign-born population - Nicaragua (%)
Place of birth for the foreign-born population - Panama (%)
Place of birth for the foreign-born population - Other Central America (%)
Place of birth for the foreign-born population - Argentina (%)
Place of birth for the foreign-born population - Bolivia (%)
Place of birth for the foreign-born population - Brazil (%)
Place of birth for the foreign-born population - Chile (%)
Place of birth for the foreign-born population - Colombia (%)
Place of birth for the foreign-born population - Ecuador (%)
Place of birth for the foreign-born population - Guyana (%)
Place of birth for the foreign-born population - Peru (%)
Place of birth for the foreign-born population - Uruguay (%)
Place of birth for the foreign-born population - Venezuela (%)
Place of birth for the foreign-born population - Other South America (%)
Place of birth for the foreign-born population - Canada (%)
Place of birth for the foreign-born population - Other Northern America (%)
Place of birth for the foreign-born population - Other (%)
Latest news about races in Lakewood, NJ collected exclusively by city-data.com from local newspapers, TV, and radio stations
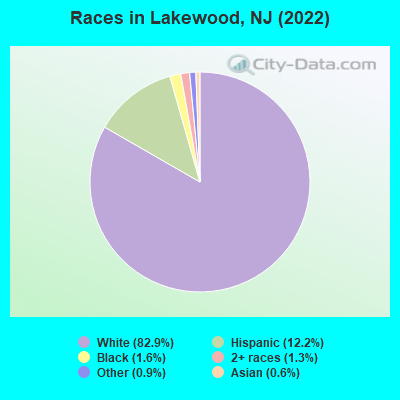
According to 2022 data, the most numerous races in Lakewood, NJ are White alone (58,356 residents), Hispanic (8,605 residents), and Black alone (1,148 residents). 76.7% of Lakewood residents speak English at home. 8.5% of Lakewood, NJ residents are foreign-born (4.5% born in Latin America, 1.8% born in Europe, 1.0% born in Asia), which is 169.8% less than the foreign-born rate of 23.0% across the entire state of New Jersey.
Race distribution in Lakewood
2000 2022
5,557,209 66.0% White alone 1,117,191 13.3% Hispanic 1,096,171 13.0% Black alone 477,012 5.7% Asian alone 133,689 1.6% Two or more races 19,565 0.2% Other race alone 11,338 0.1% American Indian alone 2,175 0.03% Native Hawaiian and Other
4,766,476 51.5% White alone 2,028,470 21.9% Hispanic 1,111,632 12.0% Black alone 923,546 10.0% Asian alone 332,237 3.6% Two or more races 89,847 1.0% Other race alone 8,557 0.09% American Indian alone 934 0.01% Native Hawaiian and Other
Income and house value in Lakewood Median household income in 2022 $57,744 White non-Hispanic householders$17,804 Black householders$46,679 Some other race householders$67,677 Two or more races householders$131,430 Hispanic or Latino race householdersMedian 2022 house value $910,589 White Non-Hispanic householders$721,646 Black or African American householders $631,914 Asian householders$697,002 Some other race householders$908,693 Two or more races householders$672,357 Hispanic or Latino householders
Median age by race in Lakewood
16.4 Median age for White residents16.4 16.3 43.0 Median age for Black or African American residents38.2 63.6 43.3 Median age for American Indian / Alaska Native residents-666,666,666.0 -666,666,666.0 45.8 Median age for Asian residents-666,666,666.0 -666,666,666.0 -666,666,666.0 Median age for Native Hawaiian / Pacific Islander residents-666,666,666.0 -666,666,666.0 27.6 Median age for Other race residents35.1 24.5 22.0 Median age for Two or more races residents18.8 33.3 16.6 Median age for White alone residents16.9 16.2 24.3 Median age for Hispanic or Latino residents27.1 24.2
Owner/renter occupied households by race in Lakewood
House owners and renters - White residents 4,678 41.0% Owner occupied6,723 59.0% Renter occupiedHouse owners and renters - Black or African American residents 53 14.2% Owner occupied317 85.8% Renter occupiedHouse owners and renters - American Indian / Alaska Native residents 136 100.0% Renter occupiedHouse owners and renters - Asian residents 109 100.0% Renter occupiedHouse owners and renters - Native Hawaiian / Pacific Islander residents 9 100.0% Renter occupiedHouse owners and renters - Other race residents 347 37.7% Owner occupied574 62.3% Renter occupiedHouse owners and renters - Two or more races residents 201 36.6% Owner occupied348 63.4% Renter occupiedHouse owners and renters - White alone residents 4,641 41.1% Owner occupied6,663 58.9% Renter occupiedHouse owners and renters - Hispanic or Latino residents 384 23.5% Owner occupied1,249 76.5% Renter occupied
Language usage in Lakewood
English speakers - Total 76.7% of residents of Lakewood speak English at home.
9.2% of residents speak Spanish at home 2,969 51.7% Speak English very well2,771 48.3% Speak English less than very well14.1% of residents speak other language at home 7,588 86.4% Speak English very well1,192 13.6% Speak English less than very well
English speakers - Born in the United States 72.8% of residents of Lakewood speak English at home.
2.8% of residents speak Spanish at home 593 100.0% Speak English very well24.4% of residents speak other language at home 4,477 87.1% Speak English very well666 12.9% Speak English less than very well
English speakers - Native, born elsewhere 77.2% of residents of Lakewood speak English at home.
6.1% of residents speak Spanish at home 121 100.0% Speak English very well16.7% of residents speak other language at home 332 100.0% Speak English very well
English speakers - Foreign-born 28.2% of residents of Lakewood speak English at home.
58.8% of residents speak Spanish at home 714 20.5% Speak English very well2,771 79.5% Speak English less than very well12.9% of residents speak other language at home 284 37.1% Speak English very well481 62.9% Speak English less than very well
White (Caucasian) - Speak only English Native:
85.3% (43,490)Foreign-born:
64.9% (1,070)
White (Caucasian) - Speak another language Native:
14.7% (7,491)Foreign-born:
35.1% (578)
Black or African American - Speak only English Native:
96.3% (782)Foreign-born:
45.0% (129)
Black or African American - Speak another language Native:
4.0% (32)Foreign-born:
54.9% (158)
American Indian / Alaska Native - Speak another language Native:
100.0% (235)Foreign-born:
97.6% (243)
Asian - Speak only English Native:
63.4% (42)Foreign-born:
23.0% (61)
Asian - Speak another language Native:
33.5% (22)Foreign-born:
75.3% (201)
Other race - Speak only English Native:
79.4% (2,825)Foreign-born:
5.4% (83)
Other race - Speak another language Native:
27.2% (968)Foreign-born:
93.2% (1,429)
Two or more races - Speak only English Native:
34.9% (730)Foreign-born:
10.9% (155)
Two or more races - Speak another language Native:
85.5% (1,791)Foreign-born:
88.7% (1,257)
White alone - Speak only English Native:
85.4% (42,700)Foreign-born:
64.9% (1,070)
White alone - Speak another language Native:
14.6% (7,287)Foreign-born:
35.1% (578)
Hispanic or Latino - Speak another language Native:
60.1% (2,255)Foreign-born:
100.0% (3,485)
Foreign-born residents in Lakewood 6,001 residents are foreign born (4.5% Latin America , 1.8% Europe , 1.0% Asia ).
This city:
8.5%New Jersey:
23.2%
Marital status for residents in Lakewood Marital status - White (Caucasian) population 15 years and over
Males 29.5% Never married68.6% Now married0.0% Separated0.0% Widowed1.9% DivorcedFemales 35.5% Never married59.8% Now married0.0% Separated2.9% Widowed1.8% DivorcedWomen who gave birth in the past 12 months Now married:
100.0% (2,415)Unmarried:
0.0% (0)
Women who did not give birth in the past 12 months Now married:
47.6% (5,597)Unmarried:
52.4% (6,161)
Marital status - Black or African American population 15 years and over
Males 69.8% Never married24.4% Now married4.2% Separated0.0% Widowed1.6% DivorcedFemales 63.0% Never married9.2% Now married1.5% Separated15.7% Widowed10.7% DivorcedWomen who did not give birth in the past 12 months Now married:
18.1% (27)Unmarried:
81.9% (121)
Marital status - American Indian / Alaska Native population 15 years and over
Males 52.3% Never married47.7% Now married0.0% Separated0.0% Widowed0.0% DivorcedFemales 45.1% Never married54.9% Now married0.0% Separated0.0% Widowed0.0% DivorcedWomen who did not give birth in the past 12 months Now married:
54.9% (130)Unmarried:
45.1% (107)
Marital status - Asian population 15 years and over
Males 28.0% Never married40.0% Now married0.0% Separated0.0% Widowed32.0% DivorcedFemales 0.0% Never married100.0% Now married0.0% Separated0.0% Widowed0.0% DivorcedWomen who did not give birth in the past 12 months Now married:
100.0% (59)Unmarried:
0.0% (0)
Marital status - Other race population 15 years and over
Males 43.2% Never married53.7% Now married0.0% Separated0.0% Widowed3.1% DivorcedFemales 29.1% Never married63.4% Now married4.6% Separated2.9% Widowed0.0% DivorcedWomen who gave birth in the past 12 months Now married:
100.0% (79)Unmarried:
0.0% (0)
Women who did not give birth in the past 12 months Now married:
59.0% (589)Unmarried:
41.0% (409)
Marital status - Two or more races population 15 years and over
Males 65.7% Never married34.3% Now married0.0% Separated0.0% Widowed0.0% DivorcedFemales 74.7% Never married25.3% Now married0.0% Separated0.0% Widowed0.0% DivorcedWomen who gave birth in the past 12 months Now married:
100.0% (41)Unmarried:
0.0% (0)
Women who did not give birth in the past 12 months Now married:
21.8% (256)Unmarried:
78.2% (916)
Marital status - White alone, not Hispanic / Latino population 15 years and over
Males 29.6% Never married68.5% Now married0.0% Separated0.0% Widowed1.9% DivorcedFemales 35.7% Never married59.9% Now married0.0% Separated2.5% Widowed1.8% DivorcedWomen who gave birth in the past 12 months Now married:
100.0% (2,415)Unmarried:
0.0% (0)
Women who did not give birth in the past 12 months Now married:
47.3% (5,528)Unmarried:
52.7% (6,161)
Marital status - Hispanic or Latino population 15 years and over
Males 54.9% Never married40.6% Now married0.0% Separated0.0% Widowed4.5% DivorcedFemales 48.2% Never married42.0% Now married3.1% Separated4.5% Widowed2.3% DivorcedWomen who gave birth in the past 12 months Now married:
100.0% (48)Unmarried:
0.0% (0)
Women who did not give birth in the past 12 months Now married:
40.1% (763)Unmarried:
59.9% (1,140)
Ancestries in Lakewood
12,091 29.6% American2,800 6.9% European2,136 5.2% Polish810 2.0% Hungarian739 1.8% Eastern European534 1.3% Lithuanian421 1.0% Syrian363 0.9% German282 0.7% Russian235 0.6% Ukrainian180 0.4% South African146 0.4% Irish144 0.4% English125 0.3% Canadian116 0.3% Italian103 0.3% Jamaican100 0.2% Israeli97 0.2% Brazilian79 0.2% French78 0.2% Czech70 0.2% Romanian62 0.2% Austrian49 0.1% Lebanese31 0.08% Swiss30 0.07% British30 0.07% Egyptian25 0.06% Czechoslovakian24 0.06% Latvian24 0.06% Guyanese21 0.05% Barbadian19 0.05% Kenyan18 0.04% Ethiopian7 0.02% Dutch6 0.01% Norwegian6 0.01% Portuguese3 0.01% Danish
Geographical mobility in Lakewood Same house 1 year ago 59,881 96.9% White (Caucasian)1,242 100.0% Black or African American468 96.6% American Indian / Alaska Native385 77.7% Asian9 100.0% Native Hawaiian / Pacific Islander4,983 91.1% Other race3,783 95.7% Two or more races58,887 96.9% White alone, not Hispanic / Latino7,760 91.8% Hispanic or LatinoMoved within same county 686 1.1% White / Caucasian45 9.1% Asian157 2.9% Other race46 1.2% Two or more races686 1.1% White alone, not Hispanic / Latino169 2.0% Hispanic or LatinoMoved within same state 104 0.2% White / Caucasian25 2.0% Black or African American19 3.8% Asian42 0.8% Other race104 0.2% White alone, not Hispanic / Latino78 0.9% Hispanic or LatinoMoved from different state 1,096 1.8% White / Caucasian34 2.8% Black or African American26 5.2% Asian345 6.3% Other race25 0.6% Two or more races1,096 1.8% White alone, not Hispanic / Latino401 4.7% Hispanic or LatinoMoved from abroad 17 3.3% Asian111 2.0% Other race136 3.4% Two or more races259 3.1% Hispanic or Latino
Children Nativity (place of birth) in Lakewood
Children under 6 years - Living with two parents Both parents native 11,551 99.2% Native93 0.8% Foreign-bornBoth parents foreign-born 310 100.0% NativeOne native, one foreign-born parent 577 95.4% Native28 4.6% Foreign-bornChildren under 6 years - Living with one parent Native parent 600 100.0% NativeForeign-born parent 356 92.3% Native30 7.7% Foreign-bornChildren 6 to 17 years - Living with two parents Both parents native 17,177 100.0% NativeBoth parents foreign-born 1,088 82.6% Native229 17.4% Foreign-bornOne native, one foreign-born parent 1,939 100.0% NativeChildren 6 to 17 years - Living with one parent Native parent 605 100.0% NativeForeign-born parent 1,318 51.4% Native1,246 48.6% Foreign-born
Grandparents responsible for own grandchildren in Lakewood
Grandparents (30 to 59 years) White / Caucasian 63 100.0% Responsible for grandchildrenWhite alone, not Hispanic / Latino 75 100.0% Responsible for grandchildrenGrandparents (60 years and over) White / Caucasian 21 10.1% Responsible for grandchildren190 89.9% Not responsible for grandchildrenWhite alone, not Hispanic / Latino 24 10.9% Responsible for grandchildren198 89.1% Not responsible for grandchildren