LaGrange, GA (Georgia) Houses and Residents
| LaGrange: | $202,751 |
| Georgia: | $297,400 |
Mean price in 2022:
Detached houses: $250,620
Here: $250,620 State: $376,364 Townhouses or other attached units: $610,691
Here: $610,691 State: $341,709 In 5-or-more-unit structures: $591,565
Here: $591,565 State: $370,730 Mobile homes: $28,608
Here: $28,608 State: $102,413
Total population: 30,557 (Urban population: 25,700 (all inside urban clusters), Rural population: 693 (all nonfarm))
Houses: 13,913 (12,423 occupied: 5,346 owner occupied, 7,555 renter occupied)
| % of renters here: | 59% |
| State: | 34% |
Housing density: 480 houses/condos per square mile
Median price asked for vacant for-sale houses and condos in 2022: $123,478.
Median contract rent in 2022: $776 (lower quartile is $563, upper quartile is $885)
Median rent asked for vacant for-rent units in 2022: $1,007
Median gross rent in LaGrange, GA in 2022: $1,041
Housing units in LaGrange with a mortgage: 3,040 (85 second mortgage, 11 home equity loan, 45 both second mortgage and home equity loan)
Houses without a mortgage: 11
Median household income for houses/condos with a mortgage: $98,559
Median household income for apartments without a mortgage: $39,717
Median monthly housing costs: $987
Compare current foreclosures in LaGrange, GA:
| Photo | Address | Area | Beds / Baths | Price | Details |
|---|---|---|---|---|---|

|
#1
Eichelberger Dr
Lagrange, GA 30241
|
1,396 sq. feet
|
1 baths 3 beds |
$68,250
|
show details |

|
#2
Meadowland Trl
Lagrange, GA 30240
|
1,668 sq. feet
|
2 baths 3 beds |
show details | |

|
#3
Hamilton Rd
Lagrange, GA 30241
|
1,387 sq. feet
|
1 baths 3 beds |
show details | |

|
#4
Sunset St
Lagrange, GA 30240
|
812 sq. feet
|
1 baths 2 beds |
show details | |

|
#5
Sarah Ln
Lagrange, GA 30241
|
1,646 sq. feet
|
2 baths 4 beds |
show details | |

|
#6
Elm St
Lagrange, GA 30240
|
1,034 sq. feet
|
1 baths 2 beds |
show details | |

|
#7
Yarmouth Ct
Lagrange, GA 30240
|
1,080 sq. feet
|
2 baths 3 beds |
show details | |

|
#8
Copper Creek Dr
Lagrange, GA 30240
|
1,645 sq. feet
|
2 baths - beds |
show details | |

|
#9
Park Ave
Lagrange, GA 30240
|
3,068 sq. feet
|
2 baths - beds |
show details | |

|
#10
Ridley Ave
Lagrange, GA 30240
|
874 sq. feet
|
1 baths - beds |
show details |
| Photo | Address | Area | Beds / Baths | Price | Details |
|---|---|---|---|---|---|

|
#11
S Lee St
Lagrange, GA 30240
|
1,254 sq. feet
|
2 baths - beds |
show details | |

|
#12
Jefferson St
Lagrange, GA 30240
|
1,698 sq. feet
|
2 baths - beds |
show details | |

|
#13
Callaway Ave
Lagrange, GA 30240
|
1,152 sq. feet
|
1 baths - beds |
show details | |

|
#14
Piney Woods Dr
Lagrange, GA 30240
|
2,489 sq. feet
|
3 baths - beds |
show details | |

|
#15
S State Line Rd
Lagrange, GA 30240
|
1,327 sq. feet
|
2 baths - beds |
show details | |

|
#16
Costley Rd
Lagrange, GA 30241
|
1,931 sq. feet
|
3 baths - beds |
show details | |

|
#17
Youngs Mill Rd
Lagrange, GA 30241
|
1,370 sq. feet
|
2 baths - beds |
show details | |

|
#18
Upper Big Springs Rd
Lagrange, GA 30241
|
1,232 sq. feet
|
1 baths - beds |
show details | |

|
#19
Hastings Ct
Lagrange, GA 30240
|
1,133 sq. feet
|
2 baths - beds |
show details | |

|
#20
N Whatley Rd
Lagrange, GA 30240
|
1,504 sq. feet
|
2 baths - beds |
show details |
| Photo | Address | Area | Beds / Baths | Price | Details |
|---|---|---|---|---|---|

|
#21
N Cary St
Lagrange, GA 30241
|
1,456 sq. feet
|
3 baths - beds |
show details | |

|
#22
Edgemont Dr
Lagrange, GA 30240
|
1,522 sq. feet
|
2 baths - beds |
show details | |

|
#23
View Pointe Cir
Lagrange, GA 30241
|
2,564 sq. feet
|
3 baths - beds |
show details | |

|
#24
Glass Bridge Rd
Lagrange, GA 30240
|
2,189 sq. feet
|
2 baths - beds |
show details | |

|
#25
Rosemont Rd
Lagrange, GA 30241
|
1,295 sq. feet
|
2 baths - beds |
show details | |

|
#26
Lakeshore Way
Lagrange, GA 30240
|
2,349 sq. feet
|
3 baths - beds |
show details | |

|
#27
Weathers Dr
Lagrange, GA 30240
|
1,807 sq. feet
|
2 baths - beds |
show details | |

|
#28
Williams Rd
Lagrange, GA 30240
|
2,250 sq. feet
|
2 baths - beds |
show details | |

|
#29
E Mount Zion Church Rd
Lagrange, GA 30241
|
1,548 sq. feet
|
2 baths - beds |
show details | |

|
#30
Troup St
Lagrange, GA 30240
|
848 sq. feet
|
1 baths - beds |
show details |
| Photo | Address | Area | Beds / Baths | Price | Details |
|---|---|---|---|---|---|

|
#31
Ridgefield Dr
Lagrange, GA 30241
|
1,103 sq. feet
|
2 baths - beds |
show details | |

|
#32
Youngs Mill Rd
Lagrange, GA 30241
|
2,381 sq. feet
|
3 baths - beds |
show details | |

|
#33
Perimeter Dr
Lagrange, GA 30241
|
2,152 sq. feet
|
2 baths - beds |
show details | |

|
#34
Nashua Dr
Lagrange, GA 30241
|
2,656 sq. feet
|
3 baths - beds |
show details | |

|
#35
Fulton St
Lagrange, GA 30241
|
1,044 sq. feet
|
1 baths - beds |
show details | |

|
#36
Jackson St
Lagrange, GA 30240
|
904 sq. feet
|
1 baths - beds |
show details | |

|
#37
Hampton Green Dr
Lagrange, GA 30240
|
1,196 sq. feet
|
2 baths - beds |
show details | |

|
#38
Heatherbrook Dr
Lagrange, GA 30240
|
1,225 sq. feet
|
2 baths - beds |
show details | |

|
#39
Mooty Bridge Rd
Lagrange, GA 30240
|
1,344 sq. feet
|
2 baths - beds |
show details | |

|
#40
Clairmont Dr
Lagrange, GA 30240
|
1,553 sq. feet
|
2 baths - beds |
show details |
| Photo | Address | Area | Beds / Baths | Price | Details |
|---|---|---|---|---|---|

|
#41
Hunters Ln
Lagrange, GA 30240
|
2,170 sq. feet
|
2 baths - beds |
show details | |

|
#42
Juniper St
Lagrange, GA 30240
|
1,718 sq. feet
|
1 baths - beds |
show details | |

|
#43
Still Water Ct
Lagrange, GA 30241
|
1,754 sq. feet
|
3 baths - beds |
show details | |

|
#44
New Airport Rd
Lagrange, GA 30240
|
1,456 sq. feet
|
1 baths - beds |
show details | |

|
#45
Cannonville Rd
Lagrange, GA 30240
|
2,112 sq. feet
|
2 baths - beds |
show details | |

|
#46
Bartleys Walk
Lagrange, GA 30240
|
1,291 sq. feet
|
2 baths - beds |
show details | |

|
#47
Sivell Rd
Lagrange, GA 30241
|
1,525 sq. feet
|
2 baths - beds |
show details | |

|
#48
Greenville St
Lagrange, GA 30241
|
956 sq. feet
|
1 baths - beds |
show details | |

|
#49
Brookstone Dr
Lagrange, GA 30241
|
1,378 sq. feet
|
2 baths - beds |
show details | |

|
Check over 1 million property listings on Foreclosure.com!
|
browse all offers | |||

Latest news about housing in LaGrange, GA collected exclusively by city-data.com from local newspapers, TV, and radio stations

 | Housing Search (230 replies) |
| Why it's so hard to find affordable housing in the ATL (118 replies) |
| NHL open to another expansion franchise in Atlanta (257 replies) |
| LaGrange Crossvine Village Mixed-Use Development (5 replies) |
| Savannah development news (634 replies) |
| Amazon to Occupy Spec. Building in Newnan, Create 500 Warehouse Jobs (9 replies) |

Median year apartment built: 1977
Household type by relationship:
Households: 31,470- Male householders: 4,995 (1,550 living alone), Female householders: 7,251 (2,933 living alone)
3,883 spouses (3,836 opposite-sex spouses), 928 unmarried partners, (928 opposite-sex unmarried partners), 9,529 children (8,993 natural, 127 adopted, 408 stepchildren), 1,494 grandchildren, 266 brothers or sisters, 153 parents, 0 foster children, 865 other relatives, 1,257 non-relatives
- In group quarters: 844
Size of family households: 2,770 2-persons, 2,208 3-persons, 1,343 4-persons, 614 5-persons, 154 6-persons, 299 7-or-more-persons.
Size of nonfamily households: 4,680 1-person, 501 2-persons, 206 3-persons, 37 4-persons.
2,931 married couples with children.
3,041 single-parent households (575 men, 2,466 women).
92.0% of residents of LaGrange speak English at home.
4.7% of residents speak Spanish at home (65% speak English very well, 13% speak English well, 12% speak English not well, 10% don't speak English at all).
1.1% of residents speak other Indo-European language at home (62% speak English very well, 31% speak English well, 7% speak English not well).
2.0% of residents speak Asian or Pacific Island language at home (26% speak English very well, 40% speak English well, 35% speak English not well).
Foreign born population: 1,873 (6.0%)
(25.7% of them are naturalized citizens)
| Here: | 6.5 |
| State: | 6.8 |
| Here: | 5.1 |
| State: | 4.6 |

- Bedrooms in owner-occupied houses and condos in LaGrange, Georgia
- 0no bedroom
- 411 bedroom
- 9172 bedrooms
- 2,7303 bedrooms
- 1,0614 bedrooms
- 5975+ bedrooms

- Bedrooms in renter-occupied apartments in LaGrange, Georgia
- 283no bedroom
- 1,3251 bedroom
- 3,5152 bedrooms
- 2,0033 bedrooms
- 4304 bedrooms
- 05+ bedrooms

- Cars and other vehicles available in LaGrange in owner-occupied houses/condos
- 366no vehicle
- 1,5561 vehicle
- 1,9582 vehicles
- 8553 vehicles
- 4014 vehicles
- 2115+ vehicles

- Cars and other vehicles available in LaGrange in renter-occupied apartments
- 1,404no vehicle
- 3,8791 vehicle
- 1,5552 vehicles
- 4563 vehicles
- 2494 vehicles
- 135+ vehicles

- Rooms in owner-occupied houses in LaGrange, Georgia
- 01 room
- 02 rooms
- 223 rooms
- 6074 rooms
- 1,1095 rooms
- 1,2656 rooms
- 7497 rooms
- 5268 rooms
- 1,0689+ rooms

- Rooms in renter-occupied apartments in LaGrange, Georgia
- 2541 room
- 1852 rooms
- 1,2143 rooms
- 2,0724 rooms
- 2,0955 rooms
- 1,1446 rooms
- 3027 rooms
- 1718 rooms
- 1189+ rooms


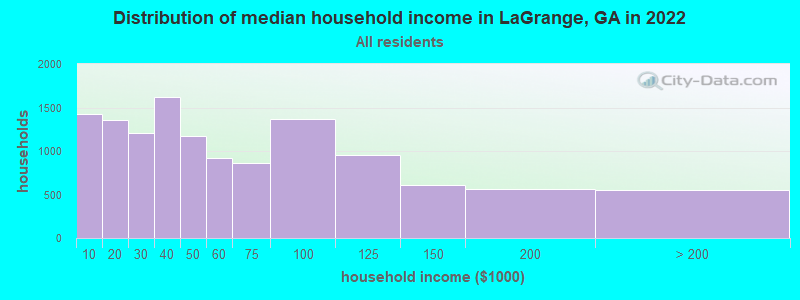
LaGrange, GA household income distribution

- 1,431Less than $10,000
- 1,354$10,000 to $19,999
- 1,208$20,000 to $29,999
- 1,616$30,000 to $39,999
- 1,171$40,000 to $49,999
- 922$50,000 to $59,999
- 865$60,000 to $74,999
- 1,366$75,000 to $99,999
- 952$100,000 to $124,999
- 607$125,000 to $149,999
- 561$150,000 to $199,999
- 549$200,000 or more
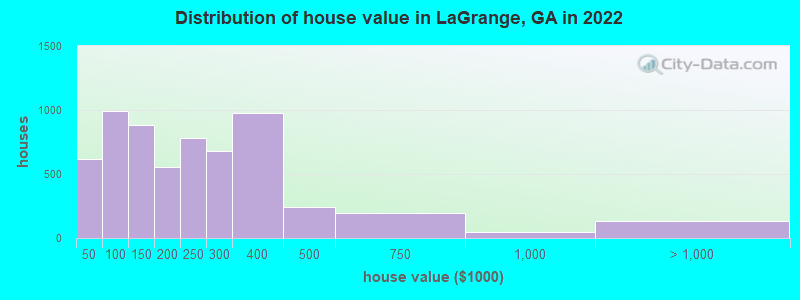
Home value of owner - occupied houses in 2022 in LaGrange, GA
-
- 78Less than $10,000
- 19$10,000 to $14,999
- 21$15,000 to $19,999
- 8$20,000 to $24,999
- 81$25,000 to $29,999
- 124$30,000 to $34,999
- 29$35,000 to $39,999
- 255$40,000 to $49,999
- 96$50,000 to $59,999
- 124$60,000 to $69,999
- 295$70,000 to $79,999
- 113$80,000 to $89,999
- 111$90,000 to $99,999
- 220$100,000 to $124,999
- 660$125,000 to $149,999
- 265$150,000 to $174,999
- 291$175,000 to $199,999
- 783$200,000 to $249,999
- 680$250,000 to $299,999
- 972$300,000 to $399,999
- 241$400,000 to $499,999
- 198$500,000 to $749,999
- 44$750,000 to $999,999
- 119$1,000,000 to $1,499,999
- 13$2,000,000 or more
Rent paid by renters in 2022 in LaGrange, GA
-
- 16Less than $100
- 101$100 to $149
- 58$150 to $199
- 9$200 to $249
- 34$250 to $299
- 373$300 to $349
- 126$350 to $399
- 318$400 to $449
- 178$450 to $499
- 619$500 to $549
- 388$550 to $599
- 565$600 to $649
- 548$650 to $699
- 239$700 to $749
- 819$750 to $799
- 1,537$800 to $899
- 462$900 to $999
- 482$1,000 to $1,249
- 229$1,250 to $1,499
- 124$1,500 to $1,999
- 61$2,000 to $2,499
- 21$2,500 to $2,999
- 26$3,500 or more
- 228No cash rent


Percentage of workers working in this county: 92.2%
Number of people working at home: 1,557 (11.0% of all workers)
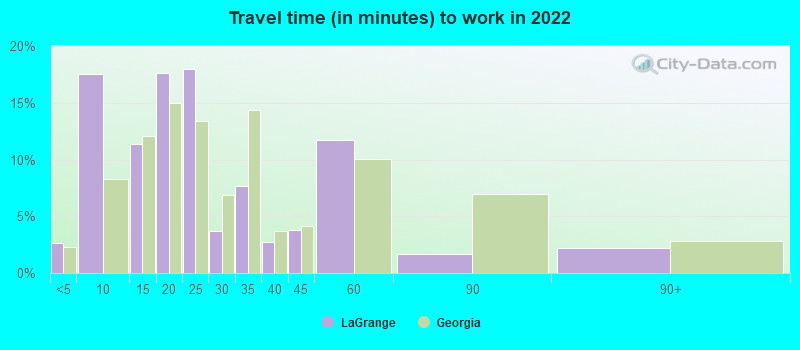
Travel time to work (commute)
- Less than 5 minutes: 301
- 5 to 9 minutes: 3,320
- 10 to 14 minutes: 1,696
- 15 to 19 minutes: 2,317
- 20 to 24 minutes: 1,816
- 25 to 29 minutes: 305
- 30 to 34 minutes: 545
- 35 to 39 minutes: 113
- 40 to 44 minutes: 432
- 45 to 59 minutes: 1,285
- 60 to 89 minutes: 200
- 90 or more minutes: 113
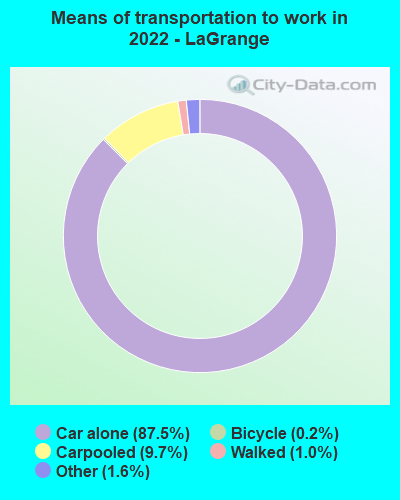
Means of transportation to work:
- Drove a car alone: 17,796 (79.0%)
- Carpooled: 2,063 (9.2%)
- Long-distance train or commuter rail: 4 (0.0%)
- Taxi: 339 (1.5%)
- Bicycle: 34 (0.2%)
- Walked: 202 (0.9%)
- Worked at home: 1,557 (6.9%)

- Unemployment by race in 2022
- Unemployment rate for White non-Hispanic residents
- 1.3%Males
- 2.9%Females
- Unemployment rate for Black residents
- 3.9%Males
- 11.8%Females
- Unemployment rate for other race residents
- 2.1%Females
- Unemployment rate for Hispanic or Latino residents
- 3.9%Females

- Year of entry for the foreign-born population in LaGrange, Georgia
- 1,0512010 or later
- 2302000 to 2009
- 1681990 to 1999
- 1521980 to 1989
- 621970 to 1979
- 70Before 1970

First ancestries reported:
- English: 1,426 (6.9%)
- American: 1,392 (6.8%)
- German: 979 (4.8%)
- Irish: 721 (3.5%)
- African: 361 (1.8%)
- Scottish: 172 (0.8%)
- Haitian: 132 (0.6%)
- Scotch-Irish: 113 (0.5%)
- French: 97 (0.5%)
- Italian: 97 (0.5%)
- Polish: 82 (0.4%)
- Czechoslovakian: 41 (0.2%)
- Swedish: 38 (0.2%)
- Jamaican: 32 (0.2%)
- Dutch: 31 (0.2%)
- European: 30 (0.1%)
- Northern European: 27 (0.1%)
- Iranian: 26 (0.1%)
- Hungarian: 23 (0.1%)
- Austrian: 17 (0.08%)
- Canadian: 17 (0.08%)
- British: 11 (0.05%)
- Slovene: 11 (0.05%)
- Norwegian: 8 (0.04%)
- Greek: 7 (0.03%)
- Israeli: 4 (0.02%)
Most common places of birth for foreign-born residents (%):
| LaGrange: | 24.0% (400) |
| Georgia: | 3.9% (43,756) |
| LaGrange: | 15.8% (263) |
| Georgia: | 9.2% (103,325) |
| LaGrange: | 14.5% (242) |
| Georgia: | 20.0% (223,400) |
| LaGrange: | 11.5% (191) |
| Georgia: | 3.6% (39,974) |
| LaGrange: | 9.9% (165) |
| Georgia: | 2.5% (27,794) |
| LaGrange: | 5.1% (85) |
| Georgia: | 0.2% (1,750) |
| LaGrange: | 2.8% (46) |
| Georgia: | 1.6% (17,851) |
| LaGrange: | 2.7% (45) |
| Georgia: | 0.1% (1,437) |
| LaGrange: | 2.7% (45) |
| Georgia: | 3.5% (39,227) |
| LaGrange: | 2.3% (39) |
| Georgia: | 0.8% (8,613) |
| LaGrange: | 1.7% (28) |
| Georgia: | 1.6% (17,476) |
| LaGrange: | 1.6% (27) |
| Georgia: | 0.6% (6,717) |
Place of birth for U.S.-born residents:
- This state: 20,957
- Other state: 8,585
- Northeast: 992
- Midwest: 976
- South: 6,145
- West: 505
83.2% of LaGrange residents lived in the same house 1 years ago.
Out of people who lived in different houses, 39.8% lived in this county.
Out of people who lived in different counties, 73.0% lived in Georgia.
| LaGrange: | 83.2% |
| State average: | 86.6% |
Education attainment for males 25 years and older:
- No schooling: 177
- Nursery to 4th grade: 51
- 5th and 6th grade: 0
- 7th and 8th grade: 382
- 9th grade: 61
- 10th grade: 79
- 11th grade: 220
- 12th grade, no diploma: 180
- High school graduate (or equivalency): 3,561
- Less than 1 year of college: 583
- Some college more than 1 year, no degree: 763
- Associate degree: 611
- Bachelor's degree: 1,554
- Master's degree: 504
- Professional school degree: 426
- Doctorate degree: 220

Education attainment for females 25 years and older:
- No schooling: 392
- Nursery to 4th grade: 41
- 5th and 6th grade: 183
- 7th and 8th grade: 102
- 9th grade: 52
- 10th grade: 597
- 11th grade: 318
- 12th grade, no diploma: 625
- High school graduate (or equivalency): 3,795
- Less than 1 year of college: 976
- Some college more than 1 year, no degree: 1,118
- Associate degree: 1,212
- Bachelor's degree: 1,503
- Master's degree: 860
- Professional school degree: 350
- Doctorate degree: 105


Housing units in structures:
- One, detached: 8,807
- One, attached: 282
- Two: 625
- 3 or 4: 407
- 5 to 9: 869
- 10 to 19: 948
- 20 to 49: 447
- 50 or more: 1,183
- Mobile homes: 341
Housing units lacking complete kitchen facilities in 2022: 4.1%
House/condo owner moved in on average 9 years ago
Renter moved in on average 3 years ago

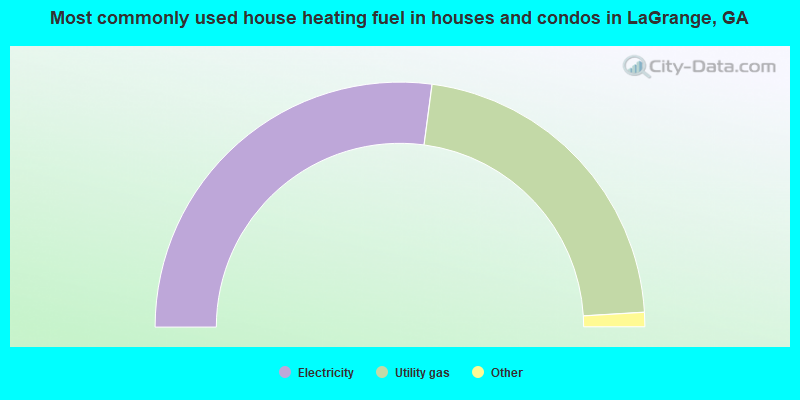
- 54.2%Electricity
- 43.9%Utility gas
- 0.9%Wood
- 0.7%Bottled, tank, or LP gas
- 0.3%No fuel used
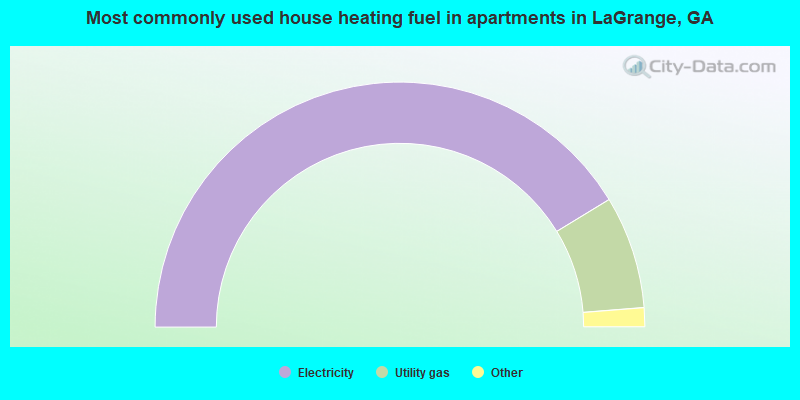
- 82.6%Electricity
- 14.9%Utility gas
- 1.7%Bottled, tank, or LP gas
- 0.6%Wood
- 0.2%No fuel used
Private vs. public school enrollment:
| Here: | 11.0% |
| Georgia: | 12.1% |
| Here: | 8.6% |
| Georgia: | 10.8% |
| Here: | 14.5% |
| Georgia: | 17.1% |


