Races in LaGrange, Georgia (GA) Detailed Stats
Data:
Races - White alone (%)
Races - White alone (% change since 2000)
Races - Black alone (%)
Races - Black alone (% change since 2000)
Races - American Indian alone (%)
Races - American Indian alone (% change since 2000)
Races - Asian alone (%)
Races - Asian alone (% change since 2000)
Races - Hispanic (%)
Races - Hispanic (% change since 2000)
Races - Native Hawaiian and Other Pacific Islander alone (%)
Races - Native Hawaiian and Other Pacific Islander alone (% change since 2000)
Races - Two or more races(%)
Races - Two or more races(% change since 2000)
Races - Other race alone (%)
Races - Other race alone (% change since 2000)
Racial diversity
Place of birth - Born in state of residence (%)
Place of birth - Born in state of residence (%) - White
Place of birth - Born in state of residence (%) - Black or African American
Place of birth - Born in state of residence (%) - Asian
Place of birth - Born in state of residence (%) - Hispanic or Latino
Place of birth - Born in state of residence (%) - American Indian and Alaska Native
Place of birth - Born in state of residence (%) - Multirace
Place of birth - Born in state of residence (%) - Other Race
Place of birth - Born in other state (%)
Place of birth - Born in other state (%) - White
Place of birth - Born in other state (%) - Black or African American
Place of birth - Born in other state (%) - Asian
Place of birth - Born in other state (%) - Hispanic or Latino
Place of birth - Born in other state (%) - American Indian and Alaska Native
Place of birth - Born in other state (%) - Multirace
Place of birth - Born in other state (%) - Other Race
Place of birth - Native, outside of US (%)
Place of birth - Native, outside of US (%) - White
Place of birth - Native, outside of US (%) - Black or African American
Place of birth - Native, outside of US (%) - Asian
Place of birth - Native, outside of US (%) - Hispanic or Latino
Place of birth - Native, outside of US (%) - American Indian and Alaska Native
Place of birth - Native, outside of US (%) - Multirace
Place of birth - Native, outside of US (%) - Other Race
Place of birth - Foreign born (%)
Place of birth - Foreign born (%) - White
Place of birth - Foreign born (%) - Black or African American
Place of birth - Foreign born (%) - Asian
Place of birth - Foreign born (%) - Hispanic or Latino
Place of birth - Foreign born (%) - American Indian and Alaska Native
Place of birth - Foreign born (%) - Multirace
Place of birth - Foreign born (%) - Other Race
Residents speaking English at home (%)
Residents speaking English at home - Born in the United States (%)
Residents speaking English at home - Native, born elsewhere (%)
Residents speaking English at home - Foreign born (%)
Residents speaking Spanish at home (%)
Residents speaking Spanish at home - Born in the United States (%)
Residents speaking Spanish at home - Native, born elsewhere (%)
Residents speaking Spanish at home - Foreign born (%)
Residents speaking other language at home (%)
Residents speaking other language at home - Born in the United States (%)
Residents speaking other language at home - Native, born elsewhere (%)
Residents speaking other language at home - Foreign born (%)
Marital status - Never married (%)
Marital status - Now married (%)
Marital status - Separated (%)
Marital status - Widowed (%)
Marital status - Divorced (%)
Ancestries Reported - Arab (%)
Ancestries Reported - Czech (%)
Ancestries Reported - Danish (%)
Ancestries Reported - Dutch (%)
Ancestries Reported - English (%)
Ancestries Reported - French (%)
Ancestries Reported - French Canadian (%)
Ancestries Reported - German (%)
Ancestries Reported - Greek (%)
Ancestries Reported - Hungarian (%)
Ancestries Reported - Irish (%)
Ancestries Reported - Italian (%)
Ancestries Reported - Lithuanian (%)
Ancestries Reported - Norwegian (%)
Ancestries Reported - Polish (%)
Ancestries Reported - Portuguese (%)
Ancestries Reported - Russian (%)
Ancestries Reported - Scotch-Irish (%)
Ancestries Reported - Scottish (%)
Ancestries Reported - Slovak (%)
Ancestries Reported - Subsaharan African (%)
Ancestries Reported - Swedish (%)
Ancestries Reported - Swiss (%)
Ancestries Reported - Ukrainian (%)
Ancestries Reported - United States (%)
Ancestries Reported - Welsh (%)
Ancestries Reported - West Indian (%)
Ancestries Reported - Other (%)
Geographical mobility - Same house 1 year ago (%)
Geographical mobility - Same house 1 year ago (%) - White
Geographical mobility - Same house 1 year ago (%) - Black or African American
Geographical mobility - Same house 1 year ago (%) - Asian
Geographical mobility - Same house 1 year ago (%) - Hispanic or Latino
Geographical mobility - Same house 1 year ago (%) - American Indian and Alaska Native
Geographical mobility - Same house 1 year ago (%) - Multirace
Geographical mobility - Same house 1 year ago (%) - Other Race
Geographical mobility - Moved within same county (%)
Geographical mobility - Moved within same county (%) - White
Geographical mobility - Moved within same county (%) - Black or African American
Geographical mobility - Moved within same county (%) - Asian
Geographical mobility - Moved within same county (%) - Hispanic or Latino
Geographical mobility - Moved within same county (%) - American Indian and Alaska Native
Geographical mobility - Moved within same county (%) - Multirace
Geographical mobility - Moved within same county (%) - Other Race
Geographical mobility - Moved from different county within same state (%)
Geographical mobility - Moved from different county within same state (%) - White
Geographical mobility - Moved from different county within same state (%) - Black or African American
Geographical mobility - Moved from different county within same state (%) - Asian
Geographical mobility - Moved from different county within same state (%) - Hispanic or Latino
Geographical mobility - Moved from different county within same state (%) - American Indian and Alaska Native
Geographical mobility - Moved from different county within same state (%) - Multirace
Geographical mobility - Moved from different county within same state (%) - Other Race
Geographical mobility - Moved from different state (%)
Geographical mobility - Moved from different state (%) - White
Geographical mobility - Moved from different state (%) - Black or African American
Geographical mobility - Moved from different state (%) - Asian
Geographical mobility - Moved from different state (%) - Hispanic or Latino
Geographical mobility - Moved from different state (%) - American Indian and Alaska Native
Geographical mobility - Moved from different state (%) - Multirace
Geographical mobility - Moved from different state (%) - Other Race
Geographical mobility - Moved from abroad (%)
Geographical mobility - Moved from abroad (%) - White
Geographical mobility - Moved from abroad (%) - Black or African American
Geographical mobility - Moved from abroad (%) - Asian
Geographical mobility - Moved from abroad (%) - Hispanic or Latino
Geographical mobility - Moved from abroad (%) - American Indian and Alaska Native
Geographical mobility - Moved from abroad (%) - Multirace
Geographical mobility - Moved from abroad (%) - Other Race
Place of birth for the foreign-born population - Ireland (%)
Place of birth for the foreign-born population - Denmark (%)
Place of birth for the foreign-born population - Norway (%)
Place of birth for the foreign-born population - Sweden (%)
Place of birth for the foreign-born population - United Kingdom (%)
Place of birth for the foreign-born population - England (%)
Place of birth for the foreign-born population - Scotland (%)
Place of birth for the foreign-born population - Other Northern Europe (%)
Place of birth for the foreign-born population - Austria (%)
Place of birth for the foreign-born population - Belgium (%)
Place of birth for the foreign-born population - France (%)
Place of birth for the foreign-born population - Germany (%)
Place of birth for the foreign-born population - Netherlands (%)
Place of birth for the foreign-born population - Switzerland (%)
Place of birth for the foreign-born population - Other Western Europe (%)
Place of birth for the foreign-born population - Greece (%)
Place of birth for the foreign-born population - Italy (%)
Place of birth for the foreign-born population - Portugal (%)
Place of birth for the foreign-born population - Spain (%)
Place of birth for the foreign-born population - Other Southern Europe (%)
Place of birth for the foreign-born population - Albania (%)
Place of birth for the foreign-born population - Belarus (%)
Place of birth for the foreign-born population - Bosnia and Herzegovina (%)
Place of birth for the foreign-born population - Bulgaria (%)
Place of birth for the foreign-born population - Croatia (%)
Place of birth for the foreign-born population - Czechoslovakia (%)
Place of birth for the foreign-born population - Hungary (%)
Place of birth for the foreign-born population - Latvia (%)
Place of birth for the foreign-born population - Lithuania (%)
Place of birth for the foreign-born population - North Macedonia (Macedonia) (%)
Place of birth for the foreign-born population - Moldova (%)
Place of birth for the foreign-born population - Poland (%)
Place of birth for the foreign-born population - Romania (%)
Place of birth for the foreign-born population - Russia (%)
Place of birth for the foreign-born population - Serbia (%)
Place of birth for the foreign-born population - Ukraine (%)
Place of birth for the foreign-born population - Other Eastern Europe (%)
Place of birth for the foreign-born population - China (%)
Place of birth for the foreign-born population - Hong Kong (%)
Place of birth for the foreign-born population - Taiwan (%)
Place of birth for the foreign-born population - Japan (%)
Place of birth for the foreign-born population - Korea (%)
Place of birth for the foreign-born population - Other Eastern Asia (%)
Place of birth for the foreign-born population - Afghanistan (%)
Place of birth for the foreign-born population - Bangladesh (%)
Place of birth for the foreign-born population - India (%)
Place of birth for the foreign-born population - Iran (%)
Place of birth for the foreign-born population - Kazakhstan (%)
Place of birth for the foreign-born population - Nepal (%)
Place of birth for the foreign-born population - Pakistan (%)
Place of birth for the foreign-born population - Sri Lanka (%)
Place of birth for the foreign-born population - Uzbekistan (%)
Place of birth for the foreign-born population - Other South Central Asia (%)
Place of birth for the foreign-born population - Burma (%)
Place of birth for the foreign-born population - Cambodia (%)
Place of birth for the foreign-born population - Indonesia (%)
Place of birth for the foreign-born population - Laos (%)
Place of birth for the foreign-born population - Malaysia (%)
Place of birth for the foreign-born population - Philippines (%)
Place of birth for the foreign-born population - Singapore (%)
Place of birth for the foreign-born population - Thailand (%)
Place of birth for the foreign-born population - Vietnam (%)
Place of birth for the foreign-born population - Other South Eastern Asia (%)
Place of birth for the foreign-born population - Armenia (%)
Place of birth for the foreign-born population - Iraq (%)
Place of birth for the foreign-born population - Israel (%)
Place of birth for the foreign-born population - Jordan (%)
Place of birth for the foreign-born population - Kuwait (%)
Place of birth for the foreign-born population - Lebanon (%)
Place of birth for the foreign-born population - Saudi Arabia (%)
Place of birth for the foreign-born population - Syria (%)
Place of birth for the foreign-born population - Turkey (%)
Place of birth for the foreign-born population - Yemen (%)
Place of birth for the foreign-born population - Other Western Asia (%)
Place of birth for the foreign-born population - Eritrea (%)
Place of birth for the foreign-born population - Ethiopia (%)
Place of birth for the foreign-born population - Kenya (%)
Place of birth for the foreign-born population - Somalia (%)
Place of birth for the foreign-born population - Uganda (%)
Place of birth for the foreign-born population - Zimbabwe (%)
Place of birth for the foreign-born population - Other Eastern Africa (%)
Place of birth for the foreign-born population - Cameroon (%)
Place of birth for the foreign-born population - Congo (%)
Place of birth for the foreign-born population - Democratic Republic of Congo (Zaire) (%)
Place of birth for the foreign-born population - Other Middle Africa (%)
Place of birth for the foreign-born population - Egypt (%)
Place of birth for the foreign-born population - Morocco (%)
Place of birth for the foreign-born population - Sudan (%)
Place of birth for the foreign-born population - Other Northern Africa (%)
Place of birth for the foreign-born population - South Africa (%)
Place of birth for the foreign-born population - Other Southern Africa (%)
Place of birth for the foreign-born population - Cabo Verde (%)
Place of birth for the foreign-born population - Ghana (%)
Place of birth for the foreign-born population - Liberia (%)
Place of birth for the foreign-born population - Nigeria (%)
Place of birth for the foreign-born population - Senegal (%)
Place of birth for the foreign-born population - Sierra Leone (%)
Place of birth for the foreign-born population - Other Western Africa (%)
Place of birth for the foreign-born population - Australia (%)
Place of birth for the foreign-born population - New Zealand (%)
Place of birth for the foreign-born population - Fiji (%)
Place of birth for the foreign-born population - Micronesia (%)
Place of birth for the foreign-born population - Bahamas (%)
Place of birth for the foreign-born population - Barbados (%)
Place of birth for the foreign-born population - Cuba (%)
Place of birth for the foreign-born population - Dominica (%)
Place of birth for the foreign-born population - Dominican Republic (%)
Place of birth for the foreign-born population - Grenada (%)
Place of birth for the foreign-born population - Haiti (%)
Place of birth for the foreign-born population - Jamaica (%)
Place of birth for the foreign-born population - St. Vincent and the Grenadines (%)
Place of birth for the foreign-born population - Trinidad and Tobago (%)
Place of birth for the foreign-born population - West Indies (%)
Place of birth for the foreign-born population - Other Caribbean (%)
Place of birth for the foreign-born population - Belize (%)
Place of birth for the foreign-born population - Costa Rica (%)
Place of birth for the foreign-born population - El Salvador (%)
Place of birth for the foreign-born population - Guatemala (%)
Place of birth for the foreign-born population - Honduras (%)
Place of birth for the foreign-born population - Mexico (%)
Place of birth for the foreign-born population - Nicaragua (%)
Place of birth for the foreign-born population - Panama (%)
Place of birth for the foreign-born population - Other Central America (%)
Place of birth for the foreign-born population - Argentina (%)
Place of birth for the foreign-born population - Bolivia (%)
Place of birth for the foreign-born population - Brazil (%)
Place of birth for the foreign-born population - Chile (%)
Place of birth for the foreign-born population - Colombia (%)
Place of birth for the foreign-born population - Ecuador (%)
Place of birth for the foreign-born population - Guyana (%)
Place of birth for the foreign-born population - Peru (%)
Place of birth for the foreign-born population - Uruguay (%)
Place of birth for the foreign-born population - Venezuela (%)
Place of birth for the foreign-born population - Other South America (%)
Place of birth for the foreign-born population - Canada (%)
Place of birth for the foreign-born population - Other Northern America (%)
Place of birth for the foreign-born population - Other (%)
Latest news about races in LaGrange, GA collected exclusively by city-data.com from local newspapers, TV, and radio stations
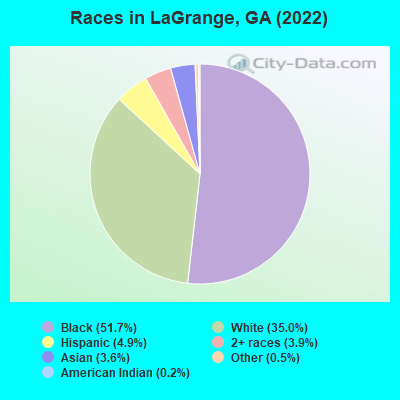
According to 2022 data, the most numerous races in LaGrange, GA are White alone (11,097 residents), Black alone (16,398 residents), and Hispanic (1,560 residents). 92.0% of LaGrange residents speak English at home. 5.3% of LaGrange, GA residents are foreign-born (2.5% born in Asia, 2.2% born in Latin America), which is 88.9% less than the foreign-born rate of 10.0% across the entire state of Georgia.
Race distribution in LaGrange
2000 2022
5,128,661 62.6% White alone 2,331,465 28.5% Black alone 435,227 5.3% Hispanic 171,513 2.1% Asian alone 87,364 1.1% Two or more races 17,670 0.2% American Indian alone 11,275 0.1% Other race alone 3,278 0.04% Native Hawaiian and Other
5,415,657 49.6% White alone 3,349,240 30.7% Black alone 1,132,604 10.4% Hispanic 479,156 4.4% Asian alone 462,923 4.2% Two or more races 54,416 0.5% Other race alone 11,923 0.1% American Indian alone 6,957 0.06% Native Hawaiian and Other
Income and house value in LaGrange Median household income in 2022 $59,687 White non-Hispanic householders$33,815 Black householders$115,125 Asian householders$40,961 Some other race householders$126,074 Two or more races householders$51,124 Hispanic or Latino race householdersMedian 2022 house value $250,865 White Non-Hispanic householders$155,408 Black or African American householders$349,153 American Indian or Alaska Native householders $353,785 Asian householders$235,942 Two or more races householders$192,973 Hispanic or Latino householders
Median age by race in LaGrange
41.8 Median age for White residents34.8 47.7 33.9 Median age for Black or African American residents28.6 37.5 17.7 Median age for American Indian / Alaska Native residents-666,666,666.0 17.5 36.4 Median age for Asian residents30.6 34.9 -666,666,666.0 Median age for Native Hawaiian / Pacific Islander residents-666,666,666.0 -666,666,666.0 42.8 Median age for Other race residents34.4 40.9 52.2 Median age for Two or more races residents45.3 43.2 44.3 Median age for White alone residents38.1 49.9 26.3 Median age for Hispanic or Latino residents21.4 26.9
Owner/renter occupied households by race in LaGrange
House owners and renters - White residents 2,985 57.9% Owner occupied2,175 42.1% Renter occupiedHouse owners and renters - Black or African American residents 2,051 32.2% Owner occupied4,326 67.8% Renter occupiedHouse owners and renters - American Indian / Alaska Native residents 18 30.0% Owner occupied41 70.0% Renter occupiedHouse owners and renters - Asian residents 219 50.8% Owner occupied213 49.2% Renter occupiedHouse owners and renters - Other race residents 95 26.4% Owner occupied263 73.6% Renter occupiedHouse owners and renters - Two or more races residents 270 69.3% Owner occupied120 30.7% Renter occupiedHouse owners and renters - White alone residents 2,891 57.9% Owner occupied2,103 42.1% Renter occupiedHouse owners and renters - Hispanic or Latino residents 117 21.5% Owner occupied427 78.5% Renter occupied
Language usage in LaGrange
English speakers - Total 92.0% of residents of LaGrange speak English at home.
4.7% of residents speak Spanish at home 914 65.3% Speak English very well485 34.7% Speak English less than very well3.1% of residents speak other language at home 369 40.5% Speak English very well543 59.5% Speak English less than very well
English speakers - Born in the United States 94.7% of residents of LaGrange speak English at home.
3.3% of residents speak Spanish at home 173 65.8% Speak English very well90 34.2% Speak English less than very well2.0% of residents speak other language at home 139 88.0% Speak English very well19 12.0% Speak English less than very well
English speakers - Native, born elsewhere 98.1% of residents of LaGrange speak English at home.
English speakers - Foreign-born 21.7% of residents of LaGrange speak English at home.
35.5% of residents speak Spanish at home 327 55.6% Speak English very well261 44.4% Speak English less than very well42.2% of residents speak other language at home 217 31.1% Speak English very well481 68.9% Speak English less than very well
White (Caucasian) - Speak only English Native:
99.4% (10,848)Foreign-born:
27.4% (35)
White (Caucasian) - Speak another language Native:
1.3% (140)Foreign-born:
70.9% (89)
Black or African American - Speak only English Native:
99.4% (14,767)Foreign-born:
60.6% (34)
Black or African American - Speak another language Native:
0.4% (59)Foreign-born:
38.8% (22)
American Indian / Alaska Native - Speak only English Native:
95.0% (32)Foreign-born:
96.6% (57)
Asian - Speak only English Native:
50.6% (158)Foreign-born:
20.9% (173)
Asian - Speak another language Native:
48.9% (153)Foreign-born:
78.0% (645)
Other race - Speak only English Native:
16.3% (97)Foreign-born:
12.1% (76)
Other race - Speak another language Native:
85.2% (508)Foreign-born:
88.7% (553)
White alone - Speak only English Native:
99.8% (10,752)Foreign-born:
49.7% (38)
White alone - Speak another language Native:
0.3% (27)Foreign-born:
50.4% (39)
Hispanic or Latino - Speak only English Native:
22.5% (169)Foreign-born:
8.7% (55)
Hispanic or Latino - Speak another language Native:
76.2% (574)Foreign-born:
91.4% (578)
Foreign-born residents in LaGrange 1,666 residents are foreign born (2.5% Asia , 2.2% Latin America ).
This city:
5.3%Georgia:
10.4%
Marital status for residents in LaGrange Marital status - White (Caucasian) population 15 years and over
Males 29.2% Never married53.1% Now married1.1% Separated3.4% Widowed13.1% DivorcedFemales 18.5% Never married46.9% Now married1.3% Separated15.9% Widowed17.3% DivorcedWomen who gave birth in the past 12 months Now married:
100.0% (42)Unmarried:
0.0% (0)
Women who did not give birth in the past 12 months Now married:
49.0% (1,273)Unmarried:
51.0% (1,326)
Marital status - Black or African American population 15 years and over
Males 55.9% Never married26.5% Now married4.9% Separated1.8% Widowed10.9% DivorcedFemales 53.1% Never married21.8% Now married3.9% Separated7.6% Widowed13.6% DivorcedWomen who gave birth in the past 12 months Now married:
4.5% (9)Unmarried:
95.5% (190)
Women who did not give birth in the past 12 months Now married:
24.5% (1,099)Unmarried:
75.5% (3,388)
Marital status - American Indian / Alaska Native population 15 years and over
Males 0.0% Never married0.0% Now married0.0% Separated100.0% Widowed0.0% DivorcedFemales 73.3% Never married26.7% Now married0.0% Separated0.0% Widowed0.0% DivorcedWomen who gave birth in the past 12 months Now married:
0.0% (0)Unmarried:
100.0% (52)
Women who did not give birth in the past 12 months Now married:
100.0% (19)Unmarried:
0.0% (0)
Marital status - Asian population 15 years and over
Males 26.8% Never married68.9% Now married0.0% Separated0.0% Widowed4.3% DivorcedFemales 35.1% Never married50.9% Now married13.1% Separated0.0% Widowed0.9% DivorcedWomen who did not give birth in the past 12 months Now married:
72.7% (262)Unmarried:
27.3% (98)
Marital status - Other race population 15 years and over
Males 60.6% Never married39.4% Now married0.0% Separated0.0% Widowed0.0% DivorcedFemales 52.7% Never married44.1% Now married0.0% Separated0.0% Widowed3.1% DivorcedWomen who did not give birth in the past 12 months Now married:
45.6% (147)Unmarried:
54.4% (175)
Marital status - Two or more races population 15 years and over
Males 69.0% Never married25.9% Now married2.0% Separated0.0% Widowed3.1% DivorcedFemales 24.6% Never married68.1% Now married0.0% Separated5.3% Widowed2.0% DivorcedWomen who did not give birth in the past 12 months Now married:
39.7% (92)Unmarried:
60.3% (139)
Marital status - White alone, not Hispanic / Latino population 15 years and over
Males 29.5% Never married52.2% Now married1.2% Separated3.6% Widowed13.6% DivorcedFemales 17.8% Never married47.5% Now married1.3% Separated16.0% Widowed17.4% DivorcedWomen who gave birth in the past 12 months Now married:
100.0% (43)Unmarried:
0.0% (0)
Women who did not give birth in the past 12 months Now married:
50.4% (1,284)Unmarried:
49.6% (1,265)
Marital status - Hispanic or Latino population 15 years and over
Males 48.3% Never married51.7% Now married0.0% Separated0.0% Widowed0.0% DivorcedFemales 53.3% Never married35.1% Now married0.0% Separated4.5% Widowed7.1% DivorcedWomen who did not give birth in the past 12 months Now married:
36.0% (127)Unmarried:
64.0% (226)
Ancestries in LaGrange
1,426 6.9% English1,392 6.8% American979 4.8% German721 3.5% Irish361 1.8% African172 0.8% Scottish132 0.6% Haitian113 0.5% Scotch-Irish97 0.5% French97 0.5% Italian82 0.4% Polish41 0.2% Czechoslovakian38 0.2% Swedish32 0.2% Jamaican31 0.2% Dutch30 0.1% European27 0.1% Northern European26 0.1% Iranian23 0.1% Hungarian17 0.08% Austrian17 0.08% Canadian11 0.05% British11 0.05% Slovene8 0.04% Norwegian7 0.03% Greek4 0.02% Israeli
Geographical mobility in LaGrange Same house 1 year ago 9,424 80.1% White (Caucasian)12,709 79.2% Black or African American40 45.7% American Indian / Alaska Native1,072 92.9% Asian843 67.2% Other race1,171 91.4% Two or more races8,772 78.6% White alone, not Hispanic / Latino1,514 98.7% Hispanic or LatinoMoved within same county 2,039 17.3% White / Caucasian1,862 11.6% Black or African American12 1.0% Asian359 28.6% Other race55 4.3% Two or more races2,039 18.3% White alone, not Hispanic / Latino274 17.9% Hispanic or LatinoMoved within same state 478 4.1% White / Caucasian280 1.7% Black or African American68 5.9% Asian12 0.9% Two or more races522 4.7% White alone, not Hispanic / Latino8 0.5% Hispanic or LatinoMoved from different state 107 0.9% White / Caucasian178 1.1% Black or African American38 3.0% Two or more races107 1.0% White alone, not Hispanic / LatinoMoved from abroad 26 0.2% White1 0.0% Black or African American44 50.1% American Indian / Alaska Native50 4.0% Other race26 0.2% White alone, not Hispanic / Latino43 2.8% Hispanic or Latino
Children Nativity (place of birth) in LaGrange
Children under 6 years - Living with two parents Both parents native 668 100.0% NativeBoth parents foreign-born 27 33.0% Native55 67.0% Foreign-bornOne native, one foreign-born parent 101 100.0% NativeChildren under 6 years - Living with one parent Native parent 1,471 100.0% NativeForeign-born parent 136 100.0% NativeChildren 6 to 17 years - Living with two parents Both parents native 1,725 98.2% Native32 1.8% Foreign-bornBoth parents foreign-born 213 81.4% Native49 18.6% Foreign-bornOne native, one foreign-born parent 64 100.0% NativeChildren 6 to 17 years - Living with one parent Native parent 1,899 100.0% NativeForeign-born parent 118 50.3% Native117 49.7% Foreign-born
Grandparents responsible for own grandchildren in LaGrange
Grandparents (30 to 59 years) White / Caucasian 19 40.3% Responsible for grandchildren28 59.7% Not responsible for grandchildrenBlack or African American 274 68.4% Responsible for grandchildren126 31.6% Not responsible for grandchildrenAsian 18 100.0% Responsible for grandchildrenWhite alone, not Hispanic / Latino 20 62.3% Responsible for grandchildren12 37.7% Not responsible for grandchildrenHispanic or Latino 18 100.0% Not responsible for grandchildrenGrandparents (60 years and over) White / Caucasian 21 25.0% Responsible for grandchildren64 75.0% Not responsible for grandchildrenBlack or African American 196 55.8% Responsible for grandchildren155 44.2% Not responsible for grandchildrenAsian 28 100.0% Responsible for grandchildrenWhite alone, not Hispanic / Latino 22 24.1% Responsible for grandchildren68 75.9% Not responsible for grandchildren