Joliet, IL (Illinois) Houses and Residents
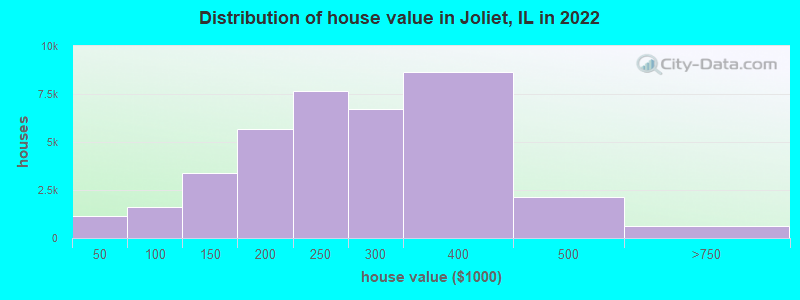
Estimated median house or condo value in 2022: $245,500 (it was $116,600 in 2000 )
Joliet:
$245,500Illinois:
$251,600
Lower value quartile - upper value quartile: $181,900 - $323,400Mean price in 2022: Detached houses: $252,162 Here:
$252,162State:
$310,164
Townhouses or other attached units: $201,918 Here:
$201,918State:
$286,230
In 2-unit structures: $223,757 Here:
$223,757State:
$299,638
In 3-to-4-unit structures: $196,402 Here:
$196,402State:
$330,907
In 5-or-more-unit structures: $130,798 Here:
$130,798State:
$318,887
Mobile homes: $182,167 Here:
$182,167State:
$78,855
Total population: 147,928 (Urban population: 105,798, Rural population: 359 (14 farm, 345 nonfarm ))
Houses: 50,949 (48,317 occupied: 37,568 owner occupied, 10,749 renter occupied )
% of renters here:
22%State:
33%
Housing density: 1,339 houses/condos per square mile
Median price asked for vacant for-sale houses and condos in 2022: $688,557.
Median contract rent in 2022: $975 (lower quartile is $753, upper quartile is $1,187)
Median rent asked for vacant for-rent units in 2022: $409
Median gross rent in Joliet, IL in 2022: $1,114
Housing units in Joliet with a mortgage: 26,022 (1,354 second mortgage, 0 home equity loan, 1,086 both second mortgage and home equity loan )Houses without a mortgage: 354
Median household income for houses/condos with a mortgage: $110,102
Median household income for apartments without a mortgage: $71,101
Median monthly housing costs: $1,378
Data:
Median house or condo value ($)
Median house or condo value ($ change since 2000)
Median house or condo value ($) - White
Median house or condo value ($) - Black or African American
Median house or condo value ($) - Asian
Median house or condo value ($) - Hispanic or Latino
Median house or condo value ($) - American Indian and Alaska Native
Median house or condo value ($) - Multirace
Median house or condo value ($) - Other Race
Median price asked for mobile homes ($)
Household density (households per square mile)
Mean house or condo value by units in structure - 1, detached ($)
Mean house or condo value by units in structure - 1, attached ($)
Mean house or condo value by units in structure - 2 ($)
Mean house or condo value by units in structure by units in structure - 3 or 4 ($)
Mean house or condo value by units in structure - 5 or more ($)
Mean house or condo value by units in structure - Boat, RV, van, etc. ($)
Mean house or condo value by units in structure - Mobile home ($)
Median contract rent ($)
Median contract rent - Lower quartile ($)
Median contract rent - Upper quartile ($)
Median gross rent ($)
Urban houses (%)
Rural houses (%)
Houses occupied (%)
Houses occupied (% change since 2000)
Houses owner occupied (%)
Houses owner occupied (% change since 2000)
Houses renter occupied (%)
Houses renter occupied (% change since 2000)
Vacant housing units - For rent (%)
Vacant housing units - For rent (% change since 2000)
Vacant housing units - For sale only (%)
Vacant housing units - For sale only (% change since 2000)
Vacant housing units - Rented or sold, not occupied (%)
Vacant housing units - Rented or sold, not occupied (% change since 2000)
Vacant housing units - For seasonal, recreational, or occasional use (%)
Vacant housing units - For seasonal, recreational, or occasional use (% change since 2000)
Vacant housing units - For migrant workers (%)
Vacant housing units - For migrant workers (% change since 2000)
Vacant housing units - Other vacant (%)
Vacant housing units - Other vacant (% change since 2000)
Median monthly housing costs ($)
Median household income for houses/condos with a mortgage ($)
Median household income for houses/condos without a mortgage ($)
Median household income ($)
Median household income ($) - White
Median household income ($) - Black or African American
Median household income ($) - Asian
Median household income ($) - Hispanic or Latino
Median household income ($) - American Indian and Alaska Native
Median household income ($) - Multirace
Median household income ($) - Other Race
Mortgage status - with mortgage (%)
Mortgage status - with second mortgage (%)
Mortgage status - with home equity loan (%)
Mortgage status - with both second mortgage and home equity loan (%)
Mortgage status - without a mortgage (%)
Median year house/condo built
Median year apartment built
Household type by relationship - Male householder living alone (%)
Household type by relationship - Male householder not living alone (%)
Household type by relationship - Female householder living alone (%)
Household type by relationship - Female householder not living alone (%)
Household type by relationship - Opposite-Sex spouse (%)
Household type by relationship - Same-Sex spouse (%)
Household type by relationship - Opposite-Sex unmarried partner (%)
Household type by relationship - Same-Sex unmarried partner (%)
Household type by relationship - In group quarters (%)
Size of family households - 2-person household (%)
Size of family households - 3-person household (%)
Size of family households - 4-person household (%)
Size of family households - 5-person household (%)
Size of family households - 6-person household (%)
Size of family households - 7-or-more-person household (%)
Size of nonfamily households - 1-person household (%)
Size of nonfamily households - 2-person household (%)
Size of nonfamily households - 3-person household (%)
Size of nonfamily households - 4-person household (%)
Size of nonfamily households - 5-person household (%)
Size of nonfamily households - 6-person household (%)
Size of nonfamily households - 7-or-moreperson household (%)
Year house built - Built 2010 or later (%)
Year house built - Built 2000 to 2009 (%)
Year house built - Built 1990 to 1999 (%)
Year house built - Built 1980 to 1989 (%)
Year house built - Built 1970 to 1979 (%)
Year house built - Built 1960 to 1969 (%)
Year house built - Built 1950 to 1959 (%)
Year house built - Built 1940 to 1949 (%)
Year house built - Built 1939 or earlier (%)
Median number of rooms in houses and condos
Median number of rooms in apartments
Median number of bedrooms in owner occupied houses
Mean number of bedrooms in owner occupied houses
Median number of bedrooms in renter occupied houses
Mean number of bedrooms in renter occupied houses
Median number of vehichles in owner occupied houses
Mean number of vehichles in owner occupied houses
Median number of vehichles in renter occupied houses
Mean number of vehichles in renter occupied houses
Rooms in owner-occupied houses - 1 room (%)
Rooms in owner-occupied houses - 2 rooms (%)
Rooms in owner-occupied houses - 3 rooms (%)
Rooms in owner-occupied houses - 4 rooms (%)
Rooms in owner-occupied houses - 5 rooms (%)
Rooms in owner-occupied houses - 6 rooms (%)
Rooms in owner-occupied houses - 7 rooms (%)
Rooms in owner-occupied houses - 8 rooms (%)
Rooms in owner-occupied houses - 9+ rooms (%)
Rooms in renter-occupied houses - 1 room (%)
Rooms in renter-occupied houses - 2 rooms (%)
Rooms in renter-occupied houses - 3 rooms (%)
Rooms in renter-occupied houses - 4 rooms (%)
Rooms in renter-occupied houses - 5 rooms (%)
Rooms in renter-occupied houses - 6 rooms (%)
Rooms in renter-occupied houses - 7 rooms (%)
Rooms in renter-occupied houses - 8 rooms (%)
Rooms in renter-occupied houses - 9+ rooms (%)
Bedrooms in owner-occupied houses - no bedrooms (%)
Bedrooms in owner-occupied houses - 1 bedroom (%)
Bedrooms in owner-occupied houses - 2 bedrooms (%)
Bedrooms in owner-occupied houses - 3 bedrooms (%)
Bedrooms in owner-occupied houses - 4 bedrooms (%)
Bedrooms in owner-occupied houses - 5+ bedrooms (%)
Bedrooms in renter-occupied houses - no bedrooms (%)
Bedrooms in renter-occupied houses - 1 bedroom (%)
Bedrooms in renter-occupied houses - 2 bedrooms (%)
Bedrooms in renter-occupied houses - 3 bedrooms (%)
Bedrooms in renter-occupied houses - 4 bedrooms (%)
Bedrooms in renter-occupied houses - 5+ bedrooms (%)
Vehicles available in owner-occupied houses - no vehicle available (%)
Vehicles available in owner-occupied houses - 1 vehicle available(%)
Vehicles available in owner-occupied houses - 2 Vehicles available (%)
Vehicles available in owner-occupied houses - 3 Vehicles available (%)
Vehicles available in owner-occupied houses - 4 Vehicles available (%)
Vehicles available in owner-occupied houses - 5+ Vehicles available (%)
Vehicles available in renter-occupied houses - no vehicle available (%)
Vehicles available in renter-occupied houses - 1 vehicle available (%)
Vehicles available in renter-occupied houses - 2 Vehicles available (%)
Vehicles available in renter-occupied houses - 3 Vehicles available (%)
Vehicles available in renter-occupied houses - 4 Vehicles available (%)
Vehicles available in renter-occupied houses - 5+ Vehicles available (%)
Housing units in structures - 1, detached (%)
Housing units in structures - 1, attached (%)
Housing units in structures - 2 (%)
Housing units in structures - 3 or 4 (%)
Housing units in structures - 5 to 9 (%)
Housing units in structures - 10 to 19 (%)
Housing units in structures - 20 to 49 (%)
Housing units in structures - 50 or more (%)
Housing units in structures - Mobile home (%)
Housing units in structures - Boat, RV, van, etc. (%)
Housing units in structures - Owners - 1, detached (%)
Housing units in structures - Owners - 1, attached (%)
Housing units in structures - Owners - 2 (%)
Housing units in structures - Owners - 3 or 4 (%)
Housing units in structures - Owners - 5 to 9 (%)
Housing units in structures - Owners - 10 to 19 (%)
Housing units in structures - Owners - 20 to 49 (%)
Housing units in structures - Owners - 50 or more (%)
Housing units in structures - Owners - Mobile home (%)
Housing units in structures - Owners - Boat, RV, van, etc. (%)
Housing units in structures - Renters - 1, detached (%)
Housing units in structures - Renters - 1, attached (%)
Housing units in structures - Renters - 2 (%)
Housing units in structures - Renters - 3 or 4 (%)
Housing units in structures - Renters - 5 to 9 (%)
Housing units in structures - Renters - 10 to 19 (%)
Housing units in structures - Renters - 20 to 49 (%)
Housing units in structures - Renters - 50 or more (%)
Housing units in structures - Renters - Mobile home (%)
Housing units in structures - Renters - Boat, RV, van, etc. (%)
House/condo owner moved in on average (years ago)
Renter moved in on average (years ago)
Year householder moved into unit - Moved in 1999 to March 2000 (%)
Year householder moved into unit - Moved in 1999 to March 2000 (%) - White
Year householder moved into unit - Moved in 1999 to March 2000 (%) - Black or African American
Year householder moved into unit - Moved in 1999 to March 2000 (%) - Asian
Year householder moved into unit - Moved in 1999 to March 2000 (%) - Hispanic or Latino
Year householder moved into unit - Moved in 1999 to March 2000 (%) - American Indian and Alaska Native
Year householder moved into unit - Moved in 1999 to March 2000 (%) - Multirace
Year householder moved into unit - Moved in 1999 to March 2000 (%) - Other Race
Year householder moved into unit - Moved in 1995 to 1998 (%)
Year householder moved into unit - Moved in 1995 to 1998 (%) - White
Year householder moved into unit - Moved in 1995 to 1998 (%) - Black or African American
Year householder moved into unit - Moved in 1995 to 1998 (%) - Asian
Year householder moved into unit - Moved in 1995 to 1998 (%) - Hispanic or Latino
Year householder moved into unit - Moved in 1995 to 1998 (%) - American Indian and Alaska Native
Year householder moved into unit - Moved in 1995 to 1998 (%) - Multirace
Year householder moved into unit - Moved in 1995 to 1998 (%) - Other Race
Year householder moved into unit - Moved in 1990 to 1994 (%)
Year householder moved into unit - Moved in 1990 to 1994 (%) - White
Year householder moved into unit - Moved in 1990 to 1994 (%) - Black or African American
Year householder moved into unit - Moved in 1990 to 1994 (%) - Asian
Year householder moved into unit - Moved in 1990 to 1994 (%) - Hispanic or Latino
Year householder moved into unit - Moved in 1990 to 1994 (%) - American Indian and Alaska Native
Year householder moved into unit - Moved in 1990 to 1994 (%) - Multirace
Year householder moved into unit - Moved in 1990 to 1994 (%) - Other Race
Year householder moved into unit - Moved in 1980 to 1989 (%)
Year householder moved into unit - Moved in 1980 to 1989 (%) - White
Year householder moved into unit - Moved in 1980 to 1989 (%) - Black or African American
Year householder moved into unit - Moved in 1980 to 1989 (%) - Asian
Year householder moved into unit - Moved in 1980 to 1989 (%) - Hispanic or Latino
Year householder moved into unit - Moved in 1980 to 1989 (%) - American Indian and Alaska Native
Year householder moved into unit - Moved in 1980 to 1989 (%) - Multirace
Year householder moved into unit - Moved in 1980 to 1989 (%) - Other Race
Year householder moved into unit - Moved in 1970 to 1979 (%)
Year householder moved into unit - Moved in 1970 to 1979 (%) - White
Year householder moved into unit - Moved in 1970 to 1979 (%) - Black or African American
Year householder moved into unit - Moved in 1970 to 1979 (%) - Asian
Year householder moved into unit - Moved in 1970 to 1979 (%) - Hispanic or Latino
Year householder moved into unit - Moved in 1970 to 1979 (%) - American Indian and Alaska Native
Year householder moved into unit - Moved in 1970 to 1979 (%) - Multirace
Year householder moved into unit - Moved in 1970 to 1979 (%) - Other Race
Year householder moved into unit - Moved in 1969 or earlier (%)
Year householder moved into unit - Moved in 1969 or earlier (%) - White
Year householder moved into unit - Moved in 1969 or earlier (%) - Black or African American
Year householder moved into unit - Moved in 1969 or earlier (%) - Asian
Year householder moved into unit - Moved in 1969 or earlier (%) - Hispanic or Latino
Year householder moved into unit - Moved in 1969 or earlier (%) - American Indian and Alaska Native
Year householder moved into unit - Moved in 1969 or earlier (%) - Multirace
Year householder moved into unit - Moved in 1969 or earlier (%) - Other Race
Housing units lacking complete plumbing facilities (%)
Housing units lacking complete kitchen facilities (%)
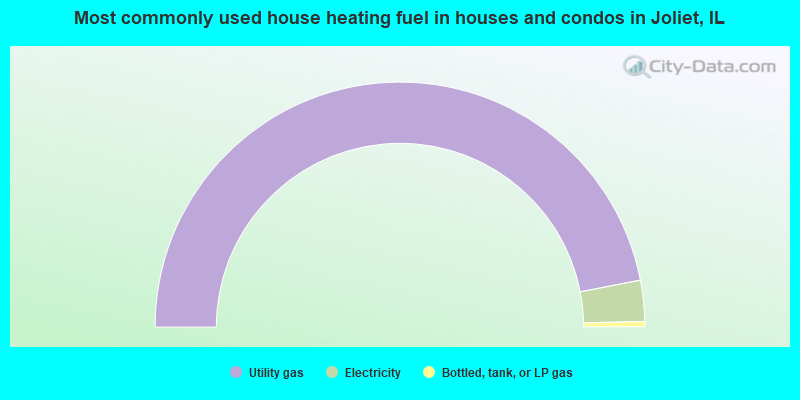
House heating fuel used in houses and condos - Utility gas (%)
House heating fuel used in houses and condos - Bottled, tank, or LP gas (%)
House heating fuel used in houses and condos - Electricity (%)
House heating fuel used in houses and condos - Fuel oil, kerosene, etc. (%)
House heating fuel used in houses and condos - Coal or coke (%)
House heating fuel used in houses and condos - Wood (%)
House heating fuel used in houses and condos - Solar energy (%)
House heating fuel used in houses and condos - Other fuel (%)
House heating fuel used in houses and condos - No fuel used (%)
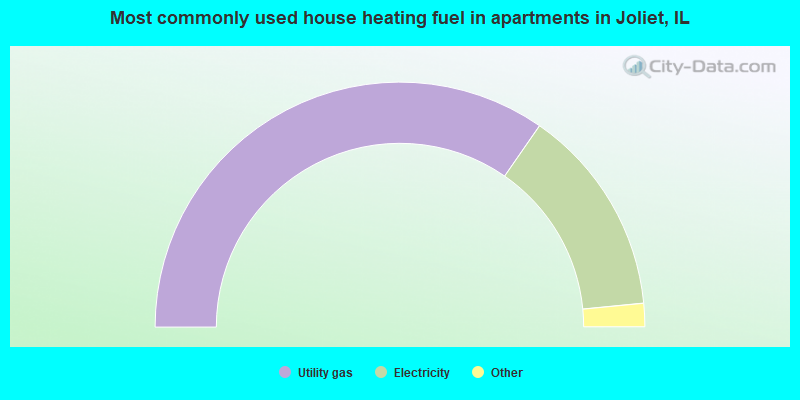
House heating fuel used in apartments - Utility gas (%)
House heating fuel used in apartments - Bottled, tank, or LP gas (%)
House heating fuel used in apartments - Electricity (%)
House heating fuel used in apartments - Fuel oil, kerosene, etc. (%)
House heating fuel used in apartments - Coal or coke (%)
House heating fuel used in apartments - Wood (%)
House heating fuel used in apartments - Solar energy (%)
House heating fuel used in apartments - Other fuel (%)
House heating fuel used in apartments - No fuel used (%)
Latest news about housing in Joliet, IL collected exclusively by city-data.com from local newspapers, TV, and radio stations
Median year house/condo built: 1993Median year apartment built: 1965Household type by relationship:
Households: 147,696
Male householders: 22,497 (5,628 living alone ), Female householders: 25,820 (5,547 living alone )23,913 spouses (23,778 opposite-sex spouses ), 4,735 unmarried partners , (4,691 opposite-sex unmarried partners ), 55,540 children (52,143 natural , 560 adopted , 2,837 stepchildren ), 2,376 grandchildren , 1,659 brothers or sisters , 2,345 parents , 48 foster children , 2,270 other relatives , 3,646 non-relatives In group quarters: 2,847
Size of family households: 9,326 2-persons , 8,504 3-persons , 8,690 4-persons , 4,314 5-persons , 1,944 6-persons , 1,551 7-or-more-persons .
Size of nonfamily households: 11,175 1-person , 2,486 2-persons , 180 3-persons , 147 4-persons .
25,857 married couples with children. single-parent households (2,646 men , 7,075 women ).
69.3% of residents of Joliet speak English at home. of residents speak Spanish at home (57% speak English very well , 22% speak English well , 14% speak English not well , 7% don't speak English at all ).of residents speak other Indo-European language at home (71% speak English very well , 22% speak English well , 5% speak English not well , 2% don't speak English at all ).of residents speak Asian or Pacific Island language at home (71% speak English very well , 17% speak English well , 9% speak English not well , 3% don't speak English at all ).of residents speak other language at home (76% speak English very well , 22% speak English well , 2% speak English not well , 1% don't speak English at all ).
Foreign born population: 22,247 (15.1%)of them are naturalized citizens )
Median number of rooms in houses and condos:
Median number of rooms in apartments
Owner-occupied Renter-occupied
Bedrooms in owner-occupied houses and condos in Joliet, Illinois
223 no bedroom 453 1 bedroom 5,800 2 bedrooms 17,353 3 bedrooms 10,427 4 bedrooms 3,312 5+ bedrooms
Bedrooms in renter-occupied apartments in Joliet, Illinois
1,215 no bedroom 1,807 1 bedroom 4,560 2 bedrooms 2,516 3 bedrooms 651 4 bedrooms 0 5+ bedrooms
Owner-occupied Renter-occupied
Rooms in owner-occupied houses in Joliet, Illinois
109 1 room 410 2 rooms 392 3 rooms 3,080 4 rooms 7,174 5 rooms 6,969 6 rooms 5,451 7 rooms 5,357 8 rooms 8,626 9+ rooms
Rooms in renter-occupied apartments in Joliet, Illinois
1,152 1 room 498 2 rooms 1,247 3 rooms 3,086 4 rooms 1,898 5 rooms 1,386 6 rooms 932 7 rooms 375 8 rooms 175 9+ rooms
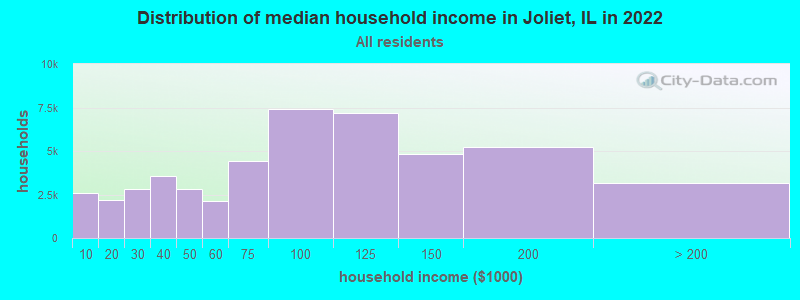
Joliet, IL household income distribution 2,599 Less than $10,0002,200 $10,000 to $19,9992,807 $20,000 to $29,9993,574 $30,000 to $39,9992,808 $40,000 to $49,9992,152 $50,000 to $59,9994,402 $60,000 to $74,9997,399 $75,000 to $99,9997,210 $100,000 to $124,9994,823 $125,000 to $149,9995,207 $150,000 to $199,9993,136 $200,000 or more
Home value of owner - occupied houses in 2022 in Joliet, IL 587 Less than $10,000213 $15,000 to $19,999150 $20,000 to $24,999117 $25,000 to $29,99955 $30,000 to $34,99930 $35,000 to $39,999253 $50,000 to $59,99934 $60,000 to $69,999276 $70,000 to $79,999364 $80,000 to $89,999663 $90,000 to $99,9991,828 $100,000 to $124,9991,544 $125,000 to $149,9992,353 $150,000 to $174,9993,341 $175,000 to $199,9997,659 $200,000 to $249,9996,693 $250,000 to $299,9998,628 $300,000 to $399,9992,150 $400,000 to $499,999493 $500,000 to $749,999104 $750,000 to $999,99933 $1,000,000 to $1,499,999Rent paid by renters in 2022 in Joliet, IL 134 Less than $100256 $100 to $149237 $150 to $199408 $200 to $249264 $250 to $29990 $300 to $34986 $350 to $399206 $400 to $449191 $450 to $499247 $500 to $549269 $550 to $599470 $600 to $649391 $650 to $699509 $700 to $749127 $750 to $7991,303 $800 to $8991,407 $900 to $9993,339 $1,000 to $1,2491,552 $1,250 to $1,4991,495 $1,500 to $1,999345 $2,000 to $2,499136 $2,500 to $2,999441 No cash rent
Percentage of workers working in this county: 68.5%Number of people working at home: 6,206 (8.5% of all workers )
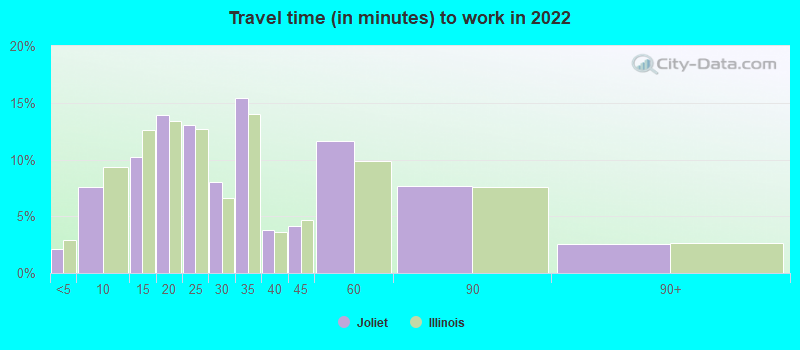
Travel time to work (commute)
Less than 5 minutes: 1,2745 to 9 minutes: 4,69910 to 14 minutes: 6,08315 to 19 minutes: 9,29620 to 24 minutes: 7,55825 to 29 minutes: 5,16730 to 34 minutes: 11,21735 to 39 minutes: 1,97440 to 44 minutes: 3,07545 to 59 minutes: 7,71160 to 89 minutes: 6,05290 or more minutes: 1,617
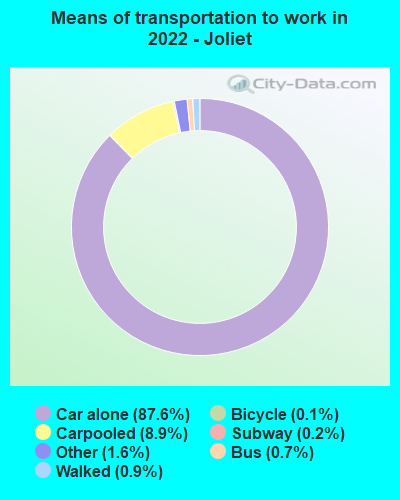
Means of transportation to work:
Drove a car alone: 54,105 (78.4%)Carpooled: 5,523 (8.0%)Bus : 313 (0.5%)Subway or elevated rail : 18 (0.0%)Long-distance train or commuter rail : 78 (0.1%)Ferryboat: 6 (0.0%)Taxi: 1,009 (1.5%)Bicycle: 105 (0.2%)Walked: 454 (0.7%)Worked at home: 6,206 (9.0%)
Unemployment by race in 2022
Unemployment rate for White non-Hispanic residents 2.6% Males4.8% FemalesUnemployment rate for Black residents 2.5% Males9.9% FemalesUnemployment rate for American Indian and Alaska Native residents 12.4% Males23.6% FemalesUnemployment rate for Asian residents 4.5% Males1.0% FemalesUnemployment rate for other race residents 4.2% Males4.0% FemalesUnemployment rate for two or more race residents 7.9% Males10.6% FemalesUnemployment rate for Hispanic or Latino residents 3.4% Males6.3% Females
Year of entry for the foreign-born population in Joliet, Illinois
5,877 2010 or later 6,287 2000 to 2009 6,039 1990 to 1999 2,634 1980 to 1989 2,048 1970 to 1979 1,398 Before 1970
First ancestries reported:
German: 3,526 (4.7%)
African: 3,236 (4.3%)
Polish: 2,771 (3.7%)
Irish: 2,691 (3.6%)
American: 2,406 (3.2%)
Italian: 2,159 (2.9%)
English: 1,242 (1.6%)
European: 935 (1.2%)
Lithuanian: 633 (0.8%)
Swedish: 342 (0.5%)
Dutch: 261 (0.3%)
Croatian: 246 (0.3%)
Romanian: 245 (0.3%)
Ukrainian: 240 (0.3%)
Nigerian: 227 (0.3%)
Slovene: 216 (0.3%)
Greek: 216 (0.3%)
Eastern European: 153 (0.2%)
Macedonian: 152 (0.2%)
Haitian: 152 (0.2%)
Ghanaian: 151 (0.2%)
Scottish: 151 (0.2%)
Norwegian: 150 (0.2%)
Slovak: 149 (0.2%)
Scotch-Irish: 119 (0.2%)
French: 112 (0.1%)
Czech: 109 (0.1%)
Slavic: 107 (0.1%)
Jamaican: 104 (0.1%)
Russian: 96 (0.1%)
Czechoslovakian: 93 (0.1%)
Yugoslavian: 79 (0.1%)
Syrian: 63 (0.08%)
Hungarian: 61 (0.08%)
Ethiopian: 57 (0.08%)
French Canadian: 53 (0.07%)
British: 53 (0.07%)
Lebanese: 50 (0.07%)
Danish: 46 (0.06%)
Northern European: 44 (0.06%)
Canadian: 42 (0.06%)
Serbian: 41 (0.05%)
Finnish: 37 (0.05%)
Austrian: 33 (0.04%)
Scandinavian: 26 (0.03%)
Swiss: 24 (0.03%)
Egyptian: 19 (0.03%)
West Indian: 15 (0.02%)
Armenian: 13 (0.02%)
Belgian: 10 (0.01%)
Trinidadian and Tobagonian: 9 (0.01%)
South African: 8 (0.01%)
Moroccan: 7 (0.01%)
Israeli: 7 (0.01%)
Most common places of birth for foreign-born residents (%): Mexico Joliet:
70.5% (15,573)Illinois:
34.7% (626,958)
Poland Joliet:
2.6% (566)Illinois:
6.9% (124,474)
Ghana Joliet:
2.4% (526)Illinois:
0.4% (7,043)
Philippines Joliet:
2.2% (478)Illinois:
5.2% (93,003)
Venezuela Joliet:
1.7% (373)Illinois:
0.5% (9,688)
Colombia Joliet:
1.7% (367)Illinois:
0.9% (16,553)
Place of birth for U.S.-born residents:
This state: 105,950Other state: 17,754Northeast: 1,147Midwest: 6,800South: 6,797West: 3,010 92.5% of Joliet residents lived in the same house 1 years ago.
Out of people who lived in different houses, 33.5% lived in this county.
Out of people who lived in different counties, 63.3% lived in Illinois.
Joliet:
92.5%State average:
88.3%
Education attainment for males 25 years and older:
No schooling: 1,671Nursery to 4th grade: 2975th and 6th grade: 1,2277th and 8th grade: 7249th grade: 66810th grade: 34811th grade: 71112th grade, no diploma: 1,373High school graduate (or equivalency): 15,358Less than 1 year of college: 3,140Some college more than 1 year, no degree: 5,629Associate degree: 4,807Bachelor's degree: 7,212Master's degree: 2,437Professional school degree: 323Doctorate degree: 64
Education attainment for females 25 years and older:
No schooling: 1,191Nursery to 4th grade: 3195th and 6th grade: 8717th and 8th grade: 7189th grade: 41010th grade: 63411th grade: 48612th grade, no diploma: 1,737High school graduate (or equivalency): 12,422Less than 1 year of college: 3,712Some college more than 1 year, no degree: 5,928Associate degree: 5,307Bachelor's degree: 8,502Master's degree: 3,783Professional school degree: 206Doctorate degree: 197
Housing units in structures:
One, detached: 37,246One, attached: 4,512Two: 1,7583 or 4: 2,0145 to 9: 71710 to 19: 1,82220 to 49: 74650 or more: 1,691Mobile homes: 443Median worth of mobile homes: $135,300
Housing units lacking complete plumbing facilities in 2022: 0.4%Housing units lacking complete kitchen facilities in 2022: 1.1%House/condo owner moved in on average 11 years ago
Renter moved in on average 3 years ago
Private vs. public school enrollment:
Students in private schools in grades 1 to 8 (elementary and middle school): 1,359 Students in private schools in grades 9 to 12 (high school): 519 Students in private undergraduate colleges: 1,435