Races in Joliet, Illinois (IL) Detailed Stats
Data:
Races - White alone (%)
Races - White alone (% change since 2000)
Races - Black alone (%)
Races - Black alone (% change since 2000)
Races - American Indian alone (%)
Races - American Indian alone (% change since 2000)
Races - Asian alone (%)
Races - Asian alone (% change since 2000)
Races - Hispanic (%)
Races - Hispanic (% change since 2000)
Races - Native Hawaiian and Other Pacific Islander alone (%)
Races - Native Hawaiian and Other Pacific Islander alone (% change since 2000)
Races - Two or more races(%)
Races - Two or more races(% change since 2000)
Races - Other race alone (%)
Races - Other race alone (% change since 2000)
Racial diversity
Place of birth - Born in state of residence (%)
Place of birth - Born in state of residence (%) - White
Place of birth - Born in state of residence (%) - Black or African American
Place of birth - Born in state of residence (%) - Asian
Place of birth - Born in state of residence (%) - Hispanic or Latino
Place of birth - Born in state of residence (%) - American Indian and Alaska Native
Place of birth - Born in state of residence (%) - Multirace
Place of birth - Born in state of residence (%) - Other Race
Place of birth - Born in other state (%)
Place of birth - Born in other state (%) - White
Place of birth - Born in other state (%) - Black or African American
Place of birth - Born in other state (%) - Asian
Place of birth - Born in other state (%) - Hispanic or Latino
Place of birth - Born in other state (%) - American Indian and Alaska Native
Place of birth - Born in other state (%) - Multirace
Place of birth - Born in other state (%) - Other Race
Place of birth - Native, outside of US (%)
Place of birth - Native, outside of US (%) - White
Place of birth - Native, outside of US (%) - Black or African American
Place of birth - Native, outside of US (%) - Asian
Place of birth - Native, outside of US (%) - Hispanic or Latino
Place of birth - Native, outside of US (%) - American Indian and Alaska Native
Place of birth - Native, outside of US (%) - Multirace
Place of birth - Native, outside of US (%) - Other Race
Place of birth - Foreign born (%)
Place of birth - Foreign born (%) - White
Place of birth - Foreign born (%) - Black or African American
Place of birth - Foreign born (%) - Asian
Place of birth - Foreign born (%) - Hispanic or Latino
Place of birth - Foreign born (%) - American Indian and Alaska Native
Place of birth - Foreign born (%) - Multirace
Place of birth - Foreign born (%) - Other Race
Residents speaking English at home (%)
Residents speaking English at home - Born in the United States (%)
Residents speaking English at home - Native, born elsewhere (%)
Residents speaking English at home - Foreign born (%)
Residents speaking Spanish at home (%)
Residents speaking Spanish at home - Born in the United States (%)
Residents speaking Spanish at home - Native, born elsewhere (%)
Residents speaking Spanish at home - Foreign born (%)
Residents speaking other language at home (%)
Residents speaking other language at home - Born in the United States (%)
Residents speaking other language at home - Native, born elsewhere (%)
Residents speaking other language at home - Foreign born (%)
Marital status - Never married (%)
Marital status - Now married (%)
Marital status - Separated (%)
Marital status - Widowed (%)
Marital status - Divorced (%)
Ancestries Reported - Arab (%)
Ancestries Reported - Czech (%)
Ancestries Reported - Danish (%)
Ancestries Reported - Dutch (%)
Ancestries Reported - English (%)
Ancestries Reported - French (%)
Ancestries Reported - French Canadian (%)
Ancestries Reported - German (%)
Ancestries Reported - Greek (%)
Ancestries Reported - Hungarian (%)
Ancestries Reported - Irish (%)
Ancestries Reported - Italian (%)
Ancestries Reported - Lithuanian (%)
Ancestries Reported - Norwegian (%)
Ancestries Reported - Polish (%)
Ancestries Reported - Portuguese (%)
Ancestries Reported - Russian (%)
Ancestries Reported - Scotch-Irish (%)
Ancestries Reported - Scottish (%)
Ancestries Reported - Slovak (%)
Ancestries Reported - Subsaharan African (%)
Ancestries Reported - Swedish (%)
Ancestries Reported - Swiss (%)
Ancestries Reported - Ukrainian (%)
Ancestries Reported - United States (%)
Ancestries Reported - Welsh (%)
Ancestries Reported - West Indian (%)
Ancestries Reported - Other (%)
Geographical mobility - Same house 1 year ago (%)
Geographical mobility - Same house 1 year ago (%) - White
Geographical mobility - Same house 1 year ago (%) - Black or African American
Geographical mobility - Same house 1 year ago (%) - Asian
Geographical mobility - Same house 1 year ago (%) - Hispanic or Latino
Geographical mobility - Same house 1 year ago (%) - American Indian and Alaska Native
Geographical mobility - Same house 1 year ago (%) - Multirace
Geographical mobility - Same house 1 year ago (%) - Other Race
Geographical mobility - Moved within same county (%)
Geographical mobility - Moved within same county (%) - White
Geographical mobility - Moved within same county (%) - Black or African American
Geographical mobility - Moved within same county (%) - Asian
Geographical mobility - Moved within same county (%) - Hispanic or Latino
Geographical mobility - Moved within same county (%) - American Indian and Alaska Native
Geographical mobility - Moved within same county (%) - Multirace
Geographical mobility - Moved within same county (%) - Other Race
Geographical mobility - Moved from different county within same state (%)
Geographical mobility - Moved from different county within same state (%) - White
Geographical mobility - Moved from different county within same state (%) - Black or African American
Geographical mobility - Moved from different county within same state (%) - Asian
Geographical mobility - Moved from different county within same state (%) - Hispanic or Latino
Geographical mobility - Moved from different county within same state (%) - American Indian and Alaska Native
Geographical mobility - Moved from different county within same state (%) - Multirace
Geographical mobility - Moved from different county within same state (%) - Other Race
Geographical mobility - Moved from different state (%)
Geographical mobility - Moved from different state (%) - White
Geographical mobility - Moved from different state (%) - Black or African American
Geographical mobility - Moved from different state (%) - Asian
Geographical mobility - Moved from different state (%) - Hispanic or Latino
Geographical mobility - Moved from different state (%) - American Indian and Alaska Native
Geographical mobility - Moved from different state (%) - Multirace
Geographical mobility - Moved from different state (%) - Other Race
Geographical mobility - Moved from abroad (%)
Geographical mobility - Moved from abroad (%) - White
Geographical mobility - Moved from abroad (%) - Black or African American
Geographical mobility - Moved from abroad (%) - Asian
Geographical mobility - Moved from abroad (%) - Hispanic or Latino
Geographical mobility - Moved from abroad (%) - American Indian and Alaska Native
Geographical mobility - Moved from abroad (%) - Multirace
Geographical mobility - Moved from abroad (%) - Other Race
Place of birth for the foreign-born population - Ireland (%)
Place of birth for the foreign-born population - Denmark (%)
Place of birth for the foreign-born population - Norway (%)
Place of birth for the foreign-born population - Sweden (%)
Place of birth for the foreign-born population - United Kingdom (%)
Place of birth for the foreign-born population - England (%)
Place of birth for the foreign-born population - Scotland (%)
Place of birth for the foreign-born population - Other Northern Europe (%)
Place of birth for the foreign-born population - Austria (%)
Place of birth for the foreign-born population - Belgium (%)
Place of birth for the foreign-born population - France (%)
Place of birth for the foreign-born population - Germany (%)
Place of birth for the foreign-born population - Netherlands (%)
Place of birth for the foreign-born population - Switzerland (%)
Place of birth for the foreign-born population - Other Western Europe (%)
Place of birth for the foreign-born population - Greece (%)
Place of birth for the foreign-born population - Italy (%)
Place of birth for the foreign-born population - Portugal (%)
Place of birth for the foreign-born population - Spain (%)
Place of birth for the foreign-born population - Other Southern Europe (%)
Place of birth for the foreign-born population - Albania (%)
Place of birth for the foreign-born population - Belarus (%)
Place of birth for the foreign-born population - Bosnia and Herzegovina (%)
Place of birth for the foreign-born population - Bulgaria (%)
Place of birth for the foreign-born population - Croatia (%)
Place of birth for the foreign-born population - Czechoslovakia (%)
Place of birth for the foreign-born population - Hungary (%)
Place of birth for the foreign-born population - Latvia (%)
Place of birth for the foreign-born population - Lithuania (%)
Place of birth for the foreign-born population - North Macedonia (Macedonia) (%)
Place of birth for the foreign-born population - Moldova (%)
Place of birth for the foreign-born population - Poland (%)
Place of birth for the foreign-born population - Romania (%)
Place of birth for the foreign-born population - Russia (%)
Place of birth for the foreign-born population - Serbia (%)
Place of birth for the foreign-born population - Ukraine (%)
Place of birth for the foreign-born population - Other Eastern Europe (%)
Place of birth for the foreign-born population - China (%)
Place of birth for the foreign-born population - Hong Kong (%)
Place of birth for the foreign-born population - Taiwan (%)
Place of birth for the foreign-born population - Japan (%)
Place of birth for the foreign-born population - Korea (%)
Place of birth for the foreign-born population - Other Eastern Asia (%)
Place of birth for the foreign-born population - Afghanistan (%)
Place of birth for the foreign-born population - Bangladesh (%)
Place of birth for the foreign-born population - India (%)
Place of birth for the foreign-born population - Iran (%)
Place of birth for the foreign-born population - Kazakhstan (%)
Place of birth for the foreign-born population - Nepal (%)
Place of birth for the foreign-born population - Pakistan (%)
Place of birth for the foreign-born population - Sri Lanka (%)
Place of birth for the foreign-born population - Uzbekistan (%)
Place of birth for the foreign-born population - Other South Central Asia (%)
Place of birth for the foreign-born population - Burma (%)
Place of birth for the foreign-born population - Cambodia (%)
Place of birth for the foreign-born population - Indonesia (%)
Place of birth for the foreign-born population - Laos (%)
Place of birth for the foreign-born population - Malaysia (%)
Place of birth for the foreign-born population - Philippines (%)
Place of birth for the foreign-born population - Singapore (%)
Place of birth for the foreign-born population - Thailand (%)
Place of birth for the foreign-born population - Vietnam (%)
Place of birth for the foreign-born population - Other South Eastern Asia (%)
Place of birth for the foreign-born population - Armenia (%)
Place of birth for the foreign-born population - Iraq (%)
Place of birth for the foreign-born population - Israel (%)
Place of birth for the foreign-born population - Jordan (%)
Place of birth for the foreign-born population - Kuwait (%)
Place of birth for the foreign-born population - Lebanon (%)
Place of birth for the foreign-born population - Saudi Arabia (%)
Place of birth for the foreign-born population - Syria (%)
Place of birth for the foreign-born population - Turkey (%)
Place of birth for the foreign-born population - Yemen (%)
Place of birth for the foreign-born population - Other Western Asia (%)
Place of birth for the foreign-born population - Eritrea (%)
Place of birth for the foreign-born population - Ethiopia (%)
Place of birth for the foreign-born population - Kenya (%)
Place of birth for the foreign-born population - Somalia (%)
Place of birth for the foreign-born population - Uganda (%)
Place of birth for the foreign-born population - Zimbabwe (%)
Place of birth for the foreign-born population - Other Eastern Africa (%)
Place of birth for the foreign-born population - Cameroon (%)
Place of birth for the foreign-born population - Congo (%)
Place of birth for the foreign-born population - Democratic Republic of Congo (Zaire) (%)
Place of birth for the foreign-born population - Other Middle Africa (%)
Place of birth for the foreign-born population - Egypt (%)
Place of birth for the foreign-born population - Morocco (%)
Place of birth for the foreign-born population - Sudan (%)
Place of birth for the foreign-born population - Other Northern Africa (%)
Place of birth for the foreign-born population - South Africa (%)
Place of birth for the foreign-born population - Other Southern Africa (%)
Place of birth for the foreign-born population - Cabo Verde (%)
Place of birth for the foreign-born population - Ghana (%)
Place of birth for the foreign-born population - Liberia (%)
Place of birth for the foreign-born population - Nigeria (%)
Place of birth for the foreign-born population - Senegal (%)
Place of birth for the foreign-born population - Sierra Leone (%)
Place of birth for the foreign-born population - Other Western Africa (%)
Place of birth for the foreign-born population - Australia (%)
Place of birth for the foreign-born population - New Zealand (%)
Place of birth for the foreign-born population - Fiji (%)
Place of birth for the foreign-born population - Micronesia (%)
Place of birth for the foreign-born population - Bahamas (%)
Place of birth for the foreign-born population - Barbados (%)
Place of birth for the foreign-born population - Cuba (%)
Place of birth for the foreign-born population - Dominica (%)
Place of birth for the foreign-born population - Dominican Republic (%)
Place of birth for the foreign-born population - Grenada (%)
Place of birth for the foreign-born population - Haiti (%)
Place of birth for the foreign-born population - Jamaica (%)
Place of birth for the foreign-born population - St. Vincent and the Grenadines (%)
Place of birth for the foreign-born population - Trinidad and Tobago (%)
Place of birth for the foreign-born population - West Indies (%)
Place of birth for the foreign-born population - Other Caribbean (%)
Place of birth for the foreign-born population - Belize (%)
Place of birth for the foreign-born population - Costa Rica (%)
Place of birth for the foreign-born population - El Salvador (%)
Place of birth for the foreign-born population - Guatemala (%)
Place of birth for the foreign-born population - Honduras (%)
Place of birth for the foreign-born population - Mexico (%)
Place of birth for the foreign-born population - Nicaragua (%)
Place of birth for the foreign-born population - Panama (%)
Place of birth for the foreign-born population - Other Central America (%)
Place of birth for the foreign-born population - Argentina (%)
Place of birth for the foreign-born population - Bolivia (%)
Place of birth for the foreign-born population - Brazil (%)
Place of birth for the foreign-born population - Chile (%)
Place of birth for the foreign-born population - Colombia (%)
Place of birth for the foreign-born population - Ecuador (%)
Place of birth for the foreign-born population - Guyana (%)
Place of birth for the foreign-born population - Peru (%)
Place of birth for the foreign-born population - Uruguay (%)
Place of birth for the foreign-born population - Venezuela (%)
Place of birth for the foreign-born population - Other South America (%)
Place of birth for the foreign-born population - Canada (%)
Place of birth for the foreign-born population - Other Northern America (%)
Place of birth for the foreign-born population - Other (%)
Latest news about races in Joliet, IL collected exclusively by city-data.com from local newspapers, TV, and radio stations
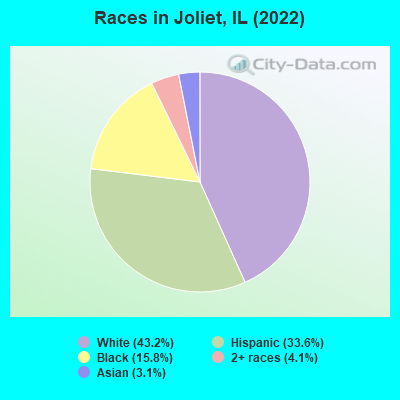
According to 2022 data, the most numerous races in Joliet, IL are White alone (63,738 residents), Hispanic (49,689 residents), and Black alone (23,347 residents). 70.3% of Joliet residents speak English at home. 14.7% of Joliet, IL residents are foreign-born (11.3% born in Latin America), which is 4.8% greater than the foreign-born rate of 14.0% across the entire state of Illinois.
Race distribution in Joliet
2000 2022
64,811 61.0% White alone 19,552 18.4% Hispanic 19,125 18.0% Black alone 1,267 1.2% Two or more races 1,190 1.1% Asian alone 103 0.10% Other race alone 159 0.1% American Indian alone 14 0.01% Native Hawaiian and Other
63,738 43.2% White alone 49,689 33.6% Hispanic 23,347 15.8% Black alone 6,034 4.1% Two or more races 4,623 3.1% Asian alone 144 0.10% Other race alone 121 0.08% American Indian alone
2000 2022
8,424,140 67.8% White alone 1,856,152 14.9% Black alone 1,530,262 12.3% Hispanic 419,916 3.4% Asian alone 153,996 1.2% Two or more races 13,479 0.1% Other race alone 18,232 0.1% American Indian alone 3,116 0.03% Native Hawaiian and Other
7,356,301 58.5% White alone 2,299,726 18.3% Hispanic 1,660,423 13.2% Black alone 747,296 5.9% Asian alone 458,599 3.6% Two or more races 45,386 0.4% Other race alone 10,405 0.08% American Indian alone 3,896 0.03% Native Hawaiian and Other
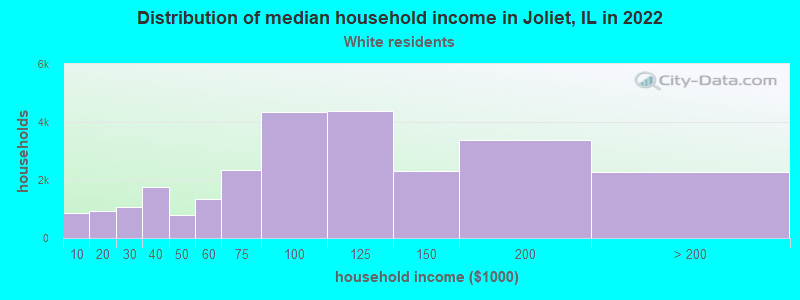
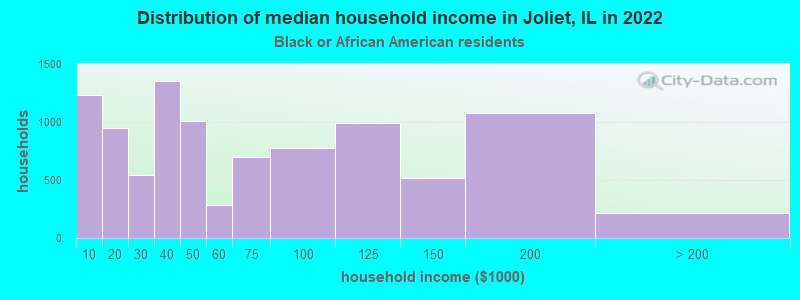
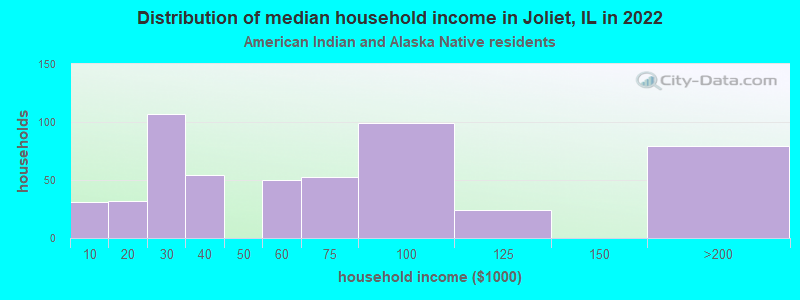
Income and house value in Joliet Median household income in 2022 $97,658 White non-Hispanic householders$42,265 Black householders$64,250 American Indian and Alaska Native householders$130,988 Asian householders$72,464 Some other race householders$103,394 Two or more races householders$81,676 Hispanic or Latino race householdersMedian 2022 house value $266,133 White Non-Hispanic householders$178,124 Black or African American householders$200,021 American Indian or Alaska Native householders $319,402 Asian householders$200,021 Native Hawaiian and other Pacific Islander householders$189,493 Some other race householders$232,656 Two or more races householders$186,756 Hispanic or Latino householders
Median age by race in Joliet
39.8 Median age for White residents37.9 41.9 36.1 Median age for Black or African American residents35.7 39.1 35.4 Median age for American Indian / Alaska Native residents36.0 35.3 35.5 Median age for Asian residents33.5 38.7 -666,666,666.0 Median age for Native Hawaiian / Pacific Islander residents-666,666,666.0 -666,666,666.0 28.8 Median age for Other race residents28.2 29.2 23.3 Median age for Two or more races residents23.3 23.3 41.0 Median age for White alone residents39.0 43.0 28.0 Median age for Hispanic or Latino residents26.8 29.5
Owner/renter occupied households by race in Joliet
House owners and renters - White residents 22,505 87.4% Owner occupied3,255 12.6% Renter occupiedHouse owners and renters - Black or African American residents 5,003 51.8% Owner occupied4,654 48.2% Renter occupiedHouse owners and renters - American Indian / Alaska Native residents 235 73.6% Owner occupied84 26.4% Renter occupiedHouse owners and renters - Asian residents 813 80.6% Owner occupied196 19.4% Renter occupiedHouse owners and renters - Native Hawaiian / Pacific Islander residents 33 100.0% Renter occupiedHouse owners and renters - Other race residents 4,453 76.8% Owner occupied1,346 23.2% Renter occupiedHouse owners and renters - Two or more races residents 4,522 78.1% Owner occupied1,268 21.9% Renter occupiedHouse owners and renters - White alone residents 21,411 88.1% Owner occupied2,894 11.9% Renter occupiedHouse owners and renters - Hispanic or Latino residents 9,092 77.6% Owner occupied2,632 22.4% Renter occupied
Language usage in Joliet
English speakers - Total 70.3% of residents of Joliet speak English at home.
23.8% of residents speak Spanish at home 19,803 60.0% Speak English very well13,224 40.0% Speak English less than very well6.0% of residents speak other language at home 5,945 71.7% Speak English very well2,342 28.3% Speak English less than very well
English speakers - Born in the United States 85.5% of residents of Joliet speak English at home.
9.9% of residents speak Spanish at home 1,289 76.1% Speak English very well405 23.9% Speak English less than very well4.6% of residents speak other language at home 784 100.0% Speak English very well
English speakers - Native, born elsewhere 41.0% of residents of Joliet speak English at home.
59.0% of residents speak Spanish at home 605 62.1% Speak English very well370 37.9% Speak English less than very well
English speakers - Foreign-born 8.1% of residents of Joliet speak English at home.
66.1% of residents speak Spanish at home 5,182 35.2% Speak English very well9,521 64.8% Speak English less than very well25.8% of residents speak other language at home 3,448 60.0% Speak English very well2,295 40.0% Speak English less than very well
White (Caucasian) - Speak only English Native:
94.2% (58,495)Foreign-born:
14.6% (603)
White (Caucasian) - Speak another language Native:
5.8% (3,591)Foreign-born:
85.4% (3,524)
Black or African American - Speak only English Native:
97.9% (22,155)Foreign-born:
13.5% (299)
Black or African American - Speak another language Native:
1.9% (427)Foreign-born:
95.1% (2,114)
American Indian / Alaska Native - Speak another language Native:
65.1% (490)Foreign-born:
100.0% (226)
Asian - Speak only English Native:
44.3% (880)Foreign-born:
16.0% (367)
Asian - Speak another language Native:
55.7% (1,106)Foreign-born:
84.0% (1,931)
Other race - Speak only English Native:
34.5% (5,248)Foreign-born:
3.3% (277)
Other race - Speak another language Native:
65.5% (9,968)Foreign-born:
96.7% (8,110)
Two or more races - Speak only English Native:
66.0% (10,653)Foreign-born:
7.2% (378)
Two or more races - Speak another language Native:
34.0% (5,487)Foreign-born:
92.8% (4,895)
White alone - Speak only English Native:
96.9% (55,633)Foreign-born:
20.0% (496)
White alone - Speak another language Native:
3.1% (1,802)Foreign-born:
80.0% (1,980)
Hispanic or Latino - Speak only English Native:
43.4% (13,395)Foreign-born:
4.7% (724)
Hispanic or Latino - Speak another language Native:
56.6% (17,476)Foreign-born:
95.3% (14,703)
Foreign-born residents in Joliet 22,086 residents are foreign born (11.3% Latin America ).
This city:
14.7%Illinois:
14.1%
Marital status for residents in Joliet Marital status - White (Caucasian) population 15 years and over
Males 38.3% Never married54.1% Now married0.2% Separated2.1% Widowed5.4% DivorcedFemales 27.7% Never married52.4% Now married1.3% Separated8.0% Widowed10.6% DivorcedWomen who gave birth in the past 12 months Now married:
73.5% (939)Unmarried:
26.5% (338)
Women who did not give birth in the past 12 months Now married:
47.2% (7,373)Unmarried:
52.8% (8,239)
Marital status - Black or African American population 15 years and over
Males 54.0% Never married28.9% Now married3.2% Separated0.2% Widowed13.8% DivorcedFemales 51.1% Never married30.5% Now married0.0% Separated6.0% Widowed12.4% DivorcedWomen who gave birth in the past 12 months Now married:
44.0% (150)Unmarried:
56.0% (191)
Women who did not give birth in the past 12 months Now married:
25.9% (1,835)Unmarried:
74.1% (5,239)
Marital status - American Indian / Alaska Native population 15 years and over
Males 51.6% Never married37.9% Now married5.2% Separated0.0% Widowed5.4% DivorcedFemales 47.9% Never married43.1% Now married0.0% Separated0.0% Widowed9.0% DivorcedWomen who gave birth in the past 12 months Now married:
43.2% (27)Unmarried:
56.8% (35)
Women who did not give birth in the past 12 months Now married:
41.7% (150)Unmarried:
58.3% (210)
Marital status - Asian population 15 years and over
Males 35.6% Never married51.1% Now married1.2% Separated1.5% Widowed10.5% DivorcedFemales 29.0% Never married52.4% Now married1.5% Separated7.0% Widowed10.1% DivorcedWomen who gave birth in the past 12 months Now married:
100.0% (5)Unmarried:
0.0% (0)
Women who did not give birth in the past 12 months Now married:
40.8% (291)Unmarried:
59.2% (423)
Marital status - Other race population 15 years and over
Males 46.1% Never married41.6% Now married6.6% Separated1.3% Widowed4.4% DivorcedFemales 49.4% Never married34.8% Now married2.5% Separated4.5% Widowed8.9% DivorcedWomen who gave birth in the past 12 months Now married:
37.6% (91)Unmarried:
62.4% (151)
Women who did not give birth in the past 12 months Now married:
36.1% (2,631)Unmarried:
63.9% (4,652)
Marital status - Two or more races population 15 years and over
Males 56.9% Never married35.9% Now married2.3% Separated2.0% Widowed3.0% DivorcedFemales 46.0% Never married43.8% Now married2.9% Separated2.2% Widowed5.1% DivorcedWomen who gave birth in the past 12 months Now married:
53.5% (216)Unmarried:
46.5% (188)
Women who did not give birth in the past 12 months Now married:
37.9% (2,118)Unmarried:
62.1% (3,474)
Marital status - White alone, not Hispanic / Latino population 15 years and over
Males 38.1% Never married53.7% Now married0.2% Separated2.1% Widowed5.9% DivorcedFemales 27.8% Never married52.0% Now married1.4% Separated7.5% Widowed11.3% DivorcedWomen who gave birth in the past 12 months Now married:
71.6% (852)Unmarried:
28.4% (338)
Women who did not give birth in the past 12 months Now married:
46.8% (6,776)Unmarried:
53.2% (7,715)
Marital status - Hispanic or Latino population 15 years and over
Males 48.1% Never married43.1% Now married4.2% Separated1.4% Widowed3.1% DivorcedFemales 43.5% Never married42.5% Now married2.6% Separated4.8% Widowed6.6% DivorcedWomen who gave birth in the past 12 months Now married:
56.3% (394)Unmarried:
43.7% (306)
Women who did not give birth in the past 12 months Now married:
40.5% (5,109)Unmarried:
59.5% (7,495)
Ancestries in Joliet
3,526 4.7% German3,236 4.3% African2,771 3.7% Polish2,691 3.6% Irish2,406 3.2% American2,159 2.9% Italian1,242 1.6% English935 1.2% European633 0.8% Lithuanian342 0.5% Swedish261 0.3% Dutch246 0.3% Croatian245 0.3% Romanian240 0.3% Ukrainian227 0.3% Nigerian216 0.3% Slovene216 0.3% Greek153 0.2% Eastern European152 0.2% Macedonian152 0.2% Haitian151 0.2% Ghanaian151 0.2% Scottish150 0.2% Norwegian149 0.2% Slovak119 0.2% Scotch-Irish112 0.1% French109 0.1% Czech107 0.1% Slavic104 0.1% Jamaican96 0.1% Russian93 0.1% Czechoslovakian79 0.1% Yugoslavian63 0.08% Syrian61 0.08% Hungarian57 0.08% Ethiopian53 0.07% French Canadian53 0.07% British50 0.07% Lebanese46 0.06% Danish44 0.06% Northern European42 0.06% Canadian41 0.05% Serbian37 0.05% Finnish33 0.04% Austrian26 0.03% Scandinavian24 0.03% Swiss19 0.03% Egyptian15 0.02% West Indian13 0.02% Armenian10 0.01% Belgian9 0.01% Trinidadian and Tobagonian8 0.01% South African7 0.01% Moroccan7 0.01% Israeli
Geographical mobility in Joliet Same house 1 year ago 64,884 93.0% White (Caucasian)21,248 90.5% Black or African American1,455 88.7% American Indian / Alaska Native3,278 98.3% Asian28 97.3% Native Hawaiian / Pacific Islander23,224 93.3% Other race19,195 91.6% Two or more races58,901 93.6% White alone, not Hispanic / Latino45,046 91.5% Hispanic or LatinoMoved within same county 2,477 3.6% White / Caucasian936 4.0% Black or African American76 4.6% American Indian / Alaska Native94 2.8% Asian951 3.8% Other race1,106 5.3% Two or more races2,061 3.3% White alone, not Hispanic / Latino2,037 4.1% Hispanic or LatinoMoved within same state 1,455 2.1% White / Caucasian521 2.2% Black or African American87 5.3% American Indian / Alaska Native6 0.2% Asian386 1.6% Other race648 3.1% Two or more races1,222 1.9% White alone, not Hispanic / Latino1,615 3.3% Hispanic or LatinoMoved from different state 806 1.2% White / Caucasian780 3.3% Black or African American23 1.4% American Indian / Alaska Native7 0.2% Asian1 3.7% Native Hawaiian / Pacific Islander195 0.8% Other race46 0.2% Two or more races670 1.1% White alone, not Hispanic / Latino331 0.7% Hispanic or LatinoMoved from abroad 151 0.2% White3 0.2% American Indian / Alaska Native17 0.5% Asian131 0.5% Other race37 0.2% Two or more races96 0.2% White alone, not Hispanic / Latino186 0.4% Hispanic or Latino
Children Nativity (place of birth) in Joliet
Children under 6 years - Living with two parents Both parents native 5,234 100.0% NativeBoth parents foreign-born 1,311 100.0% NativeOne native, one foreign-born parent 475 100.0% NativeChildren under 6 years - Living with one parent Native parent 2,638 100.0% NativeForeign-born parent 497 100.0% NativeChildren 6 to 17 years - Living with two parents Both parents native 11,667 100.0% NativeBoth parents foreign-born 3,747 82.6% Native790 17.4% Foreign-bornOne native, one foreign-born parent 2,633 100.0% NativeChildren 6 to 17 years - Living with one parent Native parent 6,913 100.0% NativeForeign-born parent 1,632 51.0% Native1,566 49.0% Foreign-born
Grandparents responsible for own grandchildren in Joliet
Grandparents (30 to 59 years) White / Caucasian 231 32.5% Responsible for grandchildren479 67.5% Not responsible for grandchildrenBlack or African American 52 16.8% Responsible for grandchildren260 83.2% Not responsible for grandchildrenAsian 4 100.0% Responsible for grandchildrenOther race 119 49.1% Responsible for grandchildren124 50.9% Not responsible for grandchildrenTwo or more races 20 5.8% Responsible for grandchildren328 94.2% Not responsible for grandchildrenWhite alone, not Hispanic / Latino 231 32.5% Responsible for grandchildren479 67.5% Not responsible for grandchildrenHispanic or Latino 88 20.6% Responsible for grandchildren339 79.4% Not responsible for grandchildrenGrandparents (60 years and over) White / Caucasian 439 58.9% Responsible for grandchildren306 41.1% Not responsible for grandchildrenBlack or African American 101 35.7% Responsible for grandchildren182 64.3% Not responsible for grandchildrenAsian 2 1.6% Responsible for grandchildren100 98.4% Not responsible for grandchildrenOther race 99 38.5% Responsible for grandchildren159 61.5% Not responsible for grandchildrenTwo or more races 40 12.3% Responsible for grandchildren281 87.7% Not responsible for grandchildrenWhite alone, not Hispanic / Latino 439 58.9% Responsible for grandchildren306 41.1% Not responsible for grandchildrenHispanic or Latino 162 23.6% Responsible for grandchildren524 76.4% Not responsible for grandchildren