Jackson, MS (Mississippi) Houses and Residents
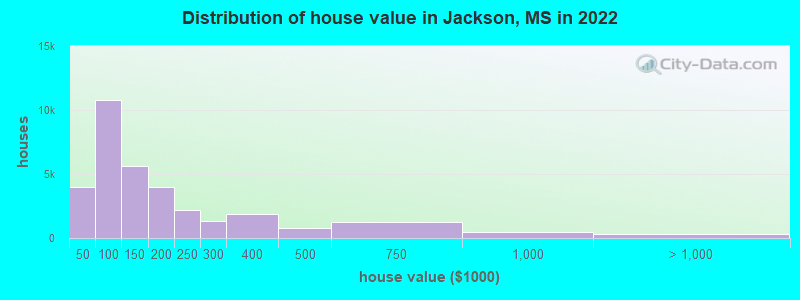
Estimated median house or condo value in 2022: $114,700 (it was $64,200 in 2000 )
Jackson:
$114,700Mississippi:
$162,500
Lower value quartile - upper value quartile: $71,000 - $209,400Mean price in 2022: Detached houses: $180,317 Here:
$180,317State:
$226,494
Townhouses or other attached units: $247,912 Here:
$247,912State:
$254,198
In 2-unit structures: $249,663 Here:
$249,663State:
$195,375
In 3-to-4-unit structures: $93,634 Here:
$93,634State:
$185,930
In 5-or-more-unit structures: $173,631 Here:
$173,631State:
$359,860
Mobile homes: $48,141 Here:
$48,141State:
$73,695
Total population: 171,155 (All urban)
Houses: 76,474 (62,149 occupied: 31,625 owner occupied, 30,524 renter occupied )
% of renters here:
49%State:
30%
Housing density: 729 houses/condos per square mile
Median price asked for vacant for-sale houses and condos in 2022: $18,156.
Median contract rent in 2022: $762 (lower quartile is $578, upper quartile is $928)
Median rent asked for vacant for-rent units in 2022: $832
Median gross rent in Jackson, MS in 2022: $979
Housing units in Jackson with a mortgage: 17,263 (1,395 second mortgage, 45 home equity loan, 968 both second mortgage and home equity loan )Houses without a mortgage: 385
Median household income for houses/condos with a mortgage: $66,296
Median household income for apartments without a mortgage: $46,369
Median monthly housing costs: $911
Data:
Median house or condo value ($)
Median house or condo value ($ change since 2000)
Median house or condo value ($) - White
Median house or condo value ($) - Black or African American
Median house or condo value ($) - Asian
Median house or condo value ($) - Hispanic or Latino
Median house or condo value ($) - American Indian and Alaska Native
Median house or condo value ($) - Multirace
Median house or condo value ($) - Other Race
Median price asked for mobile homes ($)
Household density (households per square mile)
Mean house or condo value by units in structure - 1, detached ($)
Mean house or condo value by units in structure - 1, attached ($)
Mean house or condo value by units in structure - 2 ($)
Mean house or condo value by units in structure by units in structure - 3 or 4 ($)
Mean house or condo value by units in structure - 5 or more ($)
Mean house or condo value by units in structure - Boat, RV, van, etc. ($)
Mean house or condo value by units in structure - Mobile home ($)
Median contract rent ($)
Median contract rent - Lower quartile ($)
Median contract rent - Upper quartile ($)
Median gross rent ($)
Urban houses (%)
Rural houses (%)
Houses occupied (%)
Houses occupied (% change since 2000)
Houses owner occupied (%)
Houses owner occupied (% change since 2000)
Houses renter occupied (%)
Houses renter occupied (% change since 2000)
Vacant housing units - For rent (%)
Vacant housing units - For rent (% change since 2000)
Vacant housing units - For sale only (%)
Vacant housing units - For sale only (% change since 2000)
Vacant housing units - Rented or sold, not occupied (%)
Vacant housing units - Rented or sold, not occupied (% change since 2000)
Vacant housing units - For seasonal, recreational, or occasional use (%)
Vacant housing units - For seasonal, recreational, or occasional use (% change since 2000)
Vacant housing units - For migrant workers (%)
Vacant housing units - For migrant workers (% change since 2000)
Vacant housing units - Other vacant (%)
Vacant housing units - Other vacant (% change since 2000)
Median monthly housing costs ($)
Median household income for houses/condos with a mortgage ($)
Median household income for houses/condos without a mortgage ($)
Median household income ($)
Median household income ($) - White
Median household income ($) - Black or African American
Median household income ($) - Asian
Median household income ($) - Hispanic or Latino
Median household income ($) - American Indian and Alaska Native
Median household income ($) - Multirace
Median household income ($) - Other Race
Mortgage status - with mortgage (%)
Mortgage status - with second mortgage (%)
Mortgage status - with home equity loan (%)
Mortgage status - with both second mortgage and home equity loan (%)
Mortgage status - without a mortgage (%)
Median year house/condo built
Median year apartment built
Household type by relationship - Male householder living alone (%)
Household type by relationship - Male householder not living alone (%)
Household type by relationship - Female householder living alone (%)
Household type by relationship - Female householder not living alone (%)
Household type by relationship - Opposite-Sex spouse (%)
Household type by relationship - Same-Sex spouse (%)
Household type by relationship - Opposite-Sex unmarried partner (%)
Household type by relationship - Same-Sex unmarried partner (%)
Household type by relationship - In group quarters (%)
Size of family households - 2-person household (%)
Size of family households - 3-person household (%)
Size of family households - 4-person household (%)
Size of family households - 5-person household (%)
Size of family households - 6-person household (%)
Size of family households - 7-or-more-person household (%)
Size of nonfamily households - 1-person household (%)
Size of nonfamily households - 2-person household (%)
Size of nonfamily households - 3-person household (%)
Size of nonfamily households - 4-person household (%)
Size of nonfamily households - 5-person household (%)
Size of nonfamily households - 6-person household (%)
Size of nonfamily households - 7-or-moreperson household (%)
Year house built - Built 2010 or later (%)
Year house built - Built 2000 to 2009 (%)
Year house built - Built 1990 to 1999 (%)
Year house built - Built 1980 to 1989 (%)
Year house built - Built 1970 to 1979 (%)
Year house built - Built 1960 to 1969 (%)
Year house built - Built 1950 to 1959 (%)
Year house built - Built 1940 to 1949 (%)
Year house built - Built 1939 or earlier (%)
Median number of rooms in houses and condos
Median number of rooms in apartments
Median number of bedrooms in owner occupied houses
Mean number of bedrooms in owner occupied houses
Median number of bedrooms in renter occupied houses
Mean number of bedrooms in renter occupied houses
Median number of vehichles in owner occupied houses
Mean number of vehichles in owner occupied houses
Median number of vehichles in renter occupied houses
Mean number of vehichles in renter occupied houses
Rooms in owner-occupied houses - 1 room (%)
Rooms in owner-occupied houses - 2 rooms (%)
Rooms in owner-occupied houses - 3 rooms (%)
Rooms in owner-occupied houses - 4 rooms (%)
Rooms in owner-occupied houses - 5 rooms (%)
Rooms in owner-occupied houses - 6 rooms (%)
Rooms in owner-occupied houses - 7 rooms (%)
Rooms in owner-occupied houses - 8 rooms (%)
Rooms in owner-occupied houses - 9+ rooms (%)
Rooms in renter-occupied houses - 1 room (%)
Rooms in renter-occupied houses - 2 rooms (%)
Rooms in renter-occupied houses - 3 rooms (%)
Rooms in renter-occupied houses - 4 rooms (%)
Rooms in renter-occupied houses - 5 rooms (%)
Rooms in renter-occupied houses - 6 rooms (%)
Rooms in renter-occupied houses - 7 rooms (%)
Rooms in renter-occupied houses - 8 rooms (%)
Rooms in renter-occupied houses - 9+ rooms (%)
Bedrooms in owner-occupied houses - no bedrooms (%)
Bedrooms in owner-occupied houses - 1 bedroom (%)
Bedrooms in owner-occupied houses - 2 bedrooms (%)
Bedrooms in owner-occupied houses - 3 bedrooms (%)
Bedrooms in owner-occupied houses - 4 bedrooms (%)
Bedrooms in owner-occupied houses - 5+ bedrooms (%)
Bedrooms in renter-occupied houses - no bedrooms (%)
Bedrooms in renter-occupied houses - 1 bedroom (%)
Bedrooms in renter-occupied houses - 2 bedrooms (%)
Bedrooms in renter-occupied houses - 3 bedrooms (%)
Bedrooms in renter-occupied houses - 4 bedrooms (%)
Bedrooms in renter-occupied houses - 5+ bedrooms (%)
Vehicles available in owner-occupied houses - no vehicle available (%)
Vehicles available in owner-occupied houses - 1 vehicle available(%)
Vehicles available in owner-occupied houses - 2 Vehicles available (%)
Vehicles available in owner-occupied houses - 3 Vehicles available (%)
Vehicles available in owner-occupied houses - 4 Vehicles available (%)
Vehicles available in owner-occupied houses - 5+ Vehicles available (%)
Vehicles available in renter-occupied houses - no vehicle available (%)
Vehicles available in renter-occupied houses - 1 vehicle available (%)
Vehicles available in renter-occupied houses - 2 Vehicles available (%)
Vehicles available in renter-occupied houses - 3 Vehicles available (%)
Vehicles available in renter-occupied houses - 4 Vehicles available (%)
Vehicles available in renter-occupied houses - 5+ Vehicles available (%)
Housing units in structures - 1, detached (%)
Housing units in structures - 1, attached (%)
Housing units in structures - 2 (%)
Housing units in structures - 3 or 4 (%)
Housing units in structures - 5 to 9 (%)
Housing units in structures - 10 to 19 (%)
Housing units in structures - 20 to 49 (%)
Housing units in structures - 50 or more (%)
Housing units in structures - Mobile home (%)
Housing units in structures - Boat, RV, van, etc. (%)
Housing units in structures - Owners - 1, detached (%)
Housing units in structures - Owners - 1, attached (%)
Housing units in structures - Owners - 2 (%)
Housing units in structures - Owners - 3 or 4 (%)
Housing units in structures - Owners - 5 to 9 (%)
Housing units in structures - Owners - 10 to 19 (%)
Housing units in structures - Owners - 20 to 49 (%)
Housing units in structures - Owners - 50 or more (%)
Housing units in structures - Owners - Mobile home (%)
Housing units in structures - Owners - Boat, RV, van, etc. (%)
Housing units in structures - Renters - 1, detached (%)
Housing units in structures - Renters - 1, attached (%)
Housing units in structures - Renters - 2 (%)
Housing units in structures - Renters - 3 or 4 (%)
Housing units in structures - Renters - 5 to 9 (%)
Housing units in structures - Renters - 10 to 19 (%)
Housing units in structures - Renters - 20 to 49 (%)
Housing units in structures - Renters - 50 or more (%)
Housing units in structures - Renters - Mobile home (%)
Housing units in structures - Renters - Boat, RV, van, etc. (%)
House/condo owner moved in on average (years ago)
Renter moved in on average (years ago)
Year householder moved into unit - Moved in 1999 to March 2000 (%)
Year householder moved into unit - Moved in 1999 to March 2000 (%) - White
Year householder moved into unit - Moved in 1999 to March 2000 (%) - Black or African American
Year householder moved into unit - Moved in 1999 to March 2000 (%) - Asian
Year householder moved into unit - Moved in 1999 to March 2000 (%) - Hispanic or Latino
Year householder moved into unit - Moved in 1999 to March 2000 (%) - American Indian and Alaska Native
Year householder moved into unit - Moved in 1999 to March 2000 (%) - Multirace
Year householder moved into unit - Moved in 1999 to March 2000 (%) - Other Race
Year householder moved into unit - Moved in 1995 to 1998 (%)
Year householder moved into unit - Moved in 1995 to 1998 (%) - White
Year householder moved into unit - Moved in 1995 to 1998 (%) - Black or African American
Year householder moved into unit - Moved in 1995 to 1998 (%) - Asian
Year householder moved into unit - Moved in 1995 to 1998 (%) - Hispanic or Latino
Year householder moved into unit - Moved in 1995 to 1998 (%) - American Indian and Alaska Native
Year householder moved into unit - Moved in 1995 to 1998 (%) - Multirace
Year householder moved into unit - Moved in 1995 to 1998 (%) - Other Race
Year householder moved into unit - Moved in 1990 to 1994 (%)
Year householder moved into unit - Moved in 1990 to 1994 (%) - White
Year householder moved into unit - Moved in 1990 to 1994 (%) - Black or African American
Year householder moved into unit - Moved in 1990 to 1994 (%) - Asian
Year householder moved into unit - Moved in 1990 to 1994 (%) - Hispanic or Latino
Year householder moved into unit - Moved in 1990 to 1994 (%) - American Indian and Alaska Native
Year householder moved into unit - Moved in 1990 to 1994 (%) - Multirace
Year householder moved into unit - Moved in 1990 to 1994 (%) - Other Race
Year householder moved into unit - Moved in 1980 to 1989 (%)
Year householder moved into unit - Moved in 1980 to 1989 (%) - White
Year householder moved into unit - Moved in 1980 to 1989 (%) - Black or African American
Year householder moved into unit - Moved in 1980 to 1989 (%) - Asian
Year householder moved into unit - Moved in 1980 to 1989 (%) - Hispanic or Latino
Year householder moved into unit - Moved in 1980 to 1989 (%) - American Indian and Alaska Native
Year householder moved into unit - Moved in 1980 to 1989 (%) - Multirace
Year householder moved into unit - Moved in 1980 to 1989 (%) - Other Race
Year householder moved into unit - Moved in 1970 to 1979 (%)
Year householder moved into unit - Moved in 1970 to 1979 (%) - White
Year householder moved into unit - Moved in 1970 to 1979 (%) - Black or African American
Year householder moved into unit - Moved in 1970 to 1979 (%) - Asian
Year householder moved into unit - Moved in 1970 to 1979 (%) - Hispanic or Latino
Year householder moved into unit - Moved in 1970 to 1979 (%) - American Indian and Alaska Native
Year householder moved into unit - Moved in 1970 to 1979 (%) - Multirace
Year householder moved into unit - Moved in 1970 to 1979 (%) - Other Race
Year householder moved into unit - Moved in 1969 or earlier (%)
Year householder moved into unit - Moved in 1969 or earlier (%) - White
Year householder moved into unit - Moved in 1969 or earlier (%) - Black or African American
Year householder moved into unit - Moved in 1969 or earlier (%) - Asian
Year householder moved into unit - Moved in 1969 or earlier (%) - Hispanic or Latino
Year householder moved into unit - Moved in 1969 or earlier (%) - American Indian and Alaska Native
Year householder moved into unit - Moved in 1969 or earlier (%) - Multirace
Year householder moved into unit - Moved in 1969 or earlier (%) - Other Race
Housing units lacking complete plumbing facilities (%)
Housing units lacking complete kitchen facilities (%)
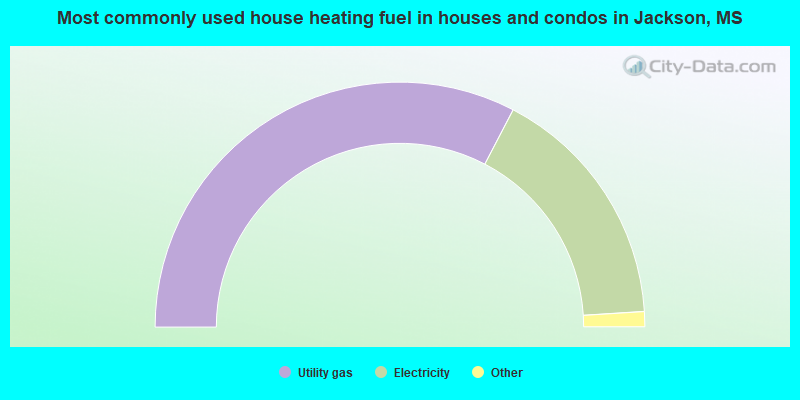
House heating fuel used in houses and condos - Utility gas (%)
House heating fuel used in houses and condos - Bottled, tank, or LP gas (%)
House heating fuel used in houses and condos - Electricity (%)
House heating fuel used in houses and condos - Fuel oil, kerosene, etc. (%)
House heating fuel used in houses and condos - Coal or coke (%)
House heating fuel used in houses and condos - Wood (%)
House heating fuel used in houses and condos - Solar energy (%)
House heating fuel used in houses and condos - Other fuel (%)
House heating fuel used in houses and condos - No fuel used (%)
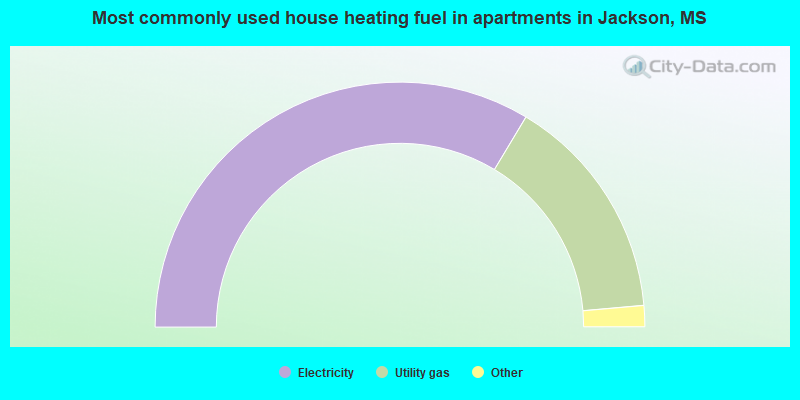
House heating fuel used in apartments - Utility gas (%)
House heating fuel used in apartments - Bottled, tank, or LP gas (%)
House heating fuel used in apartments - Electricity (%)
House heating fuel used in apartments - Fuel oil, kerosene, etc. (%)
House heating fuel used in apartments - Coal or coke (%)
House heating fuel used in apartments - Wood (%)
House heating fuel used in apartments - Solar energy (%)
House heating fuel used in apartments - Other fuel (%)
House heating fuel used in apartments - No fuel used (%)
Latest news about housing in Jackson, MS collected exclusively by city-data.com from local newspapers, TV, and radio stations
Median year house/condo built: 1971Median year apartment built: 1971Household type by relationship:
Households: 146,019
Male householders: 25,288 (10,896 living alone ), Female householders: 36,861 (14,213 living alone )15,837 spouses (15,787 opposite-sex spouses ), 3,890 unmarried partners , (3,745 opposite-sex unmarried partners ), 44,637 children (41,607 natural , 1,467 adopted , 1,563 stepchildren ), 5,271 grandchildren , 2,178 brothers or sisters , 1,111 parents , 53 foster children , 2,289 other relatives , 3,113 non-relatives In group quarters: 5,491
Size of family households: 15,484 2-persons , 7,503 3-persons , 5,312 4-persons , 4,062 5-persons , 745 6-persons , 316 7-or-more-persons .
Size of nonfamily households: 25,109 1-person , 3,272 2-persons , 196 3-persons , 150 4-persons .
10,982 married couples with children. single-parent households (3,124 men , 16,305 women ).
97.0% of residents of Jackson speak English at home. of residents speak Spanish at home (63% speak English very well , 17% speak English well , 18% speak English not well , 2% don't speak English at all ).of residents speak other Indo-European language at home (78% speak English very well , 12% speak English well , 10% speak English not well ).of residents speak Asian or Pacific Island language at home (77% speak English very well , 12% speak English well , 11% speak English not well ).of residents speak other language at home (94% speak English very well , 4% speak English well , 2% don't speak English at all ).
Foreign born population: 2,232 (1.5%)of them are naturalized citizens )
Median number of rooms in houses and condos:
Median number of rooms in apartments
Owner-occupied Renter-occupied
Bedrooms in owner-occupied houses and condos in Jackson, Mississippi
120 no bedroom 359 1 bedroom 4,136 2 bedrooms 18,711 3 bedrooms 7,070 4 bedrooms 1,229 5+ bedrooms
Bedrooms in renter-occupied apartments in Jackson, Mississippi
364 no bedroom 6,493 1 bedroom 9,039 2 bedrooms 12,214 3 bedrooms 2,196 4 bedrooms 218 5+ bedrooms
Owner-occupied Renter-occupied
Rooms in owner-occupied houses in Jackson, Mississippi
120 1 room 0 2 rooms 310 3 rooms 2,685 4 rooms 4,606 5 rooms 7,197 6 rooms 6,422 7 rooms 5,004 8 rooms 5,281 9+ rooms
Rooms in renter-occupied apartments in Jackson, Mississippi
364 1 room 943 2 rooms 5,147 3 rooms 6,918 4 rooms 8,057 5 rooms 4,763 6 rooms 2,166 7 rooms 1,200 8 rooms 966 9+ rooms
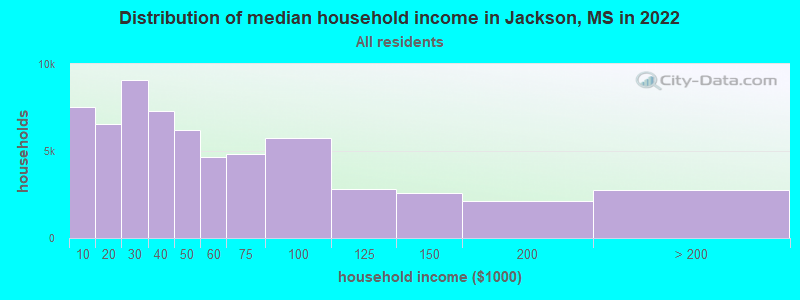
Jackson, MS household income distribution 7,545 Less than $10,0006,568 $10,000 to $19,9999,056 $20,000 to $29,9997,286 $30,000 to $39,9996,183 $40,000 to $49,9994,649 $50,000 to $59,9994,816 $60,000 to $74,9995,733 $75,000 to $99,9992,797 $100,000 to $124,9992,588 $125,000 to $149,9992,146 $150,000 to $199,9992,782 $200,000 or more
Home value of owner - occupied houses in 2022 in Jackson, MS 490 Less than $10,000577 $10,000 to $14,999367 $15,000 to $19,999279 $20,000 to $24,99930 $25,000 to $29,999598 $30,000 to $34,999554 $35,000 to $39,9991,125 $40,000 to $49,9991,409 $50,000 to $59,9992,304 $60,000 to $69,9991,791 $70,000 to $79,9993,236 $80,000 to $89,999895 $90,000 to $99,9993,675 $100,000 to $124,9991,988 $125,000 to $149,9992,368 $150,000 to $174,9991,629 $175,000 to $199,9992,157 $200,000 to $249,9991,349 $250,000 to $299,9991,900 $300,000 to $399,999800 $400,000 to $499,9991,272 $500,000 to $749,999506 $750,000 to $999,99950 $1,000,000 to $1,499,999276 $2,000,000 or moreRent paid by renters in 2022 in Jackson, MS 218 Less than $100342 $100 to $149763 $150 to $199320 $200 to $249803 $250 to $299228 $300 to $349832 $350 to $399890 $400 to $449909 $450 to $499566 $500 to $5491,818 $550 to $5992,253 $600 to $6491,246 $650 to $6991,601 $700 to $7494,093 $750 to $7992,681 $800 to $8994,123 $900 to $9992,646 $1,000 to $1,249887 $1,250 to $1,499344 $1,500 to $1,99940 $2,000 to $2,4992,921 No cash rent
Percentage of workers working in this county: 69.7%Number of people working at home: 5,028 (8.0% of all workers )
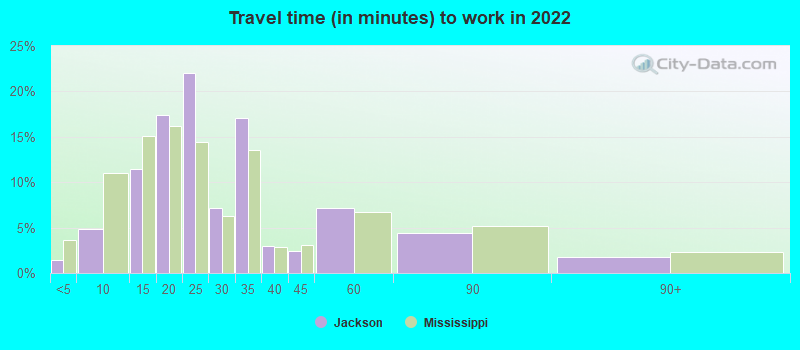
Travel time to work (commute)
Less than 5 minutes: 1,1705 to 9 minutes: 3,82610 to 14 minutes: 9,75315 to 19 minutes: 11,93920 to 24 minutes: 14,57325 to 29 minutes: 4,45830 to 34 minutes: 6,25235 to 39 minutes: 1,45940 to 44 minutes: 9145 to 59 minutes: 1,64560 to 89 minutes: 60790 or more minutes: 463
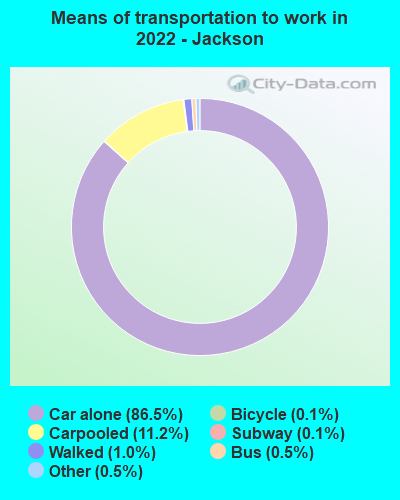
Means of transportation to work:
Drove a car alone: 79,472 (81.7%)Carpooled: 10,424 (10.7%)Bus : 351 (0.4%)Long-distance train or commuter rail : 137 (0.1%)Taxi: 499 (0.5%)Bicycle: 128 (0.1%)Walked: 916 (0.9%)Worked at home: 5,028 (5.2%)
Unemployment by race in 2022
Unemployment rate for White non-Hispanic residents 1.4% Males1.6% FemalesUnemployment rate for Black residents 5.7% Males9.6% FemalesUnemployment rate for other race residents 37.0% FemalesUnemployment rate for two or more race residents 6.0% Males33.5% FemalesUnemployment rate for Hispanic or Latino residents 8.9% Females
Year of entry for the foreign-born population in Jackson, Mississippi
1,298 2010 or later 324 2000 to 2009 254 1990 to 1999 414 1980 to 1989 218 1970 to 1979 375 Before 1970
First ancestries reported:
English: 2,594 (2.2%)
American: 2,366 (2.0%)
African: 1,794 (1.5%)
Irish: 1,401 (1.2%)
European: 1,275 (1.1%)
German: 807 (0.7%)
Scotch-Irish: 632 (0.5%)
Scottish: 369 (0.3%)
Nigerian: 286 (0.2%)
Italian: 256 (0.2%)
Israeli: 223 (0.2%)
British: 221 (0.2%)
Polish: 166 (0.1%)
French: 127 (0.1%)
Dutch: 112 (0.09%)
Jamaican: 74 (0.06%)
Lebanese: 63 (0.05%)
Ethiopian: 63 (0.05%)
Greek: 58 (0.05%)
French Canadian: 53 (0.04%)
Iranian: 52 (0.04%)
Egyptian: 45 (0.04%)
Scandinavian: 45 (0.04%)
Northern European: 43 (0.04%)
Haitian: 42 (0.04%)
Norwegian: 41 (0.03%)
Moroccan: 37 (0.03%)
Welsh: 27 (0.02%)
Swiss: 26 (0.02%)
Portuguese: 23 (0.02%)
Danish: 18 (0.02%)
Slovak: 17 (0.01%)
Cajun: 15 (0.01%)
Ukrainian: 12 (0.01%)
Serbian: 9 (0.01%)
Czech: 8 (0.01%)
Canadian: 8 (0.01%)
Belgian: 7 (0.01%)
Albanian: 7 (0.01%)
Bulgarian: 6 (0.01%) Most common places of birth for foreign-born residents (%): Mexico Jackson:
29.4% (624)Mississippi:
25.4% (17,354)
Honduras Jackson:
19.5% (413)Mississippi:
5.1% (3,475)
India Jackson:
7.0% (148)Mississippi:
6.3% (4,325)
Poland Jackson:
4.2% (88)Mississippi:
0.3% (189)
Nigeria Jackson:
4.1% (87)Mississippi:
1.1% (718)
China, excluding Hong Kong and Taiwan Jackson:
3.5% (75)Mississippi:
4.3% (2,948)
Jamaica Jackson:
3.1% (65)Mississippi:
1.3% (899)
Philippines Jackson:
2.9% (62)Mississippi:
4.7% (3,211)
Ethiopia Jackson:
2.9% (61)Mississippi:
0.5% (314)
Haiti Jackson:
2.0% (42)Mississippi:
0.6% (385)
Guatemala Jackson:
1.8% (38)Mississippi:
5.5% (3,723)
Cuba Jackson:
1.7% (37)Mississippi:
1.3% (879)
South Africa Jackson:
1.7% (35)Mississippi:
0.7% (496)
Spain Jackson:
1.6% (33)Mississippi:
0.4% (258)
Vietnam Jackson:
1.6% (33)Mississippi:
5.8% (3,948)
Lebanon Jackson:
1.5% (32)Mississippi:
0.1% (44)
Place of birth for U.S.-born residents:
This state: 119,859Other state: 23,349Northeast: 1,532Midwest: 8,045South: 11,810West: 1,962 82.2% of Jackson residents lived in the same house 1 years ago.
Out of people who lived in different houses, 41.4% lived in this county.
Out of people who lived in different counties, 51.6% lived in Mississippi.
Jackson:
82.2%State average:
88.9%
Education attainment for males 25 years and older:
No schooling: 864Nursery to 4th grade: 05th and 6th grade: 3847th and 8th grade: 8369th grade: 1,28810th grade: 1,22511th grade: 1,32212th grade, no diploma: 880High school graduate (or equivalency): 12,429Less than 1 year of college: 2,151Some college more than 1 year, no degree: 7,107Associate degree: 2,530Bachelor's degree: 5,989Master's degree: 2,231Professional school degree: 1,432Doctorate degree: 1,271
Education attainment for females 25 years and older:
No schooling: 466Nursery to 4th grade: 235th and 6th grade: 487th and 8th grade: 7609th grade: 48410th grade: 49411th grade: 1,10512th grade, no diploma: 289High school graduate (or equivalency): 12,361Less than 1 year of college: 2,645Some college more than 1 year, no degree: 11,000Associate degree: 5,158Bachelor's degree: 10,696Master's degree: 5,372Professional school degree: 1,333Doctorate degree: 363
Housing units in structures:
One, detached: 50,517One, attached: 1,841Two: 2,9633 or 4: 3,6035 to 9: 6,90810 to 19: 4,15320 to 49: 2,35250 or more: 2,640Mobile homes: 1,497Median worth of mobile homes: $38,873
Housing units lacking complete plumbing facilities in 2022: 8.7%Housing units lacking complete kitchen facilities in 2022: 6.8%House/condo owner moved in on average 18 years ago
Renter moved in on average 2 years ago
Private vs. public school enrollment:
Students in private schools in grades 1 to 8 (elementary and middle school): 1,326 Here:
7.9%Mississippi:
16.1%
Students in private schools in grades 9 to 12 (high school): 1,603 Here:
20.6%Mississippi:
14.6%
Students in private undergraduate colleges: 1,798 Here:
18.8%Mississippi:
12.8%