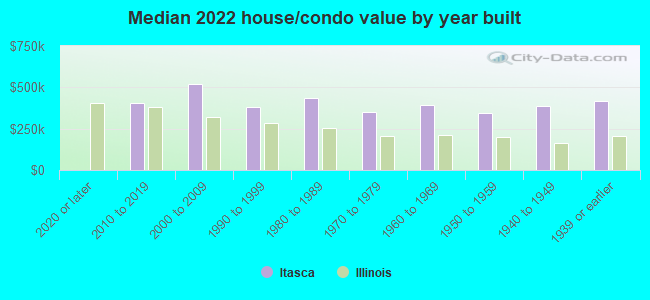
Itasca, IL (Illinois) Houses and Residents
| Itasca: | $383,059 |
| Illinois: | $251,600 |
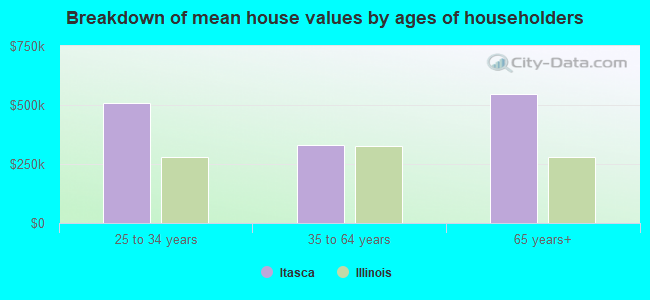
Mean price in 2022:
Detached houses: $450,369
Here: $450,369 State: $310,164 Townhouses or other attached units: $585,352
Here: $585,352 State: $286,230 In 3-to-4-unit structures: $224,018
Here: $224,018 State: $330,907 In 5-or-more-unit structures: $239,387
Here: $239,387 State: $318,887
Total population: 8,800 (Urban population: 8,267, Rural population: 0)
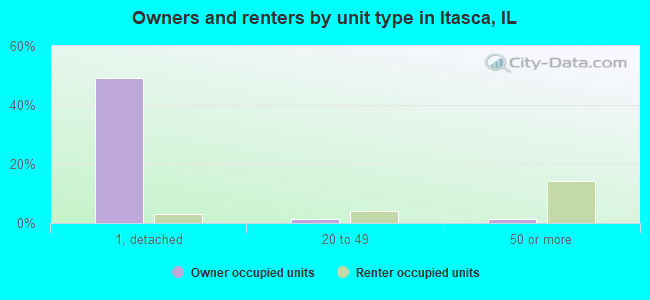
Houses: 4,182 (3,860 occupied: 2,743 owner occupied, 1,120 renter occupied)
| % of renters here: | 29% |
| State: | 33% |
Housing density: 851 houses/condos per square mile
Median price asked for vacant for-sale houses and condos in 2022: $830,851.
Median contract rent in 2022: $1,464 (lower quartile is $1,262, upper quartile is over $2,000)
Median rent asked for vacant for-rent units in 2022: $2,043
Median gross rent in Itasca, IL in 2022: $1,609
Housing units in Itasca with a mortgage: 1,894 (321 second mortgage, 0 home equity loan, 261 both second mortgage and home equity loan)
Houses without a mortgage: 16
Median household income for houses/condos with a mortgage: $134,234
Median household income for apartments without a mortgage: $90,785
Median monthly housing costs: $1,805
Compare current foreclosures near Itasca, IL:
| Photo | Address | Area | Beds / Baths | Price | Details |
|---|---|---|---|---|---|

|
#1
Irving Park Rd
Itasca, IL 60143
|
1,250 sq. feet
|
- baths - beds |
show details | |

|
#2
W George St
Itasca, IL 60143
|
1,292 sq. feet
|
- baths - beds |
show details | |

|
#3
Bay Dr
Itasca, IL 60143
|
- sq. feet
|
- baths - beds |
show details | |

|
#4
Emmerson Ave
Itasca, IL 60143
|
1,170 sq. feet
|
- baths - beds |
show details | |

|
#5
Norwood Ave Apt 201
Itasca, IL 60143
|
- sq. feet
|
- baths - beds |
show details | |

|
#6
Norwood Ave Apt 105
Itasca, IL 60143
|
- sq. feet
|
- baths - beds |
show details | |

|
#7
Cherry St
Itasca, IL 60143
|
1,317 sq. feet
|
- baths - beds |
show details | |

|
#8
Hamilton Pkwy
Itasca, IL 60143
|
- sq. feet
|
- baths - beds |
show details | |

|
#9
Maple St
Itasca, IL 60143
|
- sq. feet
|
- baths - beds |
show details | |

|
#10
Hamilton Pkwy
Itasca, IL 60143
|
- sq. feet
|
- baths - beds |
show details |
| Photo | Address | Area | Beds / Baths | Price | Details |
|---|---|---|---|---|---|

|
#11
Bay Dr
Itasca, IL 60143
|
1,850 sq. feet
|
- baths - beds |
show details | |

|
#12
Bunker Ter
Itasca, IL 60143
|
- sq. feet
|
- baths - beds |
show details | |

|
#13
W North St
Itasca, IL 60143
|
- sq. feet
|
- baths - beds |
show details | |

|
#14
North Lane
Itasca, IL 60143
|
- sq. feet
|
- baths - beds |
show details | |

|
#15
Bunker Ter
Itasca, IL 60143
|
- sq. feet
|
- baths - beds |
show details | |

|
#16
Itasca Pl Unit 323
Itasca, IL 60143
|
- sq. feet
|
- baths - beds |
show details | |

|
#17
S Princeton Ave
Itasca, IL 60143
|
1,320 sq. feet
|
- baths - beds |
show details | |

|
#18
S Rush St Apt 1c
Itasca, IL 60143
|
- sq. feet
|
- baths - beds |
show details | |

|
#19
Tee Ln, Apt C
Itasca, IL 60143
|
- sq. feet
|
- baths - beds |
show details | |

|
#20
Carriage Way Dr
Arlington Heights, IL 60004
|
- sq. feet
|
2 baths 2 beds |
$179,900
|
show details |
| Photo | Address | Area | Beds / Baths | Price | Details |
|---|---|---|---|---|---|

|
#21
Webster Ln
Des Plaines, IL 60018
|
1,608 sq. feet
|
3 baths 3 beds |
$515,000
|
show details |

|
#22
N Francisco Ave
Chicago, IL 60659
|
1,100 sq. feet
|
1 baths 2 beds |
$159,000
|
show details |

|
#23
S Lyman Ave
Des Plaines, IL 60016
|
2,233 sq. feet
|
2 baths 4 beds |
$330,000
|
show details |

|
#24
S 13th Ave
Maywood, IL 60153
|
1,176 sq. feet
|
1 baths 3 beds |
$279,900
|
show details |

|
#25
N 4th Ave
Des Plaines, IL 60016
|
1,381 sq. feet
|
1 baths 3 beds |
$335,000
|
show details |

|
#26
Raymond Ave
Brookfield, IL 60513
|
1,020 sq. feet
|
1 baths 2 beds |
$219,900
|
show details |

|
#27
S Ridgeland Ave
Oak Park, IL 60302
|
2,400 sq. feet
|
3 baths 4 beds |
$625,000
|
show details |

|
#28
N Austin Ave
Chicago, IL 60634
|
2,500 sq. feet
|
3 baths 4 beds |
$365,000
|
show details |

|
#29
Newcastle Ave
Westchester, IL 60154
|
1,640 sq. feet
|
1 baths 2 beds |
$239,200
|
show details |

|
#30
N Olcott Ave
Chicago, IL 60634
|
2,161 sq. feet
|
2 baths 4 beds |
$559,000
|
show details |
| Photo | Address | Area | Beds / Baths | Price | Details |
|---|---|---|---|---|---|

|
#31
Briar Hill Dr
Schaumburg, IL 60194
|
1,600 sq. feet
|
2 baths 4 beds |
$410,400
|
show details |

|
#32
N 74th Ave
Elmwood Park, IL 60707
|
1,300 sq. feet
|
1 baths 3 beds |
$235,000
|
show details |

|
#33
Christiana Ave # 1
Skokie, IL 60076
|
1,400 sq. feet
|
1 baths 3 beds |
$319,000
|
show details |

|
#34
W Van Buren St
Chicago, IL 60644
|
2,839 sq. feet
|
3 baths 8 beds |
$87,500
|
show details |

|
#35
Wisconsin Ave
Barrington, IL 60010
|
1,297 sq. feet
|
2 baths 3 beds |
$489,900
|
show details |

|
#36
Main St
Skokie, IL 60076
|
1,428 sq. feet
|
1 baths 3 beds |
$455,000
|
show details |

|
#37
E Crest Ave
Addison, IL 60101
|
2,023 sq. feet
|
1 baths 5 beds |
$329,000
|
show details |

|
#38
Millers Xing
Itasca, IL 60143
|
- sq. feet
|
- baths - beds |
show details | |

|
#39
Harmony Ct
Itasca, IL 60143
|
- sq. feet
|
- baths - beds |
show details | |

|
#40
W Quincy St
Chicago, IL 60644
|
960 sq. feet
|
1 baths - beds |
$19,000
|
show details |
| Photo | Address | Area | Beds / Baths | Price | Details |
|---|---|---|---|---|---|

|
#41
Woods Dr Unit Unit 2004
Skokie, IL 60077
|
- sq. feet
|
2 baths 3 beds |
$572,000
|
show details |

|
#42
Washington Blvd Apt 1
Oak Park, IL 60302
|
- sq. feet
|
1 baths 2 beds |
$149,900
|
show details |

|
#43
Avenida Serra Test
Des Plaines, IL 60018
|
- sq. feet
|
2 baths 3 beds |
$100,000
|
show details |

|
#44
Lathrop Ave Apt 404
Forest Park, IL 60130
|
675 sq. feet
|
1 baths 1 beds |
show details | |

|
#45
W Corcoran Pl Apt 1
Chicago, IL 60644
|
- sq. feet
|
2 baths 3 beds |
$199,900
|
show details |

|
#46
Kirkland Lane
Villa Park, IL 60181
|
1,100 sq. feet
|
2 baths 3 beds |
show details | |

|
#47
Scarsdale Ct Unit C2
Schaumburg, IL 60193
|
950 sq. feet
|
1 baths 2 beds |
show details | |

|
#48
Hesterman Dr
Glendale Heights, IL 60139
|
1,263 sq. feet
|
2 baths 2 beds |
show details | |

|
#49
Elgin Ave
Forest Park, IL 60130
|
2,143 sq. feet
|
1 baths 3 beds |
show details | |

|
Check over 1 million property listings on Foreclosure.com!
|
browse all offers | |||

Latest news about housing in Itasca, IL collected exclusively by city-data.com from local newspapers, TV, and radio stations

 | Townhome or different suburb: ~$300k (13 replies) |
| Homesteading + supportive community (16 replies) |
| Itasca-area grandparent's-home search (2 replies) |
| Why are there so many houses for sale in Woodridge, IL? (13 replies) |
| Moving from Chicago- looking to make the suburbs home (10 replies) |
| Towns comparable to Hinsdale and commutable to Itasca? (57 replies) |
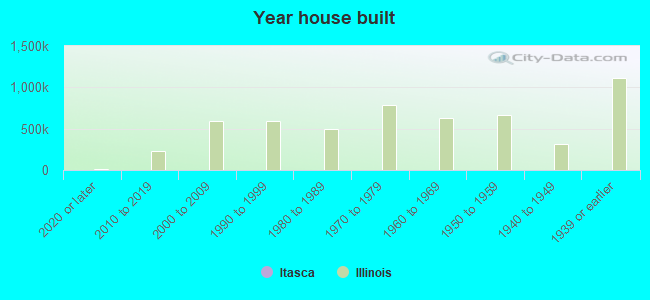
Median year apartment built: 1977
Household type by relationship:
Households: 9,527- Male householders: 1,975 (265 living alone), Female householders: 1,825 (536 living alone)
2,152 spouses (2,139 opposite-sex spouses), 298 unmarried partners, (298 opposite-sex unmarried partners), 2,488 children (2,369 natural, 9 adopted, 109 stepchildren), 44 grandchildren, 78 brothers or sisters, 261 parents, 0 foster children, 80 other relatives, 181 non-relatives
- In group quarters: 140
Size of family households: 1,348 2-persons, 566 3-persons, 575 4-persons, 98 5-persons, 55 6-persons, 19 7-or-more-persons.
Size of nonfamily households: 830 1-person, 355 2-persons, 24 3-persons.
1,441 married couples with children.
374 single-parent households (0 men, 374 women).
69.1% of residents of Itasca speak English at home.
7.5% of residents speak Spanish at home (62% speak English very well, 29% speak English well, 4% speak English not well, 5% don't speak English at all).
16.1% of residents speak other Indo-European language at home (77% speak English very well, 15% speak English well, 8% speak English not well).
6.4% of residents speak Asian or Pacific Island language at home (70% speak English very well, 19% speak English well, 11% speak English not well).
Foreign born population: 2,390 (25.1%)
(62.8% of them are naturalized citizens)
| Here: | 6.4 |
| State: | 6.4 |
| Here: | 3.9 |
| State: | 4.1 |
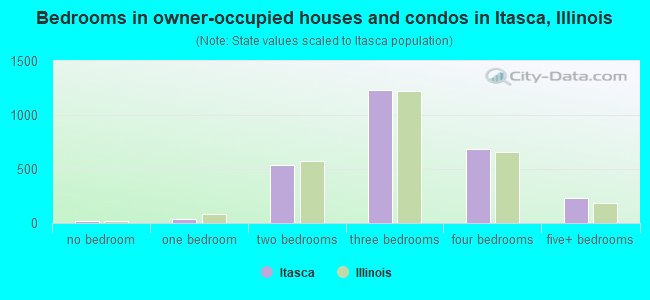
- Bedrooms in owner-occupied houses and condos in Itasca, Illinois
- 18no bedroom
- 411 bedroom
- 5382 bedrooms
- 1,2273 bedrooms
- 6834 bedrooms
- 2365+ bedrooms
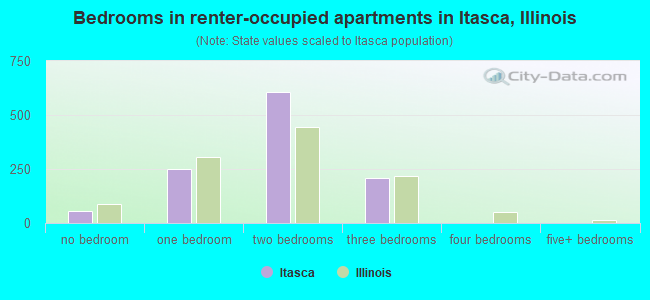
- Bedrooms in renter-occupied apartments in Itasca, Illinois
- 54no bedroom
- 2511 bedroom
- 6082 bedrooms
- 2083 bedrooms
- 04 bedrooms
- 05+ bedrooms
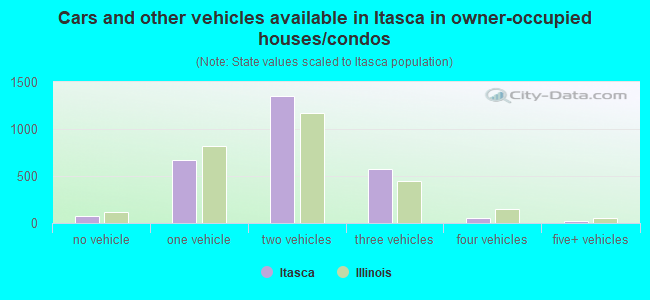
- Cars and other vehicles available in Itasca in owner-occupied houses/condos
- 71no vehicle
- 6661 vehicle
- 1,3552 vehicles
- 5743 vehicles
- 564 vehicles
- 215+ vehicles
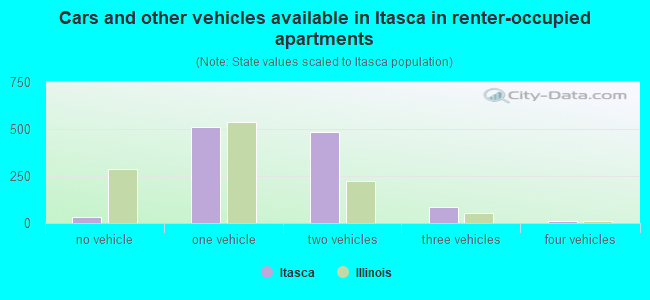
- Cars and other vehicles available in Itasca in renter-occupied apartments
- 34no vehicle
- 5131 vehicle
- 4822 vehicles
- 833 vehicles
- 94 vehicles
- 05+ vehicles
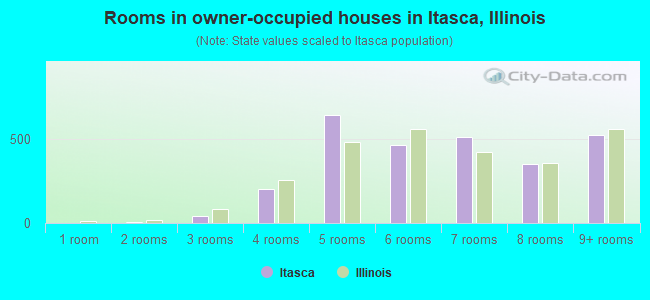
- Rooms in owner-occupied houses in Itasca, Illinois
- 01 room
- 52 rooms
- 443 rooms
- 2014 rooms
- 6435 rooms
- 4666 rooms
- 5127 rooms
- 3498 rooms
- 5239+ rooms
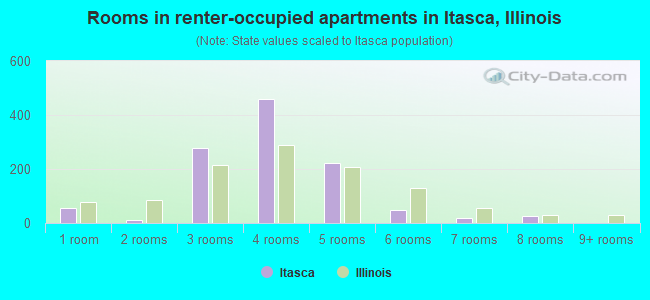
- Rooms in renter-occupied apartments in Itasca, Illinois
- 541 room
- 122 rooms
- 2793 rooms
- 4584 rooms
- 2225 rooms
- 506 rooms
- 197 rooms
- 268 rooms
- 09+ rooms
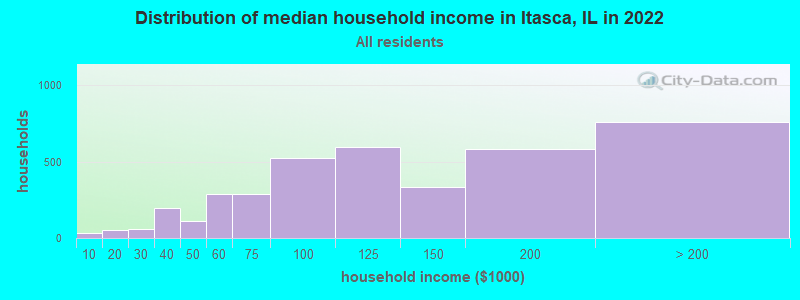
Itasca, IL household income distribution

- 33Less than $10,000
- 55$10,000 to $19,999
- 57$20,000 to $29,999
- 194$30,000 to $39,999
- 108$40,000 to $49,999
- 288$50,000 to $59,999
- 289$60,000 to $74,999
- 526$75,000 to $99,999
- 597$100,000 to $124,999
- 334$125,000 to $149,999
- 584$150,000 to $199,999
- 759$200,000 or more
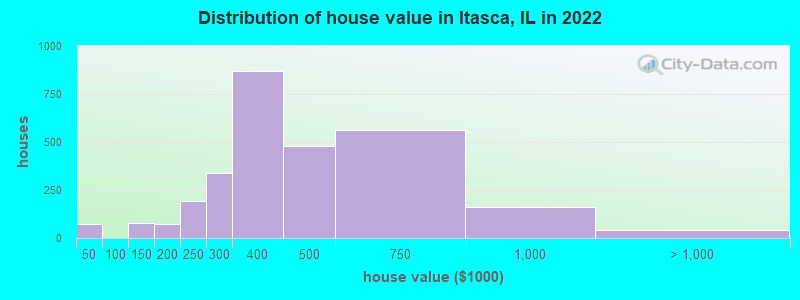
Home value of owner - occupied houses in 2022 in Itasca, IL
-
- 54Less than $10,000
- 18$25,000 to $29,999
- 17$100,000 to $124,999
- 61$125,000 to $149,999
- 21$150,000 to $174,999
- 49$175,000 to $199,999
- 192$200,000 to $249,999
- 337$250,000 to $299,999
- 871$300,000 to $399,999
- 477$400,000 to $499,999
- 563$500,000 to $749,999
- 158$750,000 to $999,999
- 12$1,000,000 to $1,499,999
- 28$2,000,000 or more
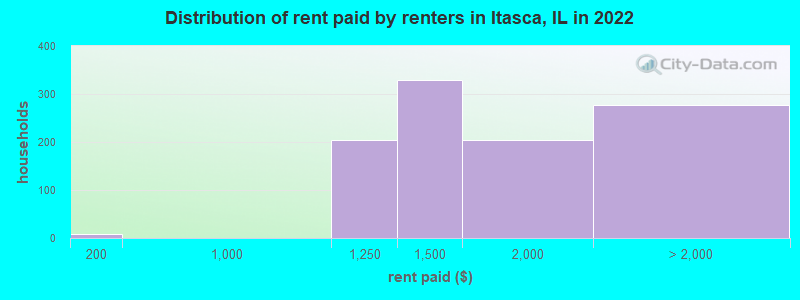
Rent paid by renters in 2022 in Itasca, IL
-
- 8$150 to $199
- 204$1,000 to $1,249
- 329$1,250 to $1,499
- 204$1,500 to $1,999
- 143$2,000 to $2,499
- 107$2,500 to $2,999
- 28$3,000 to $3,499
Percentage of workers working in this county: 57.9%
Number of people working at home: 1,318 (23.6% of all workers)
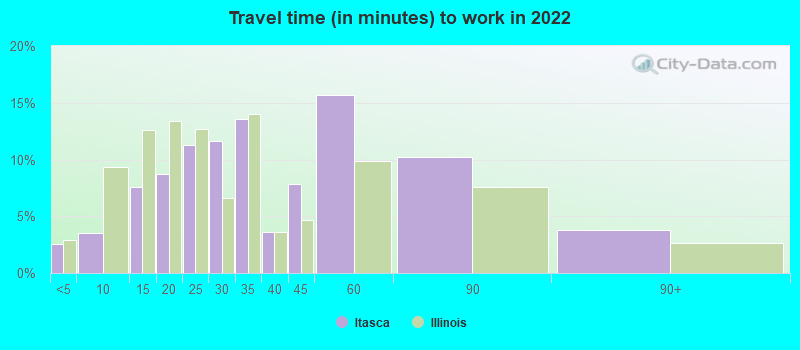
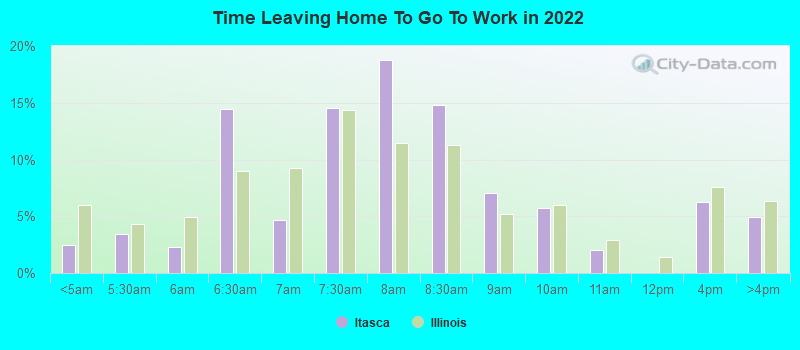
Travel time to work (commute)
- Less than 5 minutes: 364
- 5 to 9 minutes: 493
- 10 to 14 minutes: 527
- 15 to 19 minutes: 459
- 20 to 24 minutes: 656
- 25 to 29 minutes: 263
- 30 to 34 minutes: 546
- 35 to 39 minutes: 134
- 40 to 44 minutes: 186
- 45 to 59 minutes: 359
- 60 to 89 minutes: 272
- 90 or more minutes: 27
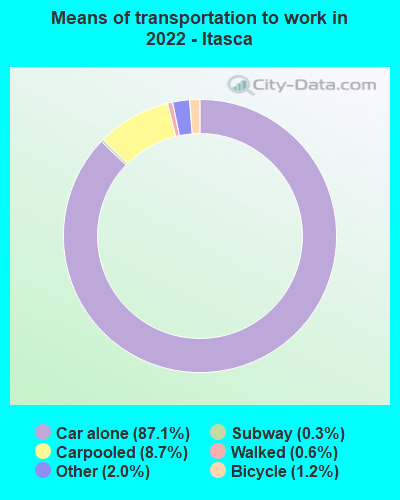
Means of transportation to work:
- Drove a car alone: 14,033 (77.5%)
- Carpooled: 1,722 (9.5%)
- Bus: 15 (0.1%)
- Long-distance train or commuter rail: 44 (0.2%)
- Taxi: 367 (2.0%)
- Bicycle: 171 (0.9%)
- Walked: 95 (0.5%)
- Worked at home: 1,318 (7.3%)
- Unemployment by race in 2022
- Unemployment rate for White non-Hispanic residents
- 2.5%Males
- 2.6%Females
- Unemployment rate for Black residents
- 38.7%Males
- Unemployment rate for Asian residents
- 1.6%Females
- Unemployment rate for two or more race residents
- 5.8%Females
- Unemployment rate for Hispanic or Latino residents
- 4.6%Males
- 7.0%Females
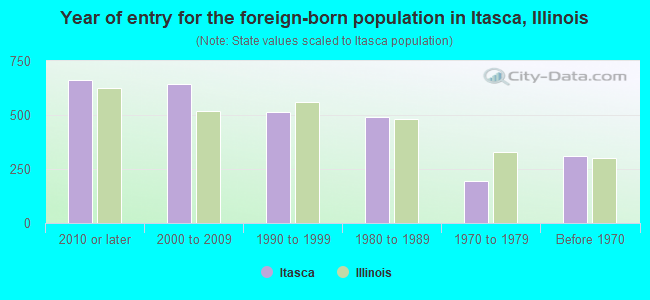
- Year of entry for the foreign-born population in Itasca, Illinois
- 6632010 or later
- 6432000 to 2009
- 5121990 to 1999
- 4901980 to 1989
- 1961970 to 1979
- 311Before 1970
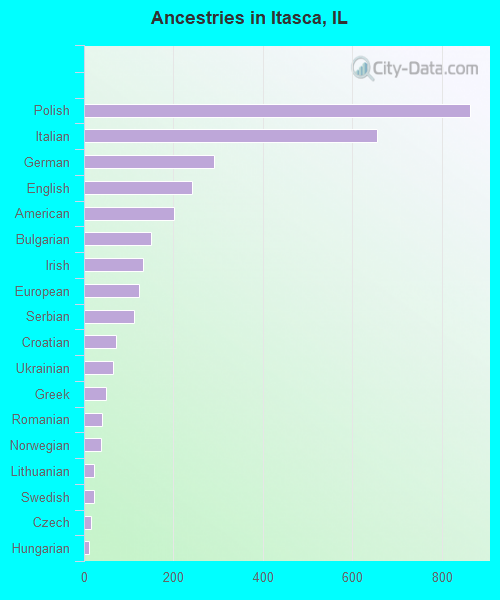
First ancestries reported:
- Polish: 863 (16.8%)
- Italian: 655 (12.8%)
- German: 290 (5.7%)
- English: 242 (4.7%)
- American: 202 (3.9%)
- Bulgarian: 150 (2.9%)
- Irish: 133 (2.6%)
- European: 124 (2.4%)
- Serbian: 112 (2.2%)
- Croatian: 71 (1.4%)
- Ukrainian: 64 (1.2%)
- Greek: 49 (1.0%)
- Romanian: 41 (0.8%)
- Norwegian: 37 (0.7%)
- Lithuanian: 22 (0.4%)
- Swedish: 22 (0.4%)
- Czech: 16 (0.3%)
- Hungarian: 12 (0.2%)
- Welsh: 7 (0.1%)
- South African: 5 (0.10%)
Most common places of birth for foreign-born residents (%):
| Itasca: | 19.7% (473) |
| Illinois: | 6.9% (124,474) |
| Itasca: | 17.6% (422) |
| Illinois: | 9.2% (166,409) |
| Itasca: | 9.5% (229) |
| Illinois: | 34.7% (626,958) |
| Itasca: | 9.1% (219) |
| Illinois: | 5.2% (93,003) |
| Itasca: | 6.6% (158) |
| Illinois: | 0.6% (10,943) |
| Itasca: | 4.7% (112) |
| Illinois: | 0.8% (14,165) |
| Itasca: | 4.3% (104) |
| Illinois: | 0.9% (15,679) |
| Itasca: | 3.4% (82) |
| Illinois: | 1.6% (29,316) |
| Itasca: | 2.8% (68) |
| Illinois: | 2.2% (40,393) |
| Itasca: | 2.3% (56) |
| Illinois: | 0.9% (16,844) |
| Itasca: | 2.2% (53) |
| Illinois: | 0.3% (4,938) |
| Itasca: | 2.2% (53) |
| Illinois: | 1.3% (22,793) |
| Itasca: | 2.1% (51) |
| Illinois: | 0.2% (2,731) |
| Itasca: | 2.0% (48) |
| Illinois: | 0.1% (1,780) |
| Itasca: | 1.7% (42) |
| Illinois: | 0.6% (10,776) |
| Itasca: | 1.6% (39) |
| Illinois: | 0.2% (3,977) |
| Itasca: | 1.6% (39) |
| Illinois: | 0.4% (7,323) |
Place of birth for U.S.-born residents:
- This state: 6,304
- Other state: 719
- Northeast: 222
- Midwest: 341
- South: 99
- West: 59
87.9% of Itasca residents lived in the same house 1 years ago.
Out of people who lived in different houses, 30.6% lived in this county.
Out of people who lived in different counties, 87.3% lived in Illinois.
| Itasca: | 87.9% |
| State average: | 88.3% |
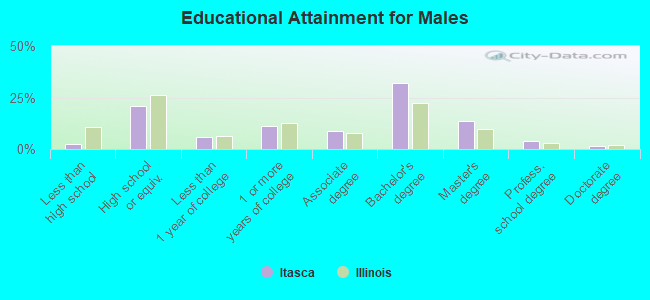
Education attainment for males 25 years and older:
- No schooling: 30
- Nursery to 4th grade: 9
- 5th and 6th grade: 3
- 7th and 8th grade: 0
- 9th grade: 0
- 10th grade: 20
- 11th grade: 0
- 12th grade, no diploma: 24
- High school graduate (or equivalency): 688
- Less than 1 year of college: 183
- Some college more than 1 year, no degree: 362
- Associate degree: 284
- Bachelor's degree: 1,051
- Master's degree: 451
- Professional school degree: 130
- Doctorate degree: 41
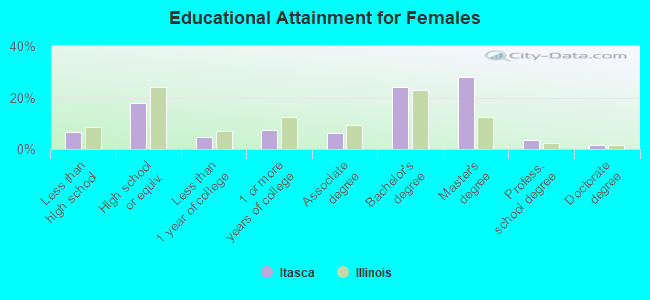
Education attainment for females 25 years and older:
- No schooling: 24
- Nursery to 4th grade: 0
- 5th and 6th grade: 40
- 7th and 8th grade: 17
- 9th grade: 5
- 10th grade: 114
- 11th grade: 24
- 12th grade, no diploma: 28
- High school graduate (or equivalency): 669
- Less than 1 year of college: 175
- Some college more than 1 year, no degree: 271
- Associate degree: 231
- Bachelor's degree: 890
- Master's degree: 1,044
- Professional school degree: 131
- Doctorate degree: 52
Housing units in structures:
- One, detached: 2,033
- One, attached: 744
- Two: 20
- 3 or 4: 118
- 5 to 9: 119
- 10 to 19: 93
- 20 to 49: 176
- 50 or more: 875
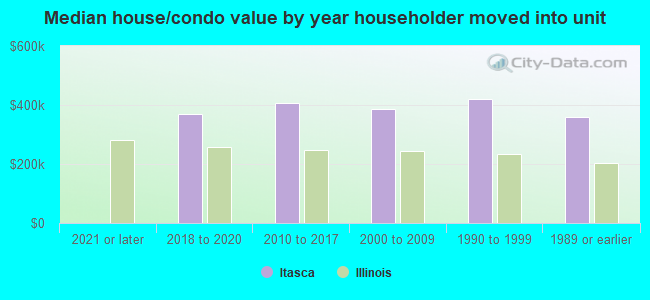
House/condo owner moved in on average 13 years ago
Renter moved in on average 2 years ago
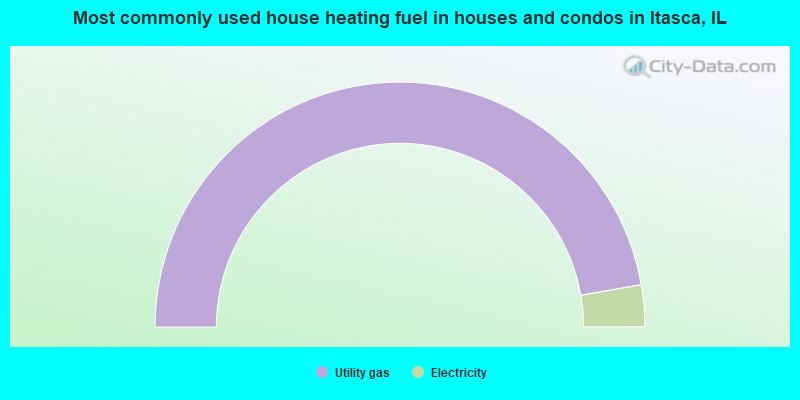
- 94.5%Utility gas
- 5.5%Electricity
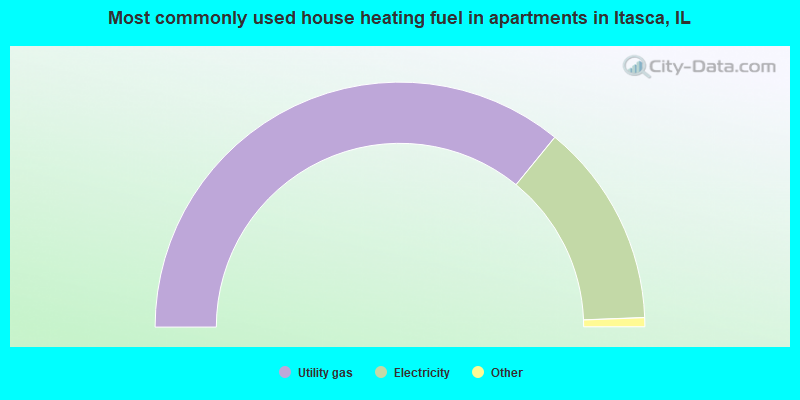
- 71.8%Utility gas
- 27.0%Electricity
- 0.6%Bottled, tank, or LP gas
- 0.5%Other fuel
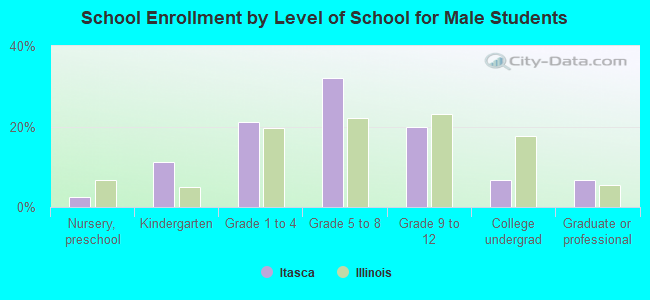
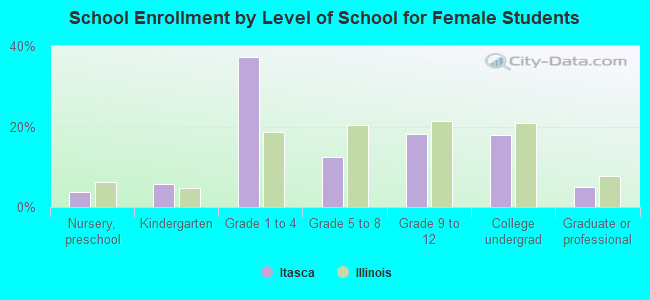
Private vs. public school enrollment:
| Here: | 9.2% |
| Illinois: | 13.3% |
| Here: | 3.0% |
| Illinois: | 9.9% |
| Here: | 31.9% |
| Illinois: | 27.4% |