Races in Itasca, Illinois (IL) Detailed Stats
Ancestries, Foreign-born residents, place of birth
Settings
X


Recent posts about races in Itasca, Illinois on our local forum with over 2,400,000 registered users:
 | Towns comparable to Hinsdale and commutable to Itasca? (57 replies) |
| Need information about Itasca please. Recommendations for additional areas near Elk Grove Village? (24 replies) |
| Could Use Advice on Where to Move (21 replies) |
| Scoop on Itasca (20 replies) |
| Which area best to book hotel for our house hunting trip? (14 replies) |
| Asian Indians in Chicago NW Suburbs (9 replies) |
Latest news about races in Itasca, IL collected exclusively by city-data.com from local newspapers, TV, and radio stations
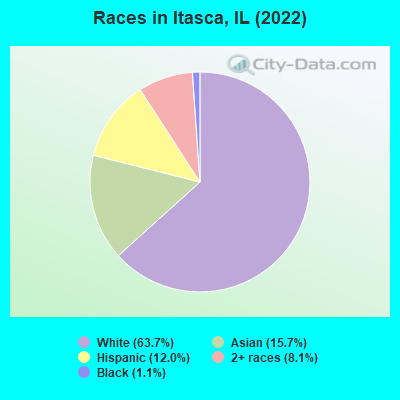
According to 2022 data, the most numerous races in Itasca, IL are White alone (6,065 residents), Hispanic (1,147 residents), and Black alone (107 residents). 69.2% of Itasca residents speak English at home. 25.2% of Itasca, IL residents are foreign-born (11.3% born in Asia, 9.7% born in Europe, 3.6% born in Latin America), which is 44.5% greater than the foreign-born rate of 14.0% across the entire state of Illinois.
Race distribution in Itasca
2000
2022

- 6,89083.0%White alone
- 5817.0%Hispanic
- 4845.8%Asian alone
- 1832.2%Two or more races
- 1401.7%Black alone
- 160.2%American Indian alone
- 60.07%Other race alone
- 20.02%Native Hawaiian and Other
Pacific Islander alone

-
- 6,06563.7%White alone
- 1,49515.7%Asian alone
- 1,14712.0%Hispanic
- 7708.1%Two or more races
- 1071.1%Black alone
2000
2022
-
- 8,424,14067.8%White alone
- 1,856,15214.9%Black alone
- 1,530,26212.3%Hispanic
- 419,9163.4%Asian alone
- 153,9961.2%Two or more races
- 13,4790.1%Other race alone
- 18,2320.1%American Indian alone
- 3,1160.03%Native Hawaiian and Other
Pacific Islander alone

-
- 7,356,30158.5%White alone
- 2,299,72618.3%Hispanic
- 1,660,42313.2%Black alone
- 747,2965.9%Asian alone
- 458,5993.6%Two or more races
- 45,3860.4%Other race alone
- 10,4050.08%American Indian alone
- 3,8960.03%Native Hawaiian and Other
Pacific Islander alone

Income and house value in Itasca
- Median household income in 2022
- $109,080White non-Hispanic householders
- $199,618Asian householders
- $75,351Some other race householders
- $60,007Two or more races householders
- $55,203Hispanic or Latino race householders
- Median 2022 house value
- $400,383White Non-Hispanic householders
- $529,353American Indian or Alaska Native householders
- $411,740Asian householders
- $328,776Some other race householders
- $445,234Two or more races householders
- $332,626Hispanic or Latino householders
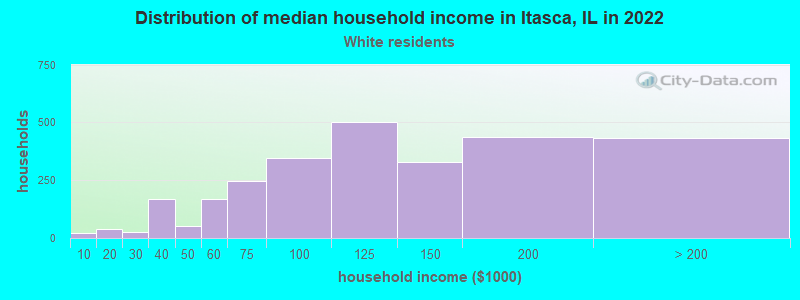
Household income for White non-Hispanic householders
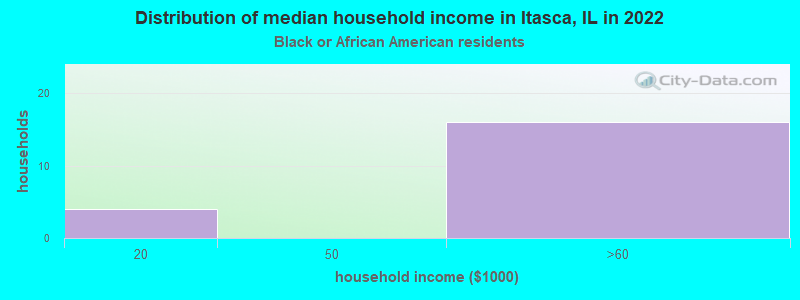
Household income for Black householders
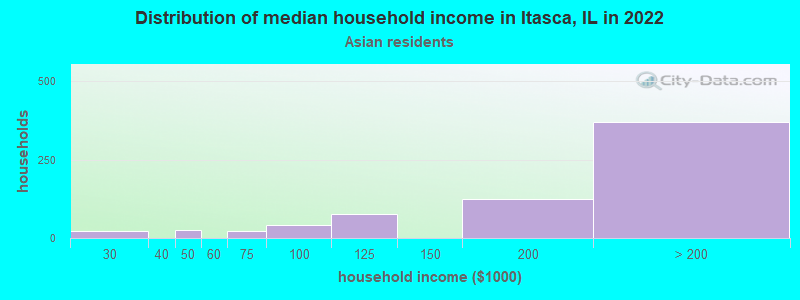
Household income for Asian householders
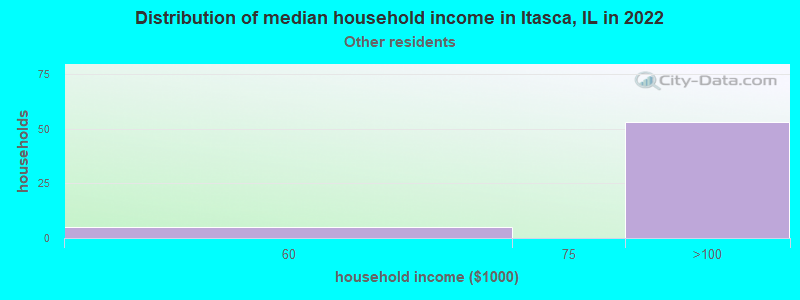
Household income for Some other race householders
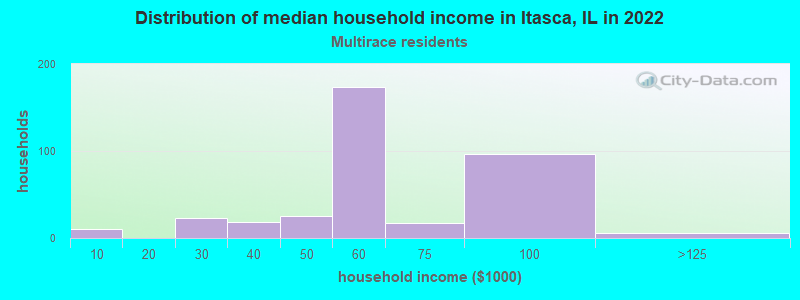
Household income for Two or more races householders
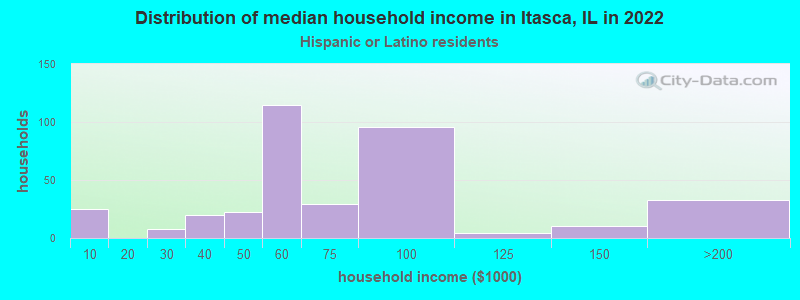
Household income for Hispanic or Latino race householders
Median age by race in Itasca
- 48.8Median age for White residents
- 47.8Males
- 50.1Females
- 37.6Median age for Black or African American residents
- 38.9Males
- 44.8Females
- -699,421,964.6Median age for American Indian / Alaska Native residents
- -721,943,047.9Males
- -545,253,862.6Females
- 35.3Median age for Asian residents
- 38.7Males
- 34.0Females
- -593,236,714.4Median age for Native Hawaiian / Pacific Islander residents
- -658,536,584.7Males
- -576,015,108.0Females
- 27.7Median age for Other race residents
- 29.8Males
- 28.2Females
- 24.0Median age for Two or more races residents
- 9.5Males
- 28.7Females
- 49.4Median age for White alone residents
- 48.2Males
- 51.0Females
- 30.6Median age for Hispanic or Latino residents
- 27.4Males
- 40.6Females
Owner/renter occupied households by race in Itasca
- House owners and renters - White residents
- 2,26781.4%Owner occupied
- 51918.6%Renter occupied
- House owners and renters - Black or African American residents
- 22100.0%Renter occupied
- House owners and renters - Asian residents
- 38662.5%Owner occupied
- 23237.5%Renter occupied
- House owners and renters - Other race residents
- 64100.0%Renter occupied
- House owners and renters - Two or more races residents
- 11132.8%Owner occupied
- 22967.2%Renter occupied
- House owners and renters - White alone residents
- 2,27582.6%Owner occupied
- 47917.4%Renter occupied
- House owners and renters - Hispanic or Latino residents
- 11832.8%Owner occupied
- 24167.2%Renter occupied
Language usage in Itasca
- English speakers - Total
- 69.2% of residents of Itasca speak English at home.
- 7.6% of residents speak Spanish at home
- 42260.1%Speak English very well
- 28039.9%Speak English less than very well
- 22.9% of residents speak other language at home
- 1,58975.3%Speak English very well
- 52224.7%Speak English less than very well
All residents speak only English at home
- English speakers - Native, born elsewhere
- 93.4% of residents of Itasca speak English at home.
- 7.9% of residents speak Spanish at home
- 6100.0%Speak English very well
- English speakers - Foreign-born
- 15.7% of residents of Itasca speak English at home.
- 15.4% of residents speak Spanish at home
- 11331.0%Speak English very well
- 25269.0%Speak English less than very well
- 68.0% of residents speak other language at home
- 1,09067.5%Speak English very well
- 52432.5%Speak English less than very well
White (Caucasian) - Speak only English
| Native: | 90.3% (4,773) |
| Foreign-born: | 17.9% (159) |
White (Caucasian) - Speak another language
| Native: | 8.6% (454) |
| Foreign-born: | 82.1% (726) |
Asian - Speak only English
| Native: | 88.3% (345) |
| Foreign-born: | 17.2% (183) |
Asian - Speak another language
| Native: | 18.1% (71) |
| Foreign-born: | 81.4% (864) |
Other race - Speak another language
| Native: | 9.4% (9) |
| Foreign-born: | 100.0% (103) |
Two or more races - Speak only English
| Native: | 79.6% (789) |
| Foreign-born: | 13.4% (34) |
Two or more races - Speak another language
| Native: | 17.8% (177) |
| Foreign-born: | 86.1% (221) |
White alone - Speak only English
| Native: | 91.9% (4,647) |
| Foreign-born: | 18.3% (175) |
White alone - Speak another language
| Native: | 7.8% (397) |
| Foreign-born: | 81.7% (783) |
Hispanic or Latino - Speak only English
| Native: | 54.3% (382) |
| Foreign-born: | 2.3% (8) |
Hispanic or Latino - Speak another language
| Native: | 45.1% (317) |
| Foreign-born: | 98.4% (361) |
Foreign-born residents in Itasca
2,404 residents are foreign born (11.3% Asia, 9.7% Europe, 3.6% Latin America).
| This city: | 25.2% |
| Illinois: | 14.1% |


Marital status for residents in Itasca
Marital status - White (Caucasian) population 15 years and over
- Males
- 27.8%Never married
- 63.8%Now married
- 0.5%Separated
- 1.0%Widowed
- 7.0%Divorced
- Females
- 20.7%Never married
- 54.3%Now married
- 1.3%Separated
- 7.4%Widowed
- 16.3%Divorced
Women who did not give birth in the past 12 months
| Now married: | 51.6% (678) |
| Unmarried: | 48.4% (635) |
Marital status - Black or African American population 15 years and over
- Males
- 7.8%Never married
- 66.7%Now married
- 0.0%Separated
- 0.0%Widowed
- 25.5%Divorced
- Females
- 55.3%Never married
- 14.9%Now married
- 0.0%Separated
- 29.8%Widowed
- 0.0%Divorced
Women who did not give birth in the past 12 months
| Now married: | 0.0% (0) |
| Unmarried: | 100.0% (18) |
Marital status - Asian population 15 years and over
- Males
- 13.3%Never married
- 82.6%Now married
- 0.0%Separated
- 4.1%Widowed
- 0.0%Divorced
- Females
- 27.1%Never married
- 64.6%Now married
- 0.0%Separated
- 5.1%Widowed
- 3.3%Divorced
Women who gave birth in the past 12 months
| Now married: | 100.0% (56) |
| Unmarried: | 0.0% (0) |
Women who did not give birth in the past 12 months
| Now married: | 56.6% (265) |
| Unmarried: | 43.4% (203) |
Marital status - Other race population 15 years and over
- Males
- 54.8%Never married
- 45.2%Now married
- 0.0%Separated
- 0.0%Widowed
- 0.0%Divorced
- Females
- 63.8%Never married
- 25.0%Now married
- 11.2%Separated
- 0.0%Widowed
- 0.0%Divorced
Women who gave birth in the past 12 months
| Now married: | 0.0% (0) |
| Unmarried: | 100.0% (29) |
Women who did not give birth in the past 12 months
| Now married: | 49.2% (40) |
| Unmarried: | 50.8% (42) |
Marital status - Two or more races population 15 years and over
- Males
- 62.0%Never married
- 20.7%Now married
- 13.4%Separated
- 0.0%Widowed
- 3.9%Divorced
- Females
- 32.4%Never married
- 38.0%Now married
- 0.0%Separated
- 10.3%Widowed
- 19.3%Divorced
Women who did not give birth in the past 12 months
| Now married: | 33.8% (140) |
| Unmarried: | 66.2% (273) |
Marital status - White alone, not Hispanic / Latino population 15 years and over
- Males
- 25.3%Never married
- 66.1%Now married
- 0.5%Separated
- 1.1%Widowed
- 7.0%Divorced
- Females
- 20.9%Never married
- 54.1%Now married
- 0.7%Separated
- 7.4%Widowed
- 16.8%Divorced
Women who did not give birth in the past 12 months
| Now married: | 48.3% (607) |
| Unmarried: | 51.7% (649) |
Marital status - Hispanic or Latino population 15 years and over
- Males
- 62.6%Never married
- 27.4%Now married
- 6.3%Separated
- 0.0%Widowed
- 3.7%Divorced
- Females
- 27.8%Never married
- 39.6%Now married
- 5.7%Separated
- 9.3%Widowed
- 17.7%Divorced
Women who gave birth in the past 12 months
| Now married: | 0.0% (0) |
| Unmarried: | 100.0% (22) |
Women who did not give birth in the past 12 months
| Now married: | 50.9% (200) |
| Unmarried: | 49.1% (193) |
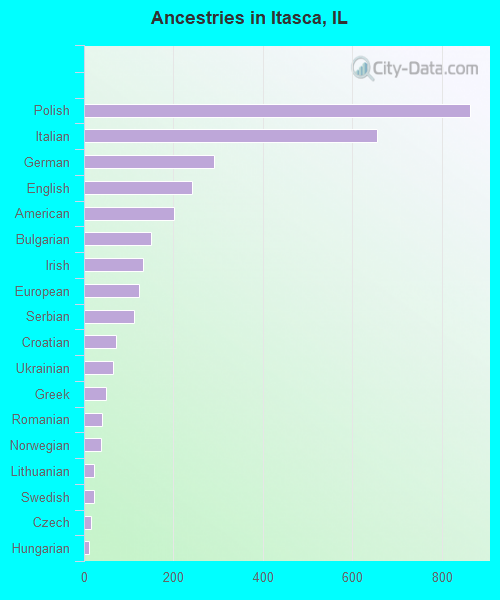
Ancestries in Itasca

- 86316.8%Polish
- 65512.8%Italian
- 2905.7%German
- 2424.7%English
- 2023.9%American
- 1502.9%Bulgarian
- 1332.6%Irish
- 1242.4%European
- 1122.2%Serbian
- 711.4%Croatian
- 641.2%Ukrainian
- 491.0%Greek
- 410.8%Romanian
- 370.7%Norwegian
- 220.4%Lithuanian
- 220.4%Swedish
- 160.3%Czech
- 120.2%Hungarian
- 70.1%Welsh
- 50.10%South African
Geographical mobility in Itasca

- Same house 1 year ago
- 5,78491.8%White (Caucasian)
- 6560.3%Black or African American
- 1,08273.8%Asian
- 14972.3%Other race
- 1,20287.6%Two or more races
- 5,63192.9%White alone, not Hispanic / Latino
- 96183.9%Hispanic or Latino

-
- Moved within same county
- 3094.9%White / Caucasian
- 43.8%Black or African American
- 181.2%Asian
- 94.2%Other race
- 705.1%Two or more races
- 2293.8%White alone, not Hispanic / Latino
- 1109.6%Hispanic or Latino

-
- Moved within same state
- 1642.6%White / Caucasian
- 3734.5%Black or African American
- 34823.7%Asian
- 271.9%Two or more races
- 1732.9%White alone, not Hispanic / Latino
- 80.7%Hispanic or Latino

-
- Moved from different state
- 130.2%White / Caucasian
- 211.4%Asian
- 4320.9%Other race
- 130.2%White alone, not Hispanic / Latino
- 665.7%Hispanic or Latino

-
- Moved from abroad
- 976.6%Asian
- 584.2%Two or more races

Children Nativity (place of birth) in Itasca
Place of birth for residents in Itasca
![Place of birth for the foreign-born population - Regions]()
- 1,095Asia
- 935Europe
- 819Eastern Europe
- 451South Central Asia
- 366Americas
- 351Latin America
- 317South Eastern Asia
- 312Eastern Asia
- 284Central America
- 94Southern Europe
- 66South America
- 64China
- 15Northern America
- 13Western Europe
- 13Western Asia
- 9Northern Europe
- 7Africa
- 7Southern Africa

![Place of birth for the foreign-born population - Countries]()
- 490Poland
- 406India
- 231Mexico
- 221Philippines
- 175Japan
- 118Bulgaria
- 88Italy
- 73Korea
- 72Ukraine
- 66Ecuador
- 55Thailand
- 53Guatemala
- 41Bosnia and Herzegovina
- 41Indonesia
- 37China
- 34Moldova
- 33Croatia
- 30Lithuania
- 27Taiwan
- 24Bangladesh
- 21Pakistan
- 15Canada
- 13Germany
- 13Iraq
- 9England
- 7South Africa
- 6Greece

Zip codes: 60143.