Hinesville, GA (Georgia) Houses and Residents
| Hinesville: | $175,106 |
| Georgia: | $297,400 |
Total population: 34,815 (Urban population: 30,519, Rural population: 15 (all nonfarm))
Houses: 15,056 (13,207 occupied: 5,993 owner occupied, 7,420 renter occupied)
| % of renters here: | 55% |
| State: | 34% |
Housing density: 928 houses/condos per square mile
Median price asked for vacant for-sale houses and condos in 2022: $122,249.
Median contract rent in 2022: $1,014 (lower quartile is $825, upper quartile is $1,252)
Median rent asked for vacant for-rent units in 2022: $896
Median gross rent in Hinesville, GA in 2022: $1,135
Housing units in Hinesville with a mortgage: 4,130 (150 second mortgage, 0 home equity loan, 48 both second mortgage and home equity loan)
Houses without a mortgage: 14
Median household income for houses/condos with a mortgage: $75,433
Median household income for apartments without a mortgage: $76,570
Median monthly housing costs: $1,123
Compare current foreclosures in Hinesville, GA:
| Photo | Address | Area | Beds / Baths | Price | Details |
|---|---|---|---|---|---|

|
#1
Heathrow Dr
Hinesville, GA 31313
|
1,746 sq. feet
|
2 baths 10 beds |
show details | |

|
#2
Whippoorwill Way
Hinesville, GA 31313
|
1,356 sq. feet
|
2 baths 3 beds |
show details | |

|
#3
Brightleaf Cir
Hinesville, GA 31313
|
2,423 sq. feet
|
3 baths 5 beds |
show details | |

|
#4
Cove St
Hinesville, GA 31313
|
1,390 sq. feet
|
2 baths 3 beds |
show details | |

|
#5
Cove St
Hinesville, GA 31313
|
1,264 sq. feet
|
2 baths 3 beds |
show details | |

|
#6
Kiln Ln
Hinesville, GA 31313
|
1,545 sq. feet
|
2 baths 3 beds |
show details | |

|
#7
Waterlily Court
Hinesville, GA 31313
|
- sq. feet
|
2 baths 3 beds |
show details | |

|
#8
Dorsey Rd
Hinesville, GA 31313
|
1,512 sq. feet
|
1 baths 3 beds |
show details | |

|
#9
Magnolia Plantation Ct
Hinesville, GA 31313
|
1,228 sq. feet
|
2 baths 3 beds |
show details | |

|
#10
Gause St # B
Hinesville, GA 31313
|
720 sq. feet
|
3 baths 4 beds |
show details |
| Photo | Address | Area | Beds / Baths | Price | Details |
|---|---|---|---|---|---|

|
#11
Bradwell St
Hinesville, GA 31313
|
1,448 sq. feet
|
2 baths 3 beds |
show details | |

|
#12
Ringneck Way
Hinesville, GA 31313
|
1,599 sq. feet
|
2 baths 3 beds |
show details | |

|
#13
Wayfair Ln
Hinesville, GA 31313
|
1,571 sq. feet
|
2 baths 4 beds |
show details | |

|
#14
Crosby Dr
Hinesville, GA 31313
|
1,474 sq. feet
|
2 baths 3 beds |
show details | |

|
#15
Kyle Ln
Hinesville, GA 31313
|
1,206 sq. feet
|
2 baths 3 beds |
show details | |

|
#16
Hancock St
Hinesville, GA 31313
|
1,644 sq. feet
|
2 baths 3 beds |
show details | |

|
#17
Whippoorwill Way
Hinesville, GA 31313
|
1,356 sq. feet
|
2 baths 3 beds |
show details | |

|
#18
Flo Zechman Dr
Hinesville, GA 31313
|
1,161 sq. feet
|
2 baths 3 beds |
show details | |

|
#19
S Topi Trl
Hinesville, GA 31313
|
2,775 sq. feet
|
3 baths 4 beds |
show details | |

|
#20
Darrow Ln
Hinesville, GA 31313
|
1,767 sq. feet
|
2 baths 3 beds |
show details |
| Photo | Address | Area | Beds / Baths | Price | Details |
|---|---|---|---|---|---|

|
#21
Whitetail Cir
Hinesville, GA 31313
|
1,315 sq. feet
|
2 baths 3 beds |
show details | |

|
#22
Cinder Hill Ln
Hinesville, GA 31313
|
1,965 sq. feet
|
2 baths 3 beds |
show details | |

|
#23
Kyle Ln
Hinesville, GA 31313
|
1,133 sq. feet
|
2 baths 3 beds |
show details | |

|
#24
Lost Grove Ln
Hinesville, GA 31313
|
1,578 sq. feet
|
2 baths 4 beds |
show details | |

|
#25
Live Oak Dr
Hinesville, GA 31313
|
1,648 sq. feet
|
2 baths 4 beds |
show details | |

|
#26
Ogeechee Rd
Hinesville, GA 31313
|
1,288 sq. feet
|
1 baths 3 beds |
show details | |

|
#27
Seminole Dr
Hinesville, GA 31313
|
1,244 sq. feet
|
1 baths 3 beds |
show details | |

|
#28
Mary Todd Rd
Hinesville, GA 31313
|
1,517 sq. feet
|
1 baths 3 beds |
show details | |

|
#29
Beverly St Apt 121
Hinesville, GA 31313
|
985 sq. feet
|
2 baths 2 beds |
show details | |

|
#30
Preakness Dr
Hinesville, GA 31313
|
1,542 sq. feet
|
2 baths 3 beds |
show details |
| Photo | Address | Area | Beds / Baths | Price | Details |
|---|---|---|---|---|---|

|
#31
Bacon Rd
Hinesville, GA 31313
|
2,132 sq. feet
|
2 baths 3 beds |
show details | |

|
#32
Pioneer Rd
Hinesville, GA 31313
|
1,186 sq. feet
|
1 baths 3 beds |
show details | |

|
#33
Floyd St
Hinesville, GA 31313
|
1,623 sq. feet
|
2 baths 3 beds |
show details | |

|
#34
Rice Ct
Hinesville, GA 31313
|
1,424 sq. feet
|
2 baths 3 beds |
show details | |

|
#35
Cherry St
Hinesville, GA 31313
|
1,556 sq. feet
|
2 baths 3 beds |
show details | |

|
#36
Wayfair Ln
Hinesville, GA 31313
|
1,801 sq. feet
|
2 baths 3 beds |
show details | |

|
#37
S Maple Dr
Hinesville, GA 31313
|
1,806 sq. feet
|
2 baths 3 beds |
show details | |

|
#38
Mandarin Dr
Hinesville, GA 31313
|
1,512 sq. feet
|
2 baths 3 beds |
show details | |

|
#39
Elm St
Hinesville, GA 31313
|
1,516 sq. feet
|
2 baths 3 beds |
show details | |

|
#40
Eddie Ln
Hinesville, GA 31313
|
1,400 sq. feet
|
2 baths 3 beds |
show details |
| Photo | Address | Area | Beds / Baths | Price | Details |
|---|---|---|---|---|---|

|
#41
Cumberland Dr
Hinesville, GA 31313
|
1,985 sq. feet
|
3 baths 3 beds |
show details | |

|
#42
S Topi Trl
Hinesville, GA 31313
|
1,665 sq. feet
|
2 baths 3 beds |
show details | |

|
#43
Chandra Way
Hinesville, GA 31313
|
2,236 sq. feet
|
2 baths 4 beds |
show details | |

|
#44
Parker Dr
Hinesville, GA 31313
|
1,892 sq. feet
|
2 baths 3 beds |
show details | |

|
#45
Jubail Dr
Hinesville, GA 31313
|
1,557 sq. feet
|
2 baths 3 beds |
show details | |

|
#46
Hilltoppers Ct
Hinesville, GA 31313
|
2,477 sq. feet
|
2 baths 3 beds |
show details | |

|
#47
Livingston Ct
Hinesville, GA 31313
|
1,780 sq. feet
|
2 baths 3 beds |
show details | |

|
#48
Whitetail Cir
Hinesville, GA 31313
|
1,570 sq. feet
|
2 baths 3 beds |
show details | |

|
#49
Krebs Ln
Hinesville, GA 31313
|
1,075 sq. feet
|
1 baths 3 beds |
show details | |

|
Check over 1 million property listings on Foreclosure.com!
|
browse all offers | |||

Latest news about housing in Hinesville, GA collected exclusively by city-data.com from local newspapers, TV, and radio stations

 | Amtrak wants to make Atlanta a railroad hub (81 replies) |
| I love the coastal/I-95 region of Georgia (56 replies) |
| GA lawmakers pushing Fort Stewart to become home to new armored brigade combat team (0 replies) |
| relocating to savannah, ga (43 replies) |
| Hinesville or Statesboro? (19 replies) |
| Considering Moving to GA (16 replies) |

Median year apartment built: 1992
Household type by relationship:
Households: 36,046- Male householders: 7,045 (2,077 living alone), Female householders: 6,268 (1,543 living alone)
5,576 spouses (5,547 opposite-sex spouses), 759 unmarried partners, (743 opposite-sex unmarried partners), 12,556 children (11,383 natural, 321 adopted, 851 stepchildren), 1,055 grandchildren, 546 brothers or sisters, 362 parents, 56 foster children, 666 other relatives, 815 non-relatives
- In group quarters: 336
Size of family households: 4,380 2-persons, 1,903 3-persons, 1,362 4-persons, 864 5-persons, 331 6-persons, 75 7-or-more-persons.
Size of nonfamily households: 3,564 1-person, 805 2-persons, 34 3-persons, 16 5-persons.
3,788 married couples with children.
4,778 single-parent households (926 men, 3,852 women).
84.7% of residents of Hinesville speak English at home.
8.5% of residents speak Spanish at home (70% speak English very well, 22% speak English well, 7% speak English not well, 1% don't speak English at all).
3.6% of residents speak other Indo-European language at home (91% speak English very well, 6% speak English well, 4% don't speak English at all).
2.2% of residents speak Asian or Pacific Island language at home (37% speak English very well, 52% speak English well, 6% speak English not well, 5% don't speak English at all).
0.7% of residents speak other language at home (98% speak English very well, 2% speak English not well).
Foreign born population: 3,062 (8.5%)
(49.2% of them are naturalized citizens)
| Here: | 6.3 |
| State: | 6.8 |
| Here: | 4.4 |
| State: | 4.6 |

- Bedrooms in owner-occupied houses and condos in Hinesville, Georgia
- 48no bedroom
- 261 bedroom
- 2432 bedrooms
- 3,9193 bedrooms
- 1,3834 bedrooms
- 3745+ bedrooms

- Bedrooms in renter-occupied apartments in Hinesville, Georgia
- 155no bedroom
- 8441 bedroom
- 2,4932 bedrooms
- 3,0963 bedrooms
- 8124 bedrooms
- 215+ bedrooms

- Cars and other vehicles available in Hinesville in owner-occupied houses/condos
- 122no vehicle
- 1,5801 vehicle
- 2,4032 vehicles
- 1,3453 vehicles
- 3954 vehicles
- 1485+ vehicles

- Cars and other vehicles available in Hinesville in renter-occupied apartments
- 638no vehicle
- 3,7081 vehicle
- 2,4512 vehicles
- 4153 vehicles
- 1614 vehicles
- 485+ vehicles

- Rooms in owner-occupied houses in Hinesville, Georgia
- 481 room
- 262 rooms
- 273 rooms
- 3744 rooms
- 1,0225 rooms
- 1,4606 rooms
- 1,2617 rooms
- 7258 rooms
- 1,0519+ rooms

- Rooms in renter-occupied apartments in Hinesville, Georgia
- 1551 room
- 622 rooms
- 1,0863 rooms
- 1,6244 rooms
- 1,7875 rooms
- 1,5846 rooms
- 5607 rooms
- 3488 rooms
- 2149+ rooms


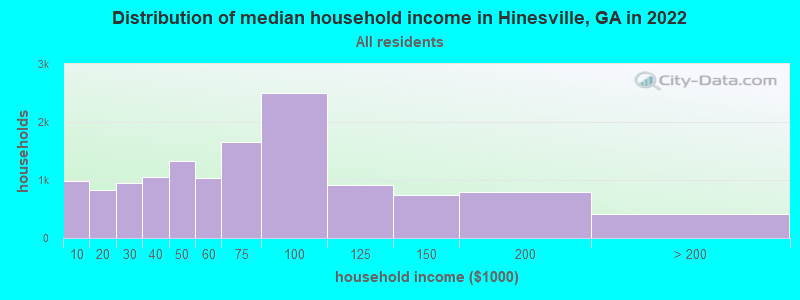
Hinesville, GA household income distribution

- 979Less than $10,000
- 823$10,000 to $19,999
- 945$20,000 to $29,999
- 1,044$30,000 to $39,999
- 1,326$40,000 to $49,999
- 1,027$50,000 to $59,999
- 1,650$60,000 to $74,999
- 2,494$75,000 to $99,999
- 920$100,000 to $124,999
- 737$125,000 to $149,999
- 795$150,000 to $199,999
- 411$200,000 or more
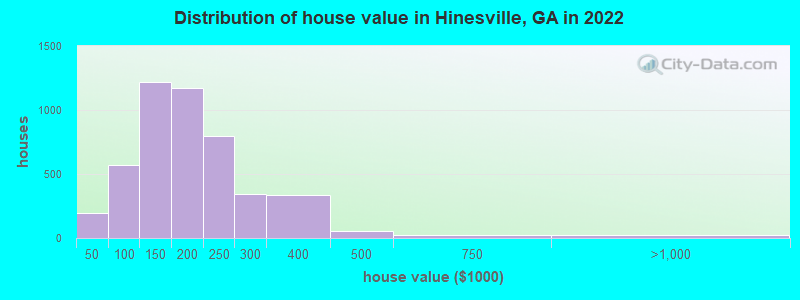
Home value of owner - occupied houses in 2022 in Hinesville, GA
-
- 23Less than $10,000
- 35$10,000 to $14,999
- 37$15,000 to $19,999
- 42$25,000 to $29,999
- 29$30,000 to $34,999
- 14$35,000 to $39,999
- 13$40,000 to $49,999
- 93$50,000 to $59,999
- 106$60,000 to $69,999
- 85$70,000 to $79,999
- 71$80,000 to $89,999
- 201$90,000 to $99,999
- 658$100,000 to $124,999
- 556$125,000 to $149,999
- 784$150,000 to $174,999
- 389$175,000 to $199,999
- 800$200,000 to $249,999
- 344$250,000 to $299,999
- 332$300,000 to $399,999
- 52$400,000 to $499,999
- 19$500,000 to $749,999
- 8$750,000 to $999,999
- 15$1,000,000 to $1,499,999
Rent paid by renters in 2022 in Hinesville, GA
-
- 17Less than $100
- 59$100 to $149
- 91$150 to $199
- 9$250 to $299
- 108$300 to $349
- 12$350 to $399
- 15$400 to $449
- 61$450 to $499
- 110$500 to $549
- 229$550 to $599
- 216$600 to $649
- 170$650 to $699
- 367$700 to $749
- 658$750 to $799
- 916$800 to $899
- 578$900 to $999
- 1,460$1,000 to $1,249
- 816$1,250 to $1,499
- 664$1,500 to $1,999
- 79$2,500 to $2,999
- 109No cash rent


Percentage of workers working in this county: 80.4%
Number of people working at home: 1,116 (6.9% of all workers)
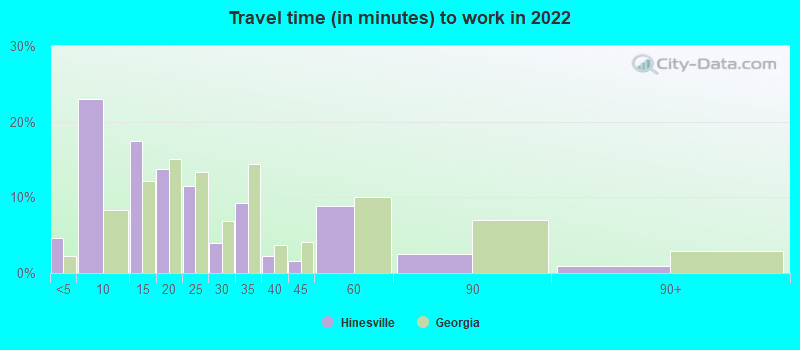
Travel time to work (commute)
- Less than 5 minutes: 701
- 5 to 9 minutes: 3,080
- 10 to 14 minutes: 2,412
- 15 to 19 minutes: 2,109
- 20 to 24 minutes: 2,529
- 25 to 29 minutes: 487
- 30 to 34 minutes: 722
- 35 to 39 minutes: 419
- 40 to 44 minutes: 122
- 45 to 59 minutes: 1,195
- 60 to 89 minutes: 2,255
- 90 or more minutes: 332
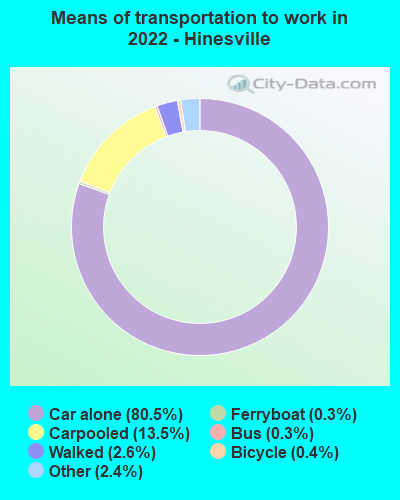
Means of transportation to work:
- Drove a car alone: 8,394 (71.2%)
- Carpooled: 1,467 (12.4%)
- Bus: 27 (0.2%)
- Ferryboat: 35 (0.3%)
- Taxi: 263 (2.2%)
- Bicycle: 37 (0.3%)
- Walked: 278 (2.4%)
- Worked at home: 1,116 (9.5%)

- Unemployment by race in 2022
- Unemployment rate for White non-Hispanic residents
- 1.9%Males
- 5.4%Females
- Unemployment rate for Black residents
- 6.8%Males
- 9.9%Females
- Unemployment rate for Asian residents
- 8.0%Females
- Unemployment rate for other race residents
- 0.4%Males
- 8.0%Females
- Unemployment rate for two or more race residents
- 13.2%Males
- 9.2%Females
- Unemployment rate for Hispanic or Latino residents
- 1.8%Males
- 10.1%Females

- Year of entry for the foreign-born population in Hinesville, Georgia
- 1,4192010 or later
- 4042000 to 2009
- 5271990 to 1999
- 7201980 to 1989
- 2851970 to 1979
- 199Before 1970

First ancestries reported:
- English: 1,001 (5.1%)
- American: 667 (3.4%)
- German: 464 (2.3%)
- Jamaican: 386 (2.0%)
- Irish: 319 (1.6%)
- West Indian: 264 (1.3%)
- European: 261 (1.3%)
- African: 246 (1.2%)
- Italian: 191 (1.0%)
- Ghanaian: 172 (0.9%)
- Nigerian: 148 (0.7%)
- German Russian: 136 (0.7%)
- Norwegian: 107 (0.5%)
- Haitian: 91 (0.5%)
- Scandinavian: 79 (0.4%)
- British: 77 (0.4%)
- French Canadian: 57 (0.3%)
- French: 51 (0.3%)
- Czech: 45 (0.2%)
- Scotch-Irish: 45 (0.2%)
- Portuguese: 43 (0.2%)
- Polish: 41 (0.2%)
- Eastern European: 36 (0.2%)
- Iranian: 24 (0.1%)
- Dutch: 18 (0.09%)
- Scottish: 11 (0.06%)
- Russian: 10 (0.05%)
- Canadian: 9 (0.05%)
- Greek: 9 (0.05%)
- Barbadian: 8 (0.04%)
- Guyanese: 7 (0.04%)
- Slavic: 7 (0.04%)
- U.S. Virgin Islander: 7 (0.04%)
- Danish: 6 (0.03%)
Most common places of birth for foreign-born residents (%):
| Hinesville: | 11.3% (339) |
| Georgia: | 20.0% (223,400) |
| Hinesville: | 10.3% (310) |
| Georgia: | 4.6% (51,270) |
| Hinesville: | 10.3% (309) |
| Georgia: | 0.1% (841) |
| Hinesville: | 8.3% (250) |
| Georgia: | 1.7% (18,651) |
| Hinesville: | 7.3% (219) |
| Georgia: | 1.0% (11,747) |
| Hinesville: | 6.9% (208) |
| Georgia: | 3.9% (43,756) |
| Hinesville: | 5.3% (159) |
| Georgia: | 9.2% (103,325) |
| Hinesville: | 3.8% (115) |
| Georgia: | 4.1% (45,797) |
| Hinesville: | 3.7% (112) |
| Georgia: | 0.3% (3,222) |
| Hinesville: | 3.6% (109) |
| Georgia: | 0.8% (8,849) |
| Hinesville: | 3.3% (98) |
| Georgia: | 0.2% (2,552) |
| Hinesville: | 3.0% (91) |
| Georgia: | 1.8% (20,700) |
| Hinesville: | 2.5% (76) |
| Georgia: | 1.1% (11,847) |
| Hinesville: | 2.0% (61) |
| Georgia: | 1.6% (17,476) |
| Hinesville: | 1.9% (57) |
| Georgia: | 0.3% (3,603) |
| Hinesville: | 1.6% (49) |
| Georgia: | 0.4% (4,046) |
| Hinesville: | 1.6% (48) |
| Georgia: | 1.6% (17,851) |
| Hinesville: | 1.6% (47) |
| Georgia: | 0.4% (5,023) |
Place of birth for U.S.-born residents:
- This state: 12,159
- Other state: 18,383
- Northeast: 2,610
- Midwest: 3,400
- South: 9,684
- West: 2,604
80.6% of Hinesville residents lived in the same house 1 years ago.
Out of people who lived in different houses, 21.0% lived in this county.
Out of people who lived in different counties, 63.4% lived in Georgia.
| Hinesville: | 80.6% |
| State average: | 86.6% |
Education attainment for males 25 years and older:
- No schooling: 136
- Nursery to 4th grade: 23
- 5th and 6th grade: 23
- 7th and 8th grade: 94
- 9th grade: 26
- 10th grade: 124
- 11th grade: 26
- 12th grade, no diploma: 94
- High school graduate (or equivalency): 4,137
- Less than 1 year of college: 1,000
- Some college more than 1 year, no degree: 2,038
- Associate degree: 775
- Bachelor's degree: 1,279
- Master's degree: 604
- Professional school degree: 114
- Doctorate degree: 49

Education attainment for females 25 years and older:
- No schooling: 72
- Nursery to 4th grade: 63
- 5th and 6th grade: 54
- 7th and 8th grade: 42
- 9th grade: 157
- 10th grade: 244
- 11th grade: 50
- 12th grade, no diploma: 77
- High school graduate (or equivalency): 2,478
- Less than 1 year of college: 1,071
- Some college more than 1 year, no degree: 1,641
- Associate degree: 1,707
- Bachelor's degree: 1,914
- Master's degree: 607
- Professional school degree: 83
- Doctorate degree: 83


Housing units in structures:
- One, detached: 9,669
- One, attached: 246
- Two: 214
- 3 or 4: 866
- 5 to 9: 1,238
- 10 to 19: 960
- 20 to 49: 513
- 50 or more: 228
- Mobile homes: 1,066
- Boats, RVs, vans, etc.: 52
Housing units lacking complete kitchen facilities in 2022: 0.6%
House/condo owner moved in on average 9 years ago
Renter moved in on average 0 years ago

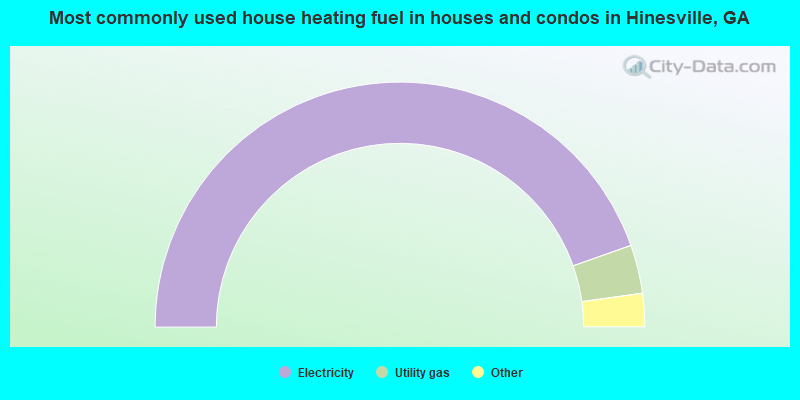
- 89.2%Electricity
- 6.4%Utility gas
- 2.6%No fuel used
- 1.2%Bottled, tank, or LP gas
- 0.3%Fuel oil, kerosene, etc.
- 0.2%Solar energy
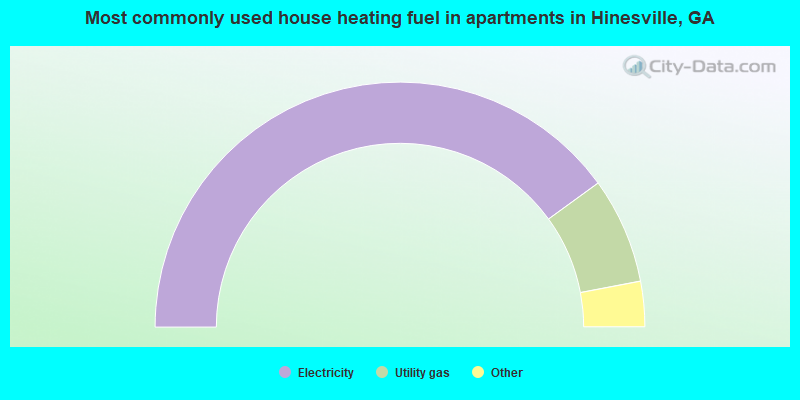
- 80.1%Electricity
- 14.0%Utility gas
- 2.6%Bottled, tank, or LP gas
- 1.3%Wood
- 1.2%No fuel used
- 0.9%Other fuel
Private vs. public school enrollment:
| Here: | 3.8% |
| Georgia: | 12.1% |
| Here: | 8.5% |
| Georgia: | 10.8% |
| Here: | 21.4% |
| Georgia: | 17.1% |


