Races in Hinesville, Georgia (GA) Detailed Stats
Data:
Races - White alone (%)
Races - White alone (% change since 2000)
Races - Black alone (%)
Races - Black alone (% change since 2000)
Races - American Indian alone (%)
Races - American Indian alone (% change since 2000)
Races - Asian alone (%)
Races - Asian alone (% change since 2000)
Races - Hispanic (%)
Races - Hispanic (% change since 2000)
Races - Native Hawaiian and Other Pacific Islander alone (%)
Races - Native Hawaiian and Other Pacific Islander alone (% change since 2000)
Races - Two or more races(%)
Races - Two or more races(% change since 2000)
Races - Other race alone (%)
Races - Other race alone (% change since 2000)
Racial diversity
Place of birth - Born in state of residence (%)
Place of birth - Born in state of residence (%) - White
Place of birth - Born in state of residence (%) - Black or African American
Place of birth - Born in state of residence (%) - Asian
Place of birth - Born in state of residence (%) - Hispanic or Latino
Place of birth - Born in state of residence (%) - American Indian and Alaska Native
Place of birth - Born in state of residence (%) - Multirace
Place of birth - Born in state of residence (%) - Other Race
Place of birth - Born in other state (%)
Place of birth - Born in other state (%) - White
Place of birth - Born in other state (%) - Black or African American
Place of birth - Born in other state (%) - Asian
Place of birth - Born in other state (%) - Hispanic or Latino
Place of birth - Born in other state (%) - American Indian and Alaska Native
Place of birth - Born in other state (%) - Multirace
Place of birth - Born in other state (%) - Other Race
Place of birth - Native, outside of US (%)
Place of birth - Native, outside of US (%) - White
Place of birth - Native, outside of US (%) - Black or African American
Place of birth - Native, outside of US (%) - Asian
Place of birth - Native, outside of US (%) - Hispanic or Latino
Place of birth - Native, outside of US (%) - American Indian and Alaska Native
Place of birth - Native, outside of US (%) - Multirace
Place of birth - Native, outside of US (%) - Other Race
Place of birth - Foreign born (%)
Place of birth - Foreign born (%) - White
Place of birth - Foreign born (%) - Black or African American
Place of birth - Foreign born (%) - Asian
Place of birth - Foreign born (%) - Hispanic or Latino
Place of birth - Foreign born (%) - American Indian and Alaska Native
Place of birth - Foreign born (%) - Multirace
Place of birth - Foreign born (%) - Other Race
Residents speaking English at home (%)
Residents speaking English at home - Born in the United States (%)
Residents speaking English at home - Native, born elsewhere (%)
Residents speaking English at home - Foreign born (%)
Residents speaking Spanish at home (%)
Residents speaking Spanish at home - Born in the United States (%)
Residents speaking Spanish at home - Native, born elsewhere (%)
Residents speaking Spanish at home - Foreign born (%)
Residents speaking other language at home (%)
Residents speaking other language at home - Born in the United States (%)
Residents speaking other language at home - Native, born elsewhere (%)
Residents speaking other language at home - Foreign born (%)
Marital status - Never married (%)
Marital status - Now married (%)
Marital status - Separated (%)
Marital status - Widowed (%)
Marital status - Divorced (%)
Ancestries Reported - Arab (%)
Ancestries Reported - Czech (%)
Ancestries Reported - Danish (%)
Ancestries Reported - Dutch (%)
Ancestries Reported - English (%)
Ancestries Reported - French (%)
Ancestries Reported - French Canadian (%)
Ancestries Reported - German (%)
Ancestries Reported - Greek (%)
Ancestries Reported - Hungarian (%)
Ancestries Reported - Irish (%)
Ancestries Reported - Italian (%)
Ancestries Reported - Lithuanian (%)
Ancestries Reported - Norwegian (%)
Ancestries Reported - Polish (%)
Ancestries Reported - Portuguese (%)
Ancestries Reported - Russian (%)
Ancestries Reported - Scotch-Irish (%)
Ancestries Reported - Scottish (%)
Ancestries Reported - Slovak (%)
Ancestries Reported - Subsaharan African (%)
Ancestries Reported - Swedish (%)
Ancestries Reported - Swiss (%)
Ancestries Reported - Ukrainian (%)
Ancestries Reported - United States (%)
Ancestries Reported - Welsh (%)
Ancestries Reported - West Indian (%)
Ancestries Reported - Other (%)
Geographical mobility - Same house 1 year ago (%)
Geographical mobility - Same house 1 year ago (%) - White
Geographical mobility - Same house 1 year ago (%) - Black or African American
Geographical mobility - Same house 1 year ago (%) - Asian
Geographical mobility - Same house 1 year ago (%) - Hispanic or Latino
Geographical mobility - Same house 1 year ago (%) - American Indian and Alaska Native
Geographical mobility - Same house 1 year ago (%) - Multirace
Geographical mobility - Same house 1 year ago (%) - Other Race
Geographical mobility - Moved within same county (%)
Geographical mobility - Moved within same county (%) - White
Geographical mobility - Moved within same county (%) - Black or African American
Geographical mobility - Moved within same county (%) - Asian
Geographical mobility - Moved within same county (%) - Hispanic or Latino
Geographical mobility - Moved within same county (%) - American Indian and Alaska Native
Geographical mobility - Moved within same county (%) - Multirace
Geographical mobility - Moved within same county (%) - Other Race
Geographical mobility - Moved from different county within same state (%)
Geographical mobility - Moved from different county within same state (%) - White
Geographical mobility - Moved from different county within same state (%) - Black or African American
Geographical mobility - Moved from different county within same state (%) - Asian
Geographical mobility - Moved from different county within same state (%) - Hispanic or Latino
Geographical mobility - Moved from different county within same state (%) - American Indian and Alaska Native
Geographical mobility - Moved from different county within same state (%) - Multirace
Geographical mobility - Moved from different county within same state (%) - Other Race
Geographical mobility - Moved from different state (%)
Geographical mobility - Moved from different state (%) - White
Geographical mobility - Moved from different state (%) - Black or African American
Geographical mobility - Moved from different state (%) - Asian
Geographical mobility - Moved from different state (%) - Hispanic or Latino
Geographical mobility - Moved from different state (%) - American Indian and Alaska Native
Geographical mobility - Moved from different state (%) - Multirace
Geographical mobility - Moved from different state (%) - Other Race
Geographical mobility - Moved from abroad (%)
Geographical mobility - Moved from abroad (%) - White
Geographical mobility - Moved from abroad (%) - Black or African American
Geographical mobility - Moved from abroad (%) - Asian
Geographical mobility - Moved from abroad (%) - Hispanic or Latino
Geographical mobility - Moved from abroad (%) - American Indian and Alaska Native
Geographical mobility - Moved from abroad (%) - Multirace
Geographical mobility - Moved from abroad (%) - Other Race
Place of birth for the foreign-born population - Ireland (%)
Place of birth for the foreign-born population - Denmark (%)
Place of birth for the foreign-born population - Norway (%)
Place of birth for the foreign-born population - Sweden (%)
Place of birth for the foreign-born population - United Kingdom (%)
Place of birth for the foreign-born population - England (%)
Place of birth for the foreign-born population - Scotland (%)
Place of birth for the foreign-born population - Other Northern Europe (%)
Place of birth for the foreign-born population - Austria (%)
Place of birth for the foreign-born population - Belgium (%)
Place of birth for the foreign-born population - France (%)
Place of birth for the foreign-born population - Germany (%)
Place of birth for the foreign-born population - Netherlands (%)
Place of birth for the foreign-born population - Switzerland (%)
Place of birth for the foreign-born population - Other Western Europe (%)
Place of birth for the foreign-born population - Greece (%)
Place of birth for the foreign-born population - Italy (%)
Place of birth for the foreign-born population - Portugal (%)
Place of birth for the foreign-born population - Spain (%)
Place of birth for the foreign-born population - Other Southern Europe (%)
Place of birth for the foreign-born population - Albania (%)
Place of birth for the foreign-born population - Belarus (%)
Place of birth for the foreign-born population - Bosnia and Herzegovina (%)
Place of birth for the foreign-born population - Bulgaria (%)
Place of birth for the foreign-born population - Croatia (%)
Place of birth for the foreign-born population - Czechoslovakia (%)
Place of birth for the foreign-born population - Hungary (%)
Place of birth for the foreign-born population - Latvia (%)
Place of birth for the foreign-born population - Lithuania (%)
Place of birth for the foreign-born population - North Macedonia (Macedonia) (%)
Place of birth for the foreign-born population - Moldova (%)
Place of birth for the foreign-born population - Poland (%)
Place of birth for the foreign-born population - Romania (%)
Place of birth for the foreign-born population - Russia (%)
Place of birth for the foreign-born population - Serbia (%)
Place of birth for the foreign-born population - Ukraine (%)
Place of birth for the foreign-born population - Other Eastern Europe (%)
Place of birth for the foreign-born population - China (%)
Place of birth for the foreign-born population - Hong Kong (%)
Place of birth for the foreign-born population - Taiwan (%)
Place of birth for the foreign-born population - Japan (%)
Place of birth for the foreign-born population - Korea (%)
Place of birth for the foreign-born population - Other Eastern Asia (%)
Place of birth for the foreign-born population - Afghanistan (%)
Place of birth for the foreign-born population - Bangladesh (%)
Place of birth for the foreign-born population - India (%)
Place of birth for the foreign-born population - Iran (%)
Place of birth for the foreign-born population - Kazakhstan (%)
Place of birth for the foreign-born population - Nepal (%)
Place of birth for the foreign-born population - Pakistan (%)
Place of birth for the foreign-born population - Sri Lanka (%)
Place of birth for the foreign-born population - Uzbekistan (%)
Place of birth for the foreign-born population - Other South Central Asia (%)
Place of birth for the foreign-born population - Burma (%)
Place of birth for the foreign-born population - Cambodia (%)
Place of birth for the foreign-born population - Indonesia (%)
Place of birth for the foreign-born population - Laos (%)
Place of birth for the foreign-born population - Malaysia (%)
Place of birth for the foreign-born population - Philippines (%)
Place of birth for the foreign-born population - Singapore (%)
Place of birth for the foreign-born population - Thailand (%)
Place of birth for the foreign-born population - Vietnam (%)
Place of birth for the foreign-born population - Other South Eastern Asia (%)
Place of birth for the foreign-born population - Armenia (%)
Place of birth for the foreign-born population - Iraq (%)
Place of birth for the foreign-born population - Israel (%)
Place of birth for the foreign-born population - Jordan (%)
Place of birth for the foreign-born population - Kuwait (%)
Place of birth for the foreign-born population - Lebanon (%)
Place of birth for the foreign-born population - Saudi Arabia (%)
Place of birth for the foreign-born population - Syria (%)
Place of birth for the foreign-born population - Turkey (%)
Place of birth for the foreign-born population - Yemen (%)
Place of birth for the foreign-born population - Other Western Asia (%)
Place of birth for the foreign-born population - Eritrea (%)
Place of birth for the foreign-born population - Ethiopia (%)
Place of birth for the foreign-born population - Kenya (%)
Place of birth for the foreign-born population - Somalia (%)
Place of birth for the foreign-born population - Uganda (%)
Place of birth for the foreign-born population - Zimbabwe (%)
Place of birth for the foreign-born population - Other Eastern Africa (%)
Place of birth for the foreign-born population - Cameroon (%)
Place of birth for the foreign-born population - Congo (%)
Place of birth for the foreign-born population - Democratic Republic of Congo (Zaire) (%)
Place of birth for the foreign-born population - Other Middle Africa (%)
Place of birth for the foreign-born population - Egypt (%)
Place of birth for the foreign-born population - Morocco (%)
Place of birth for the foreign-born population - Sudan (%)
Place of birth for the foreign-born population - Other Northern Africa (%)
Place of birth for the foreign-born population - South Africa (%)
Place of birth for the foreign-born population - Other Southern Africa (%)
Place of birth for the foreign-born population - Cabo Verde (%)
Place of birth for the foreign-born population - Ghana (%)
Place of birth for the foreign-born population - Liberia (%)
Place of birth for the foreign-born population - Nigeria (%)
Place of birth for the foreign-born population - Senegal (%)
Place of birth for the foreign-born population - Sierra Leone (%)
Place of birth for the foreign-born population - Other Western Africa (%)
Place of birth for the foreign-born population - Australia (%)
Place of birth for the foreign-born population - New Zealand (%)
Place of birth for the foreign-born population - Fiji (%)
Place of birth for the foreign-born population - Micronesia (%)
Place of birth for the foreign-born population - Bahamas (%)
Place of birth for the foreign-born population - Barbados (%)
Place of birth for the foreign-born population - Cuba (%)
Place of birth for the foreign-born population - Dominica (%)
Place of birth for the foreign-born population - Dominican Republic (%)
Place of birth for the foreign-born population - Grenada (%)
Place of birth for the foreign-born population - Haiti (%)
Place of birth for the foreign-born population - Jamaica (%)
Place of birth for the foreign-born population - St. Vincent and the Grenadines (%)
Place of birth for the foreign-born population - Trinidad and Tobago (%)
Place of birth for the foreign-born population - West Indies (%)
Place of birth for the foreign-born population - Other Caribbean (%)
Place of birth for the foreign-born population - Belize (%)
Place of birth for the foreign-born population - Costa Rica (%)
Place of birth for the foreign-born population - El Salvador (%)
Place of birth for the foreign-born population - Guatemala (%)
Place of birth for the foreign-born population - Honduras (%)
Place of birth for the foreign-born population - Mexico (%)
Place of birth for the foreign-born population - Nicaragua (%)
Place of birth for the foreign-born population - Panama (%)
Place of birth for the foreign-born population - Other Central America (%)
Place of birth for the foreign-born population - Argentina (%)
Place of birth for the foreign-born population - Bolivia (%)
Place of birth for the foreign-born population - Brazil (%)
Place of birth for the foreign-born population - Chile (%)
Place of birth for the foreign-born population - Colombia (%)
Place of birth for the foreign-born population - Ecuador (%)
Place of birth for the foreign-born population - Guyana (%)
Place of birth for the foreign-born population - Peru (%)
Place of birth for the foreign-born population - Uruguay (%)
Place of birth for the foreign-born population - Venezuela (%)
Place of birth for the foreign-born population - Other South America (%)
Place of birth for the foreign-born population - Canada (%)
Place of birth for the foreign-born population - Other Northern America (%)
Place of birth for the foreign-born population - Other (%)
Latest news about races in Hinesville, GA collected exclusively by city-data.com from local newspapers, TV, and radio stations
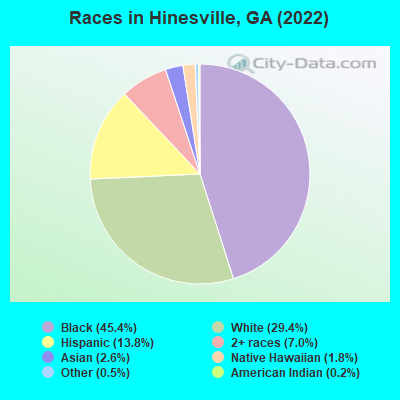
According to 2022 data, the most numerous races in Hinesville, GA are White alone (10,614 residents), Black alone (16,377 residents), and Hispanic (4,973 residents). 83.5% of Hinesville residents speak English at home. 8.3% of Hinesville, GA residents are foreign-born (3.0% born in Latin America, 1.8% born in Asia, 1.8% born in Europe, 1.0% born in Africa), which is 20.0% less than the foreign-born rate of 10.0% across the entire state of Georgia.
Race distribution in Hinesville
2000 2022
5,128,661 62.6% White alone 2,331,465 28.5% Black alone 435,227 5.3% Hispanic 171,513 2.1% Asian alone 87,364 1.1% Two or more races 17,670 0.2% American Indian alone 11,275 0.1% Other race alone 3,278 0.04% Native Hawaiian and Other
5,415,657 49.6% White alone 3,349,240 30.7% Black alone 1,132,604 10.4% Hispanic 479,156 4.4% Asian alone 462,923 4.2% Two or more races 54,416 0.5% Other race alone 11,923 0.1% American Indian alone 6,957 0.06% Native Hawaiian and Other
Income and house value in Hinesville Median household income in 2022 $66,333 White non-Hispanic householders$62,545 Black householders$37,204 American Indian and Alaska Native householders$46,124 Asian householders$3,414 Native Hawaiian and other Pacific Islander householders$59,763 Some other race householders$42,589 Two or more races householders$46,147 Hispanic or Latino race householdersMedian 2022 house value $179,925 White Non-Hispanic householders$181,072 Black or African American householders$169,598 American Indian or Alaska Native householders $153,074 Asian householders$184,974 Native Hawaiian and other Pacific Islander householders$161,565 Some other race householders$170,057 Two or more races householders$157,893 Hispanic or Latino householders
Median age by race in Hinesville
28.3 Median age for White residents26.8 31.0 30.9 Median age for Black or African American residents29.5 32.1 45.9 Median age for American Indian / Alaska Native residents19.8 48.0 46.7 Median age for Asian residents29.0 47.4 4.3 Median age for Native Hawaiian / Pacific Islander residents5.6 25.4 28.4 Median age for Other race residents25.6 28.9 24.0 Median age for Two or more races residents26.3 25.9 29.7 Median age for White alone residents28.1 32.8 29.8 Median age for Hispanic or Latino residents24.7 33.0
Owner/renter occupied households by race in Hinesville
House owners and renters - White residents 2,266 59.4% Owner occupied1,551 40.6% Renter occupiedHouse owners and renters - Black or African American residents 2,665 38.9% Owner occupied4,179 61.1% Renter occupiedHouse owners and renters - American Indian / Alaska Native residents 4 6.4% Owner occupied64 93.6% Renter occupiedHouse owners and renters - Asian residents 302 48.3% Owner occupied324 51.7% Renter occupiedHouse owners and renters - Native Hawaiian / Pacific Islander residents 7 6.6% Owner occupied97 93.4% Renter occupiedHouse owners and renters - Other race residents 192 38.9% Owner occupied302 61.1% Renter occupiedHouse owners and renters - Two or more races residents 827 46.1% Owner occupied965 53.9% Renter occupiedHouse owners and renters - White alone residents 2,078 59.3% Owner occupied1,428 40.7% Renter occupiedHouse owners and renters - Hispanic or Latino residents 1,011 55.6% Owner occupied806 44.4% Renter occupied
Language usage in Hinesville
English speakers - Total 83.5% of residents of Hinesville speak English at home.
9.5% of residents speak Spanish at home 2,174 69.0% Speak English very well976 31.0% Speak English less than very well7.4% of residents speak other language at home 1,641 67.0% Speak English very well808 33.0% Speak English less than very well
English speakers - Born in the United States 93.1% of residents of Hinesville speak English at home.
5.4% of residents speak Spanish at home 765 80.8% Speak English very well182 19.2% Speak English less than very well1.5% of residents speak other language at home 240 88.2% Speak English very well32 11.8% Speak English less than very well
English speakers - Native, born elsewhere 31.4% of residents of Hinesville speak English at home.
57.0% of residents speak Spanish at home 782 70.9% Speak English very well321 29.1% Speak English less than very well4.9% of residents speak other language at home 95 100.0% Speak English very well
English speakers - Foreign-born 12.3% of residents of Hinesville speak English at home.
23.0% of residents speak Spanish at home 283 40.3% Speak English very well420 59.7% Speak English less than very well65.9% of residents speak other language at home 1,221 60.7% Speak English very well789 39.3% Speak English less than very well
White (Caucasian) - Speak only English Native:
91.5% (9,944)Foreign-born:
67.9% (192)
White (Caucasian) - Speak another language Native:
8.9% (966)Foreign-born:
78.4% (221)
Black or African American - Speak only English Native:
97.4% (14,160)Foreign-born:
75.8% (578)
Black or African American - Speak another language Native:
2.6% (384)Foreign-born:
66.8% (509)
Asian - Speak only English Native:
81.5% (215)Foreign-born:
10.3% (59)
Asian - Speak another language Native:
15.4% (41)Foreign-born:
89.8% (509)
Native Hawaiian / Pacific Islander - Speak another language Native:
88.9% (25)Foreign-born:
100.0% (286)
Other race - Speak only English Native:
39.2% (560)Foreign-born:
3.8% (10)
Other race - Speak another language Native:
60.2% (861)Foreign-born:
95.8% (262)
Two or more races - Speak only English Native:
68.5% (2,630)Foreign-born:
2.7% (14)
Two or more races - Speak another language Native:
31.4% (1,204)Foreign-born:
100.0% (520)
White alone - Speak only English Native:
98.3% (8,864)Foreign-born:
44.3% (211)
White alone - Speak another language Native:
1.7% (154)Foreign-born:
55.8% (266)
Hispanic or Latino - Speak only English Native:
45.1% (1,851)Foreign-born:
2.3% (16)
Hispanic or Latino - Speak another language Native:
54.2% (2,224)Foreign-born:
100.0% (697)
Foreign-born residents in Hinesville 3,003 residents are foreign born (3.0% Latin America , 1.8% Asia , 1.8% Europe , 1.0% Africa ).
This city:
8.3%Georgia:
10.4%
Marital status for residents in Hinesville Marital status - White (Caucasian) population 15 years and over
Males 28.9% Never married55.2% Now married2.9% Separated2.0% Widowed11.0% DivorcedFemales 16.7% Never married58.8% Now married1.8% Separated7.3% Widowed15.4% DivorcedWomen who gave birth in the past 12 months Now married:
81.6% (137)Unmarried:
18.4% (31)
Women who did not give birth in the past 12 months Now married:
62.4% (1,769)Unmarried:
37.6% (1,068)
Marital status - Black or African American population 15 years and over
Males 35.7% Never married47.1% Now married3.6% Separated2.3% Widowed11.4% DivorcedFemales 34.6% Never married40.9% Now married3.8% Separated3.7% Widowed17.0% DivorcedWomen who gave birth in the past 12 months Now married:
37.7% (231)Unmarried:
62.3% (382)
Women who did not give birth in the past 12 months Now married:
39.8% (1,651)Unmarried:
60.2% (2,499)
Marital status - American Indian / Alaska Native population 15 years and over
Males 20.7% Never married23.9% Now married0.0% Separated0.0% Widowed55.4% DivorcedFemales 4.8% Never married90.5% Now married0.0% Separated0.0% Widowed4.8% DivorcedWomen who did not give birth in the past 12 months Now married:
66.7% (6)Unmarried:
33.3% (3)
Marital status - Asian population 15 years and over
Males 27.7% Never married62.5% Now married0.0% Separated0.0% Widowed9.8% DivorcedFemales 4.8% Never married76.7% Now married0.0% Separated16.6% Widowed1.9% DivorcedWomen who did not give birth in the past 12 months Now married:
82.4% (121)Unmarried:
17.6% (26)
Marital status - Native Hawaiian / Pacific Islander population 15 years and over
Males 0.0% Never married100.0% Now married0.0% Separated0.0% Widowed0.0% DivorcedFemales 0.0% Never married100.0% Now married0.0% Separated0.0% Widowed0.0% DivorcedWomen who gave birth in the past 12 months Now married:
100.0% (21)Unmarried:
0.0% (0)
Women who did not give birth in the past 12 months Now married:
100.0% (92)Unmarried:
0.0% (0)
Marital status - Other race population 15 years and over
Males 41.4% Never married47.8% Now married10.4% Separated0.0% Widowed0.4% DivorcedFemales 28.4% Never married45.7% Now married14.1% Separated1.6% Widowed10.2% DivorcedWomen who gave birth in the past 12 months Now married:
100.0% (14)Unmarried:
0.0% (0)
Women who did not give birth in the past 12 months Now married:
62.3% (414)Unmarried:
37.7% (250)
Marital status - Two or more races population 15 years and over
Males 55.0% Never married26.5% Now married8.0% Separated0.0% Widowed10.5% DivorcedFemales 53.4% Never married25.0% Now married4.5% Separated7.0% Widowed10.1% DivorcedWomen who gave birth in the past 12 months Now married:
34.7% (25)Unmarried:
65.3% (47)
Women who did not give birth in the past 12 months Now married:
20.7% (280)Unmarried:
79.3% (1,070)
Marital status - White alone, not Hispanic / Latino population 15 years and over
Males 28.6% Never married55.9% Now married3.1% Separated2.2% Widowed10.3% DivorcedFemales 15.6% Never married58.3% Now married0.8% Separated8.1% Widowed17.2% DivorcedWomen who gave birth in the past 12 months Now married:
77.5% (105)Unmarried:
22.5% (30)
Women who did not give birth in the past 12 months Now married:
61.8% (1,510)Unmarried:
38.2% (934)
Marital status - Hispanic or Latino population 15 years and over
Males 40.9% Never married45.0% Now married4.9% Separated0.0% Widowed9.2% DivorcedFemales 25.7% Never married52.0% Now married10.8% Separated6.1% Widowed5.4% DivorcedWomen who gave birth in the past 12 months Now married:
100.0% (60)Unmarried:
0.0% (0)
Women who did not give birth in the past 12 months Now married:
63.0% (791)Unmarried:
37.0% (466)
Ancestries in Hinesville
1,001 5.1% English667 3.4% American464 2.3% German386 2.0% Jamaican319 1.6% Irish264 1.3% West Indian261 1.3% European246 1.2% African191 1.0% Italian172 0.9% Ghanaian148 0.7% Nigerian136 0.7% German Russian107 0.5% Norwegian91 0.5% Haitian79 0.4% Scandinavian77 0.4% British57 0.3% French Canadian51 0.3% French45 0.2% Czech45 0.2% Scotch-Irish43 0.2% Portuguese41 0.2% Polish36 0.2% Eastern European24 0.1% Iranian18 0.09% Dutch11 0.06% Scottish10 0.05% Russian9 0.05% Canadian9 0.05% Greek8 0.04% Barbadian7 0.04% Guyanese7 0.04% Slavic7 0.04% U.S. Virgin Islander6 0.03% Danish
Geographical mobility in Hinesville Same house 1 year ago 9,218 77.6% White (Caucasian)13,377 83.1% Black or African American152 92.4% American Indian / Alaska Native507 58.4% Asian336 100.0% Native Hawaiian / Pacific Islander1,515 78.7% Other race3,726 77.9% Two or more races8,210 78.8% White alone, not Hispanic / Latino3,341 69.0% Hispanic or LatinoMoved within same county 653 5.5% White / Caucasian652 4.0% Black or African American5 3.1% American Indian / Alaska Native224 25.8% Asian123 6.4% Other race276 5.8% Two or more races513 4.9% White alone, not Hispanic / Latino153 3.2% Hispanic or LatinoMoved within same state 1,331 11.2% White / Caucasian1,117 6.9% Black or African American7 4.4% American Indian / Alaska Native89 10.3% Asian42 2.2% Other race407 8.5% Two or more races1,005 9.6% White alone, not Hispanic / Latino674 13.9% Hispanic or LatinoMoved from different state 631 5.3% White / Caucasian805 5.0% Black or African American192 10.0% Other race437 9.1% Two or more races571 5.5% White alone, not Hispanic / Latino724 14.9% Hispanic or LatinoMoved from abroad 158 1.3% White112 0.7% Black or African American19 1.0% Other race131 2.7% Two or more races161 1.5% White alone, not Hispanic / Latino32 0.7% Hispanic or Latino
Children Nativity (place of birth) in Hinesville
Children under 6 years - Living with two parents Both parents native 1,064 100.0% NativeBoth parents foreign-born 67 100.0% NativeOne native, one foreign-born parent 345 100.0% NativeChildren under 6 years - Living with one parent Native parent 1,877 99.4% Native12 0.6% Foreign-bornForeign-born parent 98 35.4% Native180 64.6% Foreign-bornChildren 6 to 17 years - Living with two parents Both parents native 2,046 100.0% NativeBoth parents foreign-born 162 62.0% Native99 38.0% Foreign-bornOne native, one foreign-born parent 173 66.2% Native88 33.8% Foreign-bornChildren 6 to 17 years - Living with one parent Native parent 2,903 100.0% NativeForeign-born parent 253 51.9% Native235 48.1% Foreign-born
Grandparents responsible for own grandchildren in Hinesville
Grandparents (30 to 59 years) White / Caucasian 106 81.6% Responsible for grandchildren24 18.4% Not responsible for grandchildrenBlack or African American 134 65.3% Responsible for grandchildren71 34.7% Not responsible for grandchildrenTwo or more races 8 100.0% Not responsible for grandchildrenWhite alone, not Hispanic / Latino 109 81.0% Responsible for grandchildren26 19.0% Not responsible for grandchildrenGrandparents (60 years and over) White / Caucasian 25 33.9% Responsible for grandchildren49 66.1% Not responsible for grandchildrenBlack or African American 66 39.1% Responsible for grandchildren102 60.9% Not responsible for grandchildrenTwo or more races 7 100.0% Not responsible for grandchildrenWhite alone, not Hispanic / Latino 25 32.8% Responsible for grandchildren51 67.2% Not responsible for grandchildren