Hickory, NC (North Carolina) Houses and Residents
| Hickory: | $283,332 |
| North Carolina: | $280,600 |
Mean price in 2022:
Detached houses: $320,530
Here: $320,530 State: $375,326 Townhouses or other attached units: $611,479
Here: $611,479 State: $317,935 In 2-unit structures: $162,551
Here: $162,551 State: $250,488 In 3-to-4-unit structures: $218,492
Here: $218,492 State: $254,939 In 5-or-more-unit structures: $166,709
Here: $166,709 State: $329,290 Mobile homes: $26,193
Here: $26,193 State: $124,933
Total population: 40,143 (Urban population: 37,214, Rural population: 297 (all nonfarm))
Houses: 20,082 (18,102 occupied: 9,885 owner occupied, 8,543 renter occupied)
| % of renters here: | 46% |
| State: | 33% |
Housing density: 715 houses/condos per square mile
Median price asked for vacant for-sale houses and condos in 2022: $219,342.
Median contract rent in 2022: $803 (lower quartile is $565, upper quartile is $1,008)
Median rent asked for vacant for-rent units in 2022: $1,614
Median gross rent in Hickory, NC in 2022: $920
Housing units in Hickory with a mortgage: 6,808 (553 second mortgage, 0 home equity loan, 572 both second mortgage and home equity loan)
Houses without a mortgage: 168
Median household income for houses/condos with a mortgage: $89,322
Median household income for apartments without a mortgage: $60,411
Median monthly housing costs: $917
Compare current foreclosures in Hickory, NC:
| Photo | Address | Area | Beds / Baths | Price | Details |
|---|---|---|---|---|---|

|
#1
Spring Meadow Dr
Hickory, NC 28601
|
1,056 sq. feet
|
1 baths 2 beds |
show details | |

|
#2
6th St NW
Hickory, NC 28601
|
5,860 sq. feet
|
6 baths 6 beds |
show details | |

|
#3
Riverview Dr
Hickory, NC 28602
|
1,050 sq. feet
|
1 baths 3 beds |
show details | |

|
#4
15th St SE
Hickory, NC 28602
|
1,140 sq. feet
|
1 baths 2 beds |
show details | |

|
#5
R P Whitener Ln
Hickory, NC 28602
|
1,512 sq. feet
|
2 baths 3 beds |
show details | |

|
#6
32nd St SW
Hickory, NC 28602
|
1,268 sq. feet
|
1 baths 2 beds |
show details | |

|
#7
37th Street Ct NE
Hickory, NC 28601
|
1,275 sq. feet
|
2 baths 3 beds |
show details | |

|
#8
4th Ave NW
Hickory, NC 28601
|
1,064 sq. feet
|
2 baths 3 beds |
show details | |

|
#9
12th St NE
Hickory, NC 28601
|
1,423 sq. feet
|
2 baths 2 beds |
show details | |

|
#10
Wallace Dairy Rd
Hickory, NC 28602
|
1,530 sq. feet
|
2 baths 2 beds |
show details |
| Photo | Address | Area | Beds / Baths | Price | Details |
|---|---|---|---|---|---|

|
#11
Midway Sand Rd
Hickory, NC 28601
|
918 sq. feet
|
1 baths 2 beds |
show details | |

|
#12
Stonewood Dr
Hickory, NC 28602
|
1,480 sq. feet
|
2 baths 3 beds |
show details | |

|
#13
Section House Rd
Hickory, NC 28601
|
2,244 sq. feet
|
2 baths 3 beds |
show details | |

|
#14
37th St SW
Hickory, NC 28602
|
904 sq. feet
|
1 baths 3 beds |
show details | |

|
#15
8th Street Pl SE
Hickory, NC 28602
|
1,456 sq. feet
|
2 baths 3 beds |
show details | |

|
#16
Pioneer Dr
Hickory, NC 28601
|
894 sq. feet
|
1 baths 2 beds |
show details | |

|
#17
23rd Ave NE
Hickory, NC 28601
|
1,440 sq. feet
|
2 baths 3 beds |
show details | |

|
#18
12th Street Dr NE
Hickory, NC 28601
|
1,879 sq. feet
|
2 baths 3 beds |
show details | |

|
#19
Main Avenue Dr NW
Hickory, NC 28601
|
1,232 sq. feet
|
1 baths 3 beds |
show details | |

|
#20
15th St SE
Hickory, NC 28602
|
1,225 sq. feet
|
1 baths 3 beds |
show details |
| Photo | Address | Area | Beds / Baths | Price | Details |
|---|---|---|---|---|---|

|
#21
Main Avenue Dr NW
Hickory, NC 28601
|
1,274 sq. feet
|
1 baths 2 beds |
show details | |

|
#22
Riverview Dr
Hickory, NC 28602
|
1,050 sq. feet
|
1 baths 3 beds |
show details | |

|
#23
14th Street Pl NE
Hickory, NC 28601
|
1,443 sq. feet
|
2 baths 3 beds |
show details | |

|
#24
16th St NE
Hickory, NC 28601
|
1,289 sq. feet
|
2 baths 2 beds |
show details | |

|
#25
21st Ave NE
Hickory, NC 28601
|
780 sq. feet
|
1 baths 2 beds |
show details | |

|
#26
13th St NE
Hickory, NC 28601
|
1,196 sq. feet
|
1 baths 3 beds |
show details | |

|
#27
Liberty Church Rd
Hickory, NC 28601
|
2,042 sq. feet
|
2 baths 4 beds |
show details | |

|
#28
Moss Farm Rd
Hickory, NC 28602
|
1,470 sq. feet
|
1 baths 3 beds |
show details | |

|
#29
48th Avenue Ln NE
Hickory, NC 28601
|
2,306 sq. feet
|
2 baths 3 beds |
show details | |

|
#30
20th Street Pl NE
Hickory, NC 28601
|
1,300 sq. feet
|
2 baths 3 beds |
show details |
| Photo | Address | Area | Beds / Baths | Price | Details |
|---|---|---|---|---|---|

|
#31
29th St NE
Hickory, NC 28601
|
1,066 sq. feet
|
1 baths 3 beds |
show details | |

|
#32
Hunter Ct
Hickory, NC 28601
|
1,404 sq. feet
|
1 baths - beds |
show details | |

|
#33
17th Street Pl NW Apt C2
Hickory, NC 28601
|
- sq. feet
|
- baths - beds |
show details | |

|
#34
Goat Farm St
Hickory, NC 28601
|
- sq. feet
|
- baths - beds |
show details | |

|
#35
12th Ave NE Apt O
Hickory, NC 28601
|
- sq. feet
|
- baths - beds |
show details | |

|
#36
5th St NE Apt 222
Hickory, NC 28601
|
- sq. feet
|
- baths - beds |
show details | |

|
#37
Alexander Heritage Dr
Hickory, NC 28601
|
- sq. feet
|
- baths - beds |
show details | |

|
#38
Henry River Rd
Hickory, NC 28602
|
- sq. feet
|
- baths - beds |
show details | |

|
#39
Heritage Farm Rd
Hickory, NC 28601
|
- sq. feet
|
- baths - beds |
show details | |

|
#40
21st St SE Apt 25
Hickory, NC 28602
|
- sq. feet
|
- baths - beds |
show details |
| Photo | Address | Area | Beds / Baths | Price | Details |
|---|---|---|---|---|---|

|
#41
37th St SW
Hickory, NC 28602
|
- sq. feet
|
- baths - beds |
show details | |

|
#42
14th St NE
Hickory, NC 28601
|
- sq. feet
|
- baths - beds |
show details | |

|
#43
7th Ave SE
Hickory, NC 28602
|
- sq. feet
|
- baths - beds |
show details | |

|
#44
20th Avenue Dr NE Apt 108
Hickory, NC 28601
|
- sq. feet
|
- baths - beds |
show details | |

|
#45
1st Ave NW
Hickory, NC 28601
|
- sq. feet
|
- baths - beds |
show details | |

|
#46
B Henry Smith Street
Hickory, NC 28601
|
- sq. feet
|
- baths - beds |
show details | |

|
#47
F Ave SE
Hickory, NC 28602
|
- sq. feet
|
- baths - beds |
show details | |

|
#48
Gold Creek Estate Dr
Hickory, NC 28601
|
- sq. feet
|
- baths - beds |
show details | |

|
#49
Tenth Street NE
Hickory, NC 28602
|
- sq. feet
|
- baths - beds |
show details | |

|
Check over 1 million property listings on Foreclosure.com!
|
browse all offers | |||

Latest news about housing in Hickory, NC collected exclusively by city-data.com from local newspapers, TV, and radio stations

 | Hickory as home (7 replies) |
| Political Climate Morganton, Hickory,Lenior (48 replies) |
| Need a Little Help on Hickory Glen in Durham (0 replies) |
| Rental Homes in Hickory area (2 replies) |
| Looking for a Home to Rent in Mountainview Area of Hickory (2 replies) |
| Old Hickory House Closing (11 replies) |

Median year apartment built: 1987
Household type by relationship:
Households: 44,011- Male householders: 9,257 (2,877 living alone), Female householders: 8,674 (2,945 living alone)
7,323 spouses (7,282 opposite-sex spouses), 1,609 unmarried partners, (1,416 opposite-sex unmarried partners), 11,715 children (10,806 natural, 255 adopted, 653 stepchildren), 657 grandchildren, 734 brothers or sisters, 624 parents, 0 foster children, 341 other relatives, 1,440 non-relatives
- In group quarters: 1,633
Size of family households: 4,669 2-persons, 2,929 3-persons, 2,424 4-persons, 1,023 5-persons, 121 6-persons, 87 7-or-more-persons.
Size of nonfamily households: 5,838 1-person, 1,364 2-persons, 70 3-persons, 72 4-persons.
5,258 married couples with children.
3,440 single-parent households (373 men, 3,067 women).
85.2% of residents of Hickory speak English at home.
10.2% of residents speak Spanish at home (62% speak English very well, 23% speak English well, 11% speak English not well, 5% don't speak English at all).
1.2% of residents speak other Indo-European language at home (90% speak English very well, 9% speak English well, 1% speak English not well).
3.1% of residents speak Asian or Pacific Island language at home (67% speak English very well, 15% speak English well, 13% speak English not well, 6% don't speak English at all).
0.2% of residents speak other language at home (100% speak English very well).
Foreign born population: 4,054 (9.2%)
(44.0% of them are naturalized citizens)
| Here: | 6.7 |
| State: | 6.4 |
| Here: | 3.9 |
| State: | 4.4 |

- Bedrooms in owner-occupied houses and condos in Hickory, North Carolina
- 0no bedroom
- 751 bedroom
- 1,8672 bedrooms
- 4,5913 bedrooms
- 2,4444 bedrooms
- 9105+ bedrooms

- Bedrooms in renter-occupied apartments in Hickory, North Carolina
- 218no bedroom
- 1,7211 bedroom
- 4,5842 bedrooms
- 1,4723 bedrooms
- 4764 bedrooms
- 735+ bedrooms

- Cars and other vehicles available in Hickory in owner-occupied houses/condos
- 234no vehicle
- 2,4601 vehicle
- 4,2452 vehicles
- 2,0303 vehicles
- 7444 vehicles
- 1725+ vehicles

- Cars and other vehicles available in Hickory in renter-occupied apartments
- 1,023no vehicle
- 4,0311 vehicle
- 2,6892 vehicles
- 5293 vehicles
- 2234 vehicles
- 495+ vehicles

- Rooms in owner-occupied houses in Hickory, North Carolina
- 01 room
- 02 rooms
- 773 rooms
- 8104 rooms
- 1,4585 rooms
- 2,2946 rooms
- 1,4047 rooms
- 1,3088 rooms
- 2,5349+ rooms

- Rooms in renter-occupied apartments in Hickory, North Carolina
- 2121 room
- 5492 rooms
- 1,7233 rooms
- 3,2434 rooms
- 1,4035 rooms
- 8586 rooms
- 2477 rooms
- 2258 rooms
- 839+ rooms


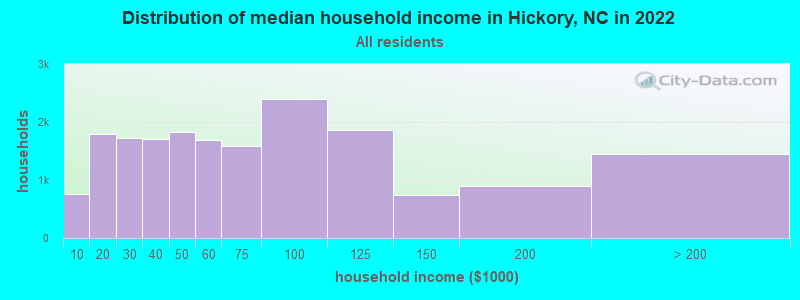
Hickory, NC household income distribution

- 751Less than $10,000
- 1,786$10,000 to $19,999
- 1,718$20,000 to $29,999
- 1,708$30,000 to $39,999
- 1,828$40,000 to $49,999
- 1,687$50,000 to $59,999
- 1,588$60,000 to $74,999
- 2,395$75,000 to $99,999
- 1,862$100,000 to $124,999
- 733$125,000 to $149,999
- 903$150,000 to $199,999
- 1,450$200,000 or more
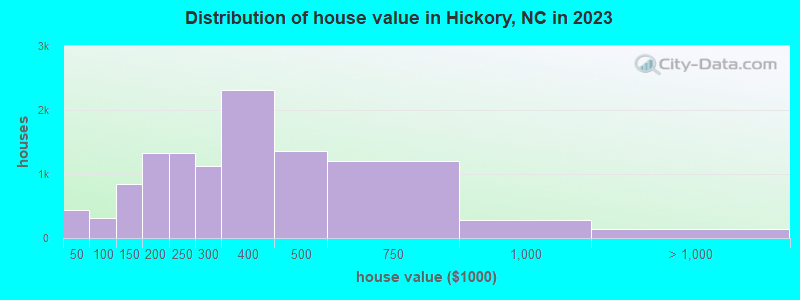
Home value of owner - occupied houses in 2022 in Hickory, NC
-
- 182Less than $10,000
- 12$10,000 to $14,999
- 148$15,000 to $19,999
- 19$20,000 to $24,999
- 15$25,000 to $29,999
- 64$30,000 to $34,999
- 36$40,000 to $49,999
- 140$50,000 to $59,999
- 135$60,000 to $69,999
- 49$70,000 to $79,999
- 171$80,000 to $89,999
- 130$90,000 to $99,999
- 727$100,000 to $124,999
- 460$125,000 to $149,999
- 546$150,000 to $174,999
- 466$175,000 to $199,999
- 1,635$200,000 to $249,999
- 1,310$250,000 to $299,999
- 2,558$300,000 to $399,999
- 1,279$400,000 to $499,999
- 639$500,000 to $749,999
- 139$750,000 to $999,999
- 63$1,000,000 to $1,499,999
- 45$1,500,000 to $1,999,999
- 19$2,000,000 or more
Rent paid by renters in 2022 in Hickory, NC
-
- 139Less than $100
- 167$100 to $149
- 6$150 to $199
- 225$200 to $249
- 81$250 to $299
- 126$300 to $349
- 262$350 to $399
- 306$400 to $449
- 213$450 to $499
- 321$500 to $549
- 589$550 to $599
- 332$600 to $649
- 301$650 to $699
- 499$700 to $749
- 486$750 to $799
- 1,037$800 to $899
- 695$900 to $999
- 1,010$1,000 to $1,249
- 593$1,250 to $1,499
- 189$1,500 to $1,999
- 14$2,000 to $2,499
- 53$3,000 to $3,499
- 31$3,500 or more
- 205No cash rent


Percentage of workers working in this county: 74.8%
Number of people working at home: 2,669 (13.0% of all workers)
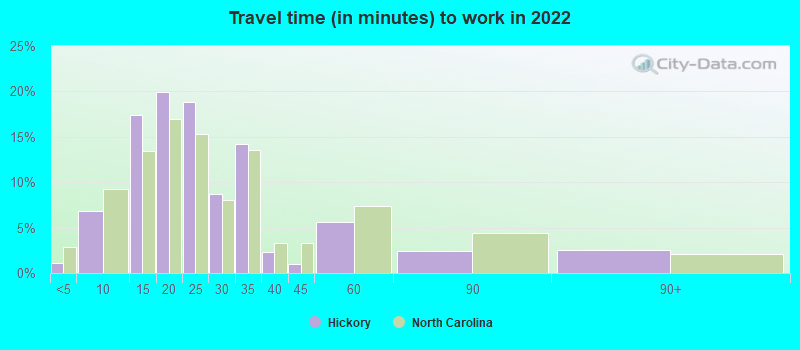
Travel time to work (commute)
- Less than 5 minutes: 491
- 5 to 9 minutes: 2,426
- 10 to 14 minutes: 4,445
- 15 to 19 minutes: 3,640
- 20 to 24 minutes: 2,071
- 25 to 29 minutes: 979
- 30 to 34 minutes: 1,732
- 35 to 39 minutes: 444
- 40 to 44 minutes: 277
- 45 to 59 minutes: 592
- 60 to 89 minutes: 642
- 90 or more minutes: 241
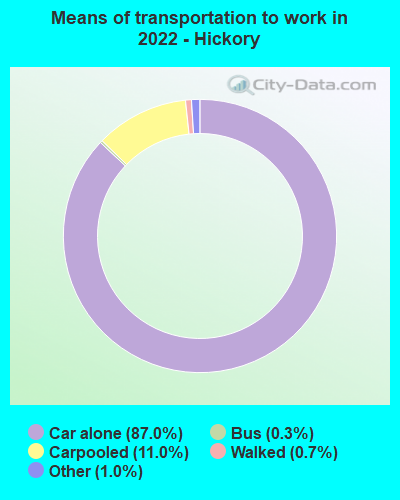
Means of transportation to work:
- Drove a car alone: 35,227 (78.7%)
- Carpooled: 4,661 (10.4%)
- Bus: 83 (0.2%)
- Taxi: 404 (0.9%)
- Bicycle: 24 (0.1%)
- Walked: 297 (0.7%)
- Worked at home: 2,669 (6.0%)

- Unemployment by race in 2022
- Unemployment rate for White non-Hispanic residents
- 5.2%Males
- 3.4%Females
- Unemployment rate for Black residents
- 3.3%Males
- 13.8%Females
- Unemployment rate for other race residents
- 5.6%Males
- 6.9%Females
- Unemployment rate for two or more race residents
- 11.4%Males
- Unemployment rate for Hispanic or Latino residents
- 11.4%Males
- 2.1%Females

- Year of entry for the foreign-born population in Hickory, North Carolina
- 8962010 or later
- 1,7592000 to 2009
- 8331990 to 1999
- 9041980 to 1989
- 2751970 to 1979
- 137Before 1970

First ancestries reported:
- American: 4,113 (15.7%)
- English: 4,018 (15.4%)
- German: 2,306 (8.8%)
- Irish: 1,152 (4.4%)
- European: 998 (3.8%)
- Scottish: 656 (2.5%)
- Italian: 649 (2.5%)
- Scotch-Irish: 468 (1.8%)
- Polish: 368 (1.4%)
- African: 321 (1.2%)
- French: 149 (0.6%)
- Dutch: 137 (0.5%)
- British: 136 (0.5%)
- Romanian: 110 (0.4%)
- Northern European: 93 (0.4%)
- Norwegian: 86 (0.3%)
- French Canadian: 84 (0.3%)
- Brazilian: 62 (0.2%)
- Swedish: 59 (0.2%)
- Jamaican: 54 (0.2%)
- Welsh: 52 (0.2%)
- Hungarian: 43 (0.2%)
- Albanian: 41 (0.2%)
- Danish: 31 (0.1%)
- Lebanese: 30 (0.1%)
- Ukrainian: 30 (0.1%)
- Iranian: 27 (0.1%)
- Greek: 24 (0.09%)
- Eastern European: 20 (0.08%)
- Scandinavian: 12 (0.05%)
- Slovene: 12 (0.05%)
- Austrian: 11 (0.04%)
- Portuguese: 9 (0.03%)
- Estonian: 9 (0.03%)
- Egyptian: 7 (0.03%)
- Finnish: 7 (0.03%)
- Czech: 5 (0.02%)
Most common places of birth for foreign-born residents (%):
| Hickory: | 41.4% (1,691) |
| North Carolina: | 24.7% (214,776) |
| Hickory: | 8.5% (346) |
| North Carolina: | 1.1% (9,831) |
| Hickory: | 4.0% (163) |
| North Carolina: | 0.3% (2,274) |
| Hickory: | 3.7% (153) |
| North Carolina: | 2.9% (24,965) |
| Hickory: | 3.6% (145) |
| North Carolina: | 4.7% (40,707) |
| Hickory: | 3.5% (141) |
| North Carolina: | 0.4% (3,710) |
| Hickory: | 2.9% (117) |
| North Carolina: | 2.6% (22,964) |
| Hickory: | 2.7% (111) |
| North Carolina: | 1.0% (8,426) |
| Hickory: | 2.6% (108) |
| North Carolina: | 3.8% (33,379) |
| Hickory: | 2.5% (101) |
| North Carolina: | 0.2% (1,682) |
| Hickory: | 2.3% (92) |
| North Carolina: | 9.3% (80,594) |
| Hickory: | 2.0% (83) |
| North Carolina: | 1.2% (10,140) |
| Hickory: | 1.8% (74) |
| North Carolina: | 0.4% (3,093) |
| Hickory: | 1.6% (65) |
| North Carolina: | 3.2% (27,477) |
| Hickory: | 1.5% (62) |
| North Carolina: | 0.7% (6,161) |
Place of birth for U.S.-born residents:
- This state: 25,491
- Other state: 14,335
- Northeast: 3,736
- Midwest: 2,605
- South: 6,858
- West: 1,160
82.9% of Hickory residents lived in the same house 1 years ago.
Out of people who lived in different houses, 28.1% lived in this county.
Out of people who lived in different counties, 58.7% lived in North Carolina.
| Hickory: | 82.9% |
| State average: | 87.3% |
Education attainment for males 25 years and older:
- No schooling: 181
- Nursery to 4th grade: 0
- 5th and 6th grade: 87
- 7th and 8th grade: 201
- 9th grade: 276
- 10th grade: 260
- 11th grade: 216
- 12th grade, no diploma: 119
- High school graduate (or equivalency): 3,348
- Less than 1 year of college: 751
- Some college more than 1 year, no degree: 1,720
- Associate degree: 1,311
- Bachelor's degree: 3,944
- Master's degree: 1,115
- Professional school degree: 438
- Doctorate degree: 124

Education attainment for females 25 years and older:
- No schooling: 194
- Nursery to 4th grade: 186
- 5th and 6th grade: 100
- 7th and 8th grade: 126
- 9th grade: 206
- 10th grade: 184
- 11th grade: 178
- 12th grade, no diploma: 222
- High school graduate (or equivalency): 3,642
- Less than 1 year of college: 1,372
- Some college more than 1 year, no degree: 1,883
- Associate degree: 2,041
- Bachelor's degree: 3,722
- Master's degree: 1,410
- Professional school degree: 282
- Doctorate degree: 249


Housing units in structures:
- One, detached: 10,921
- One, attached: 943
- Two: 816
- 3 or 4: 1,485
- 5 to 9: 1,910
- 10 to 19: 1,774
- 20 to 49: 655
- 50 or more: 790
- Mobile homes: 785
Median worth of mobile homes: $20,000
Housing units lacking complete kitchen facilities in 2022: 2.3%
House/condo owner moved in on average 10 years ago
Renter moved in on average 2 years ago

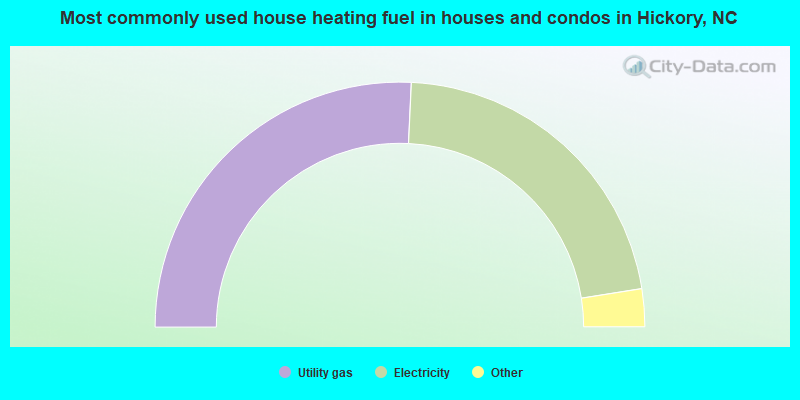
- 51.5%Utility gas
- 43.5%Electricity
- 3.4%Fuel oil, kerosene, etc.
- 0.7%Other fuel
- 0.5%Bottled, tank, or LP gas
- 0.4%Wood
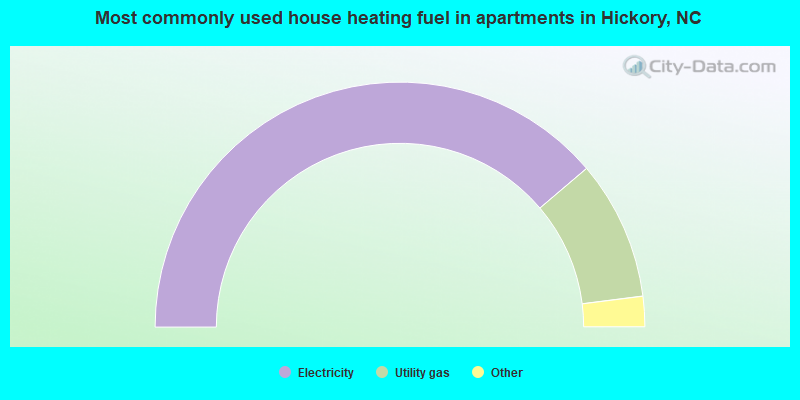
- 77.6%Electricity
- 18.4%Utility gas
- 1.5%Bottled, tank, or LP gas
- 1.4%No fuel used
- 0.8%Fuel oil, kerosene, etc.
- 0.3%Wood
Private vs. public school enrollment:
| Here: | 10.6% |
| North Carolina: | 13.8% |
| Here: | 17.0% |
| North Carolina: | 11.9% |
| Here: | 46.6% |
| North Carolina: | 19.3% |


