Races in Hickory, North Carolina (NC) Detailed Stats
Data:
Races - White alone (%)
Races - White alone (% change since 2000)
Races - Black alone (%)
Races - Black alone (% change since 2000)
Races - American Indian alone (%)
Races - American Indian alone (% change since 2000)
Races - Asian alone (%)
Races - Asian alone (% change since 2000)
Races - Hispanic (%)
Races - Hispanic (% change since 2000)
Races - Native Hawaiian and Other Pacific Islander alone (%)
Races - Native Hawaiian and Other Pacific Islander alone (% change since 2000)
Races - Two or more races(%)
Races - Two or more races(% change since 2000)
Races - Other race alone (%)
Races - Other race alone (% change since 2000)
Racial diversity
Place of birth - Born in state of residence (%)
Place of birth - Born in state of residence (%) - White
Place of birth - Born in state of residence (%) - Black or African American
Place of birth - Born in state of residence (%) - Asian
Place of birth - Born in state of residence (%) - Hispanic or Latino
Place of birth - Born in state of residence (%) - American Indian and Alaska Native
Place of birth - Born in state of residence (%) - Multirace
Place of birth - Born in state of residence (%) - Other Race
Place of birth - Born in other state (%)
Place of birth - Born in other state (%) - White
Place of birth - Born in other state (%) - Black or African American
Place of birth - Born in other state (%) - Asian
Place of birth - Born in other state (%) - Hispanic or Latino
Place of birth - Born in other state (%) - American Indian and Alaska Native
Place of birth - Born in other state (%) - Multirace
Place of birth - Born in other state (%) - Other Race
Place of birth - Native, outside of US (%)
Place of birth - Native, outside of US (%) - White
Place of birth - Native, outside of US (%) - Black or African American
Place of birth - Native, outside of US (%) - Asian
Place of birth - Native, outside of US (%) - Hispanic or Latino
Place of birth - Native, outside of US (%) - American Indian and Alaska Native
Place of birth - Native, outside of US (%) - Multirace
Place of birth - Native, outside of US (%) - Other Race
Place of birth - Foreign born (%)
Place of birth - Foreign born (%) - White
Place of birth - Foreign born (%) - Black or African American
Place of birth - Foreign born (%) - Asian
Place of birth - Foreign born (%) - Hispanic or Latino
Place of birth - Foreign born (%) - American Indian and Alaska Native
Place of birth - Foreign born (%) - Multirace
Place of birth - Foreign born (%) - Other Race
Residents speaking English at home (%)
Residents speaking English at home - Born in the United States (%)
Residents speaking English at home - Native, born elsewhere (%)
Residents speaking English at home - Foreign born (%)
Residents speaking Spanish at home (%)
Residents speaking Spanish at home - Born in the United States (%)
Residents speaking Spanish at home - Native, born elsewhere (%)
Residents speaking Spanish at home - Foreign born (%)
Residents speaking other language at home (%)
Residents speaking other language at home - Born in the United States (%)
Residents speaking other language at home - Native, born elsewhere (%)
Residents speaking other language at home - Foreign born (%)
Marital status - Never married (%)
Marital status - Now married (%)
Marital status - Separated (%)
Marital status - Widowed (%)
Marital status - Divorced (%)
Ancestries Reported - Arab (%)
Ancestries Reported - Czech (%)
Ancestries Reported - Danish (%)
Ancestries Reported - Dutch (%)
Ancestries Reported - English (%)
Ancestries Reported - French (%)
Ancestries Reported - French Canadian (%)
Ancestries Reported - German (%)
Ancestries Reported - Greek (%)
Ancestries Reported - Hungarian (%)
Ancestries Reported - Irish (%)
Ancestries Reported - Italian (%)
Ancestries Reported - Lithuanian (%)
Ancestries Reported - Norwegian (%)
Ancestries Reported - Polish (%)
Ancestries Reported - Portuguese (%)
Ancestries Reported - Russian (%)
Ancestries Reported - Scotch-Irish (%)
Ancestries Reported - Scottish (%)
Ancestries Reported - Slovak (%)
Ancestries Reported - Subsaharan African (%)
Ancestries Reported - Swedish (%)
Ancestries Reported - Swiss (%)
Ancestries Reported - Ukrainian (%)
Ancestries Reported - United States (%)
Ancestries Reported - Welsh (%)
Ancestries Reported - West Indian (%)
Ancestries Reported - Other (%)
Geographical mobility - Same house 1 year ago (%)
Geographical mobility - Same house 1 year ago (%) - White
Geographical mobility - Same house 1 year ago (%) - Black or African American
Geographical mobility - Same house 1 year ago (%) - Asian
Geographical mobility - Same house 1 year ago (%) - Hispanic or Latino
Geographical mobility - Same house 1 year ago (%) - American Indian and Alaska Native
Geographical mobility - Same house 1 year ago (%) - Multirace
Geographical mobility - Same house 1 year ago (%) - Other Race
Geographical mobility - Moved within same county (%)
Geographical mobility - Moved within same county (%) - White
Geographical mobility - Moved within same county (%) - Black or African American
Geographical mobility - Moved within same county (%) - Asian
Geographical mobility - Moved within same county (%) - Hispanic or Latino
Geographical mobility - Moved within same county (%) - American Indian and Alaska Native
Geographical mobility - Moved within same county (%) - Multirace
Geographical mobility - Moved within same county (%) - Other Race
Geographical mobility - Moved from different county within same state (%)
Geographical mobility - Moved from different county within same state (%) - White
Geographical mobility - Moved from different county within same state (%) - Black or African American
Geographical mobility - Moved from different county within same state (%) - Asian
Geographical mobility - Moved from different county within same state (%) - Hispanic or Latino
Geographical mobility - Moved from different county within same state (%) - American Indian and Alaska Native
Geographical mobility - Moved from different county within same state (%) - Multirace
Geographical mobility - Moved from different county within same state (%) - Other Race
Geographical mobility - Moved from different state (%)
Geographical mobility - Moved from different state (%) - White
Geographical mobility - Moved from different state (%) - Black or African American
Geographical mobility - Moved from different state (%) - Asian
Geographical mobility - Moved from different state (%) - Hispanic or Latino
Geographical mobility - Moved from different state (%) - American Indian and Alaska Native
Geographical mobility - Moved from different state (%) - Multirace
Geographical mobility - Moved from different state (%) - Other Race
Geographical mobility - Moved from abroad (%)
Geographical mobility - Moved from abroad (%) - White
Geographical mobility - Moved from abroad (%) - Black or African American
Geographical mobility - Moved from abroad (%) - Asian
Geographical mobility - Moved from abroad (%) - Hispanic or Latino
Geographical mobility - Moved from abroad (%) - American Indian and Alaska Native
Geographical mobility - Moved from abroad (%) - Multirace
Geographical mobility - Moved from abroad (%) - Other Race
Place of birth for the foreign-born population - Ireland (%)
Place of birth for the foreign-born population - Denmark (%)
Place of birth for the foreign-born population - Norway (%)
Place of birth for the foreign-born population - Sweden (%)
Place of birth for the foreign-born population - United Kingdom (%)
Place of birth for the foreign-born population - England (%)
Place of birth for the foreign-born population - Scotland (%)
Place of birth for the foreign-born population - Other Northern Europe (%)
Place of birth for the foreign-born population - Austria (%)
Place of birth for the foreign-born population - Belgium (%)
Place of birth for the foreign-born population - France (%)
Place of birth for the foreign-born population - Germany (%)
Place of birth for the foreign-born population - Netherlands (%)
Place of birth for the foreign-born population - Switzerland (%)
Place of birth for the foreign-born population - Other Western Europe (%)
Place of birth for the foreign-born population - Greece (%)
Place of birth for the foreign-born population - Italy (%)
Place of birth for the foreign-born population - Portugal (%)
Place of birth for the foreign-born population - Spain (%)
Place of birth for the foreign-born population - Other Southern Europe (%)
Place of birth for the foreign-born population - Albania (%)
Place of birth for the foreign-born population - Belarus (%)
Place of birth for the foreign-born population - Bosnia and Herzegovina (%)
Place of birth for the foreign-born population - Bulgaria (%)
Place of birth for the foreign-born population - Croatia (%)
Place of birth for the foreign-born population - Czechoslovakia (%)
Place of birth for the foreign-born population - Hungary (%)
Place of birth for the foreign-born population - Latvia (%)
Place of birth for the foreign-born population - Lithuania (%)
Place of birth for the foreign-born population - North Macedonia (Macedonia) (%)
Place of birth for the foreign-born population - Moldova (%)
Place of birth for the foreign-born population - Poland (%)
Place of birth for the foreign-born population - Romania (%)
Place of birth for the foreign-born population - Russia (%)
Place of birth for the foreign-born population - Serbia (%)
Place of birth for the foreign-born population - Ukraine (%)
Place of birth for the foreign-born population - Other Eastern Europe (%)
Place of birth for the foreign-born population - China (%)
Place of birth for the foreign-born population - Hong Kong (%)
Place of birth for the foreign-born population - Taiwan (%)
Place of birth for the foreign-born population - Japan (%)
Place of birth for the foreign-born population - Korea (%)
Place of birth for the foreign-born population - Other Eastern Asia (%)
Place of birth for the foreign-born population - Afghanistan (%)
Place of birth for the foreign-born population - Bangladesh (%)
Place of birth for the foreign-born population - India (%)
Place of birth for the foreign-born population - Iran (%)
Place of birth for the foreign-born population - Kazakhstan (%)
Place of birth for the foreign-born population - Nepal (%)
Place of birth for the foreign-born population - Pakistan (%)
Place of birth for the foreign-born population - Sri Lanka (%)
Place of birth for the foreign-born population - Uzbekistan (%)
Place of birth for the foreign-born population - Other South Central Asia (%)
Place of birth for the foreign-born population - Burma (%)
Place of birth for the foreign-born population - Cambodia (%)
Place of birth for the foreign-born population - Indonesia (%)
Place of birth for the foreign-born population - Laos (%)
Place of birth for the foreign-born population - Malaysia (%)
Place of birth for the foreign-born population - Philippines (%)
Place of birth for the foreign-born population - Singapore (%)
Place of birth for the foreign-born population - Thailand (%)
Place of birth for the foreign-born population - Vietnam (%)
Place of birth for the foreign-born population - Other South Eastern Asia (%)
Place of birth for the foreign-born population - Armenia (%)
Place of birth for the foreign-born population - Iraq (%)
Place of birth for the foreign-born population - Israel (%)
Place of birth for the foreign-born population - Jordan (%)
Place of birth for the foreign-born population - Kuwait (%)
Place of birth for the foreign-born population - Lebanon (%)
Place of birth for the foreign-born population - Saudi Arabia (%)
Place of birth for the foreign-born population - Syria (%)
Place of birth for the foreign-born population - Turkey (%)
Place of birth for the foreign-born population - Yemen (%)
Place of birth for the foreign-born population - Other Western Asia (%)
Place of birth for the foreign-born population - Eritrea (%)
Place of birth for the foreign-born population - Ethiopia (%)
Place of birth for the foreign-born population - Kenya (%)
Place of birth for the foreign-born population - Somalia (%)
Place of birth for the foreign-born population - Uganda (%)
Place of birth for the foreign-born population - Zimbabwe (%)
Place of birth for the foreign-born population - Other Eastern Africa (%)
Place of birth for the foreign-born population - Cameroon (%)
Place of birth for the foreign-born population - Congo (%)
Place of birth for the foreign-born population - Democratic Republic of Congo (Zaire) (%)
Place of birth for the foreign-born population - Other Middle Africa (%)
Place of birth for the foreign-born population - Egypt (%)
Place of birth for the foreign-born population - Morocco (%)
Place of birth for the foreign-born population - Sudan (%)
Place of birth for the foreign-born population - Other Northern Africa (%)
Place of birth for the foreign-born population - South Africa (%)
Place of birth for the foreign-born population - Other Southern Africa (%)
Place of birth for the foreign-born population - Cabo Verde (%)
Place of birth for the foreign-born population - Ghana (%)
Place of birth for the foreign-born population - Liberia (%)
Place of birth for the foreign-born population - Nigeria (%)
Place of birth for the foreign-born population - Senegal (%)
Place of birth for the foreign-born population - Sierra Leone (%)
Place of birth for the foreign-born population - Other Western Africa (%)
Place of birth for the foreign-born population - Australia (%)
Place of birth for the foreign-born population - New Zealand (%)
Place of birth for the foreign-born population - Fiji (%)
Place of birth for the foreign-born population - Micronesia (%)
Place of birth for the foreign-born population - Bahamas (%)
Place of birth for the foreign-born population - Barbados (%)
Place of birth for the foreign-born population - Cuba (%)
Place of birth for the foreign-born population - Dominica (%)
Place of birth for the foreign-born population - Dominican Republic (%)
Place of birth for the foreign-born population - Grenada (%)
Place of birth for the foreign-born population - Haiti (%)
Place of birth for the foreign-born population - Jamaica (%)
Place of birth for the foreign-born population - St. Vincent and the Grenadines (%)
Place of birth for the foreign-born population - Trinidad and Tobago (%)
Place of birth for the foreign-born population - West Indies (%)
Place of birth for the foreign-born population - Other Caribbean (%)
Place of birth for the foreign-born population - Belize (%)
Place of birth for the foreign-born population - Costa Rica (%)
Place of birth for the foreign-born population - El Salvador (%)
Place of birth for the foreign-born population - Guatemala (%)
Place of birth for the foreign-born population - Honduras (%)
Place of birth for the foreign-born population - Mexico (%)
Place of birth for the foreign-born population - Nicaragua (%)
Place of birth for the foreign-born population - Panama (%)
Place of birth for the foreign-born population - Other Central America (%)
Place of birth for the foreign-born population - Argentina (%)
Place of birth for the foreign-born population - Bolivia (%)
Place of birth for the foreign-born population - Brazil (%)
Place of birth for the foreign-born population - Chile (%)
Place of birth for the foreign-born population - Colombia (%)
Place of birth for the foreign-born population - Ecuador (%)
Place of birth for the foreign-born population - Guyana (%)
Place of birth for the foreign-born population - Peru (%)
Place of birth for the foreign-born population - Uruguay (%)
Place of birth for the foreign-born population - Venezuela (%)
Place of birth for the foreign-born population - Other South America (%)
Place of birth for the foreign-born population - Canada (%)
Place of birth for the foreign-born population - Other Northern America (%)
Place of birth for the foreign-born population - Other (%)
Latest news about races in Hickory, NC collected exclusively by city-data.com from local newspapers, TV, and radio stations
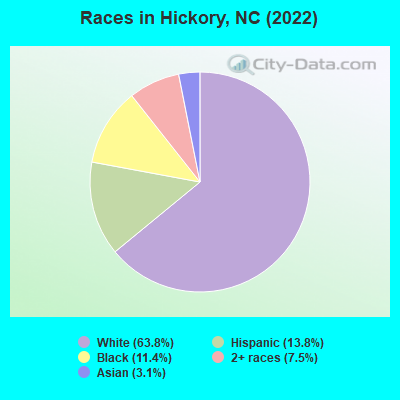
According to 2022 data, the most numerous races in Hickory, NC are White alone (28,097 residents), Black alone (5,020 residents), and Hispanic (6,075 residents). 85.5% of Hickory residents speak English at home. 9.3% of Hickory, NC residents are foreign-born (6.0% born in Latin America, 1.6% born in Europe, 1.1% born in Asia), which is 13.8% greater than the foreign-born rate of 8.0% across the entire state of North Carolina.
Race distribution in Hickory
2000 2022
5,647,155 70.2% White alone 1,723,301 21.4% Black alone 378,963 4.7% Hispanic 112,416 1.4% Asian alone 95,333 1.2% American Indian alone 79,965 1.0% Two or more races 9,015 0.1% Other race alone 3,165 0.04% Native Hawaiian and Other
6,497,519 60.7% White alone 2,155,650 20.1% Black alone 1,114,799 10.4% Hispanic 438,061 4.1% Two or more races 341,052 3.2% Asian alone 91,758 0.9% American Indian alone 50,180 0.5% Other race alone 9,954 0.09% Native Hawaiian and Other
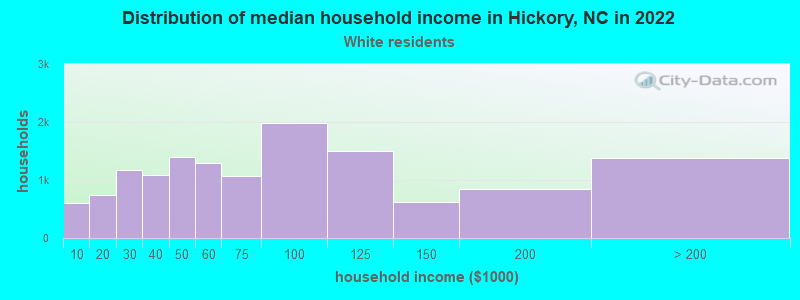
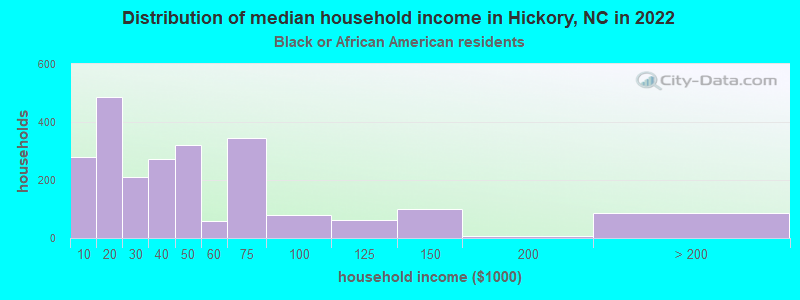
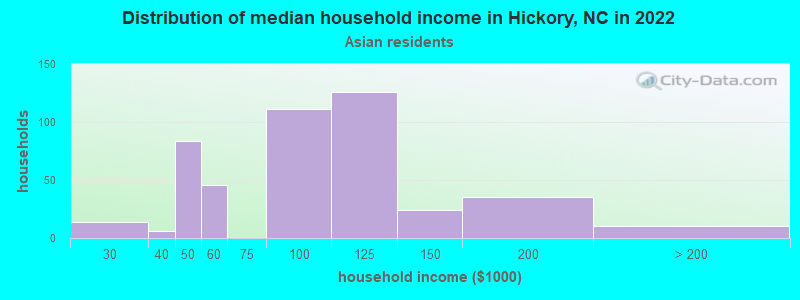
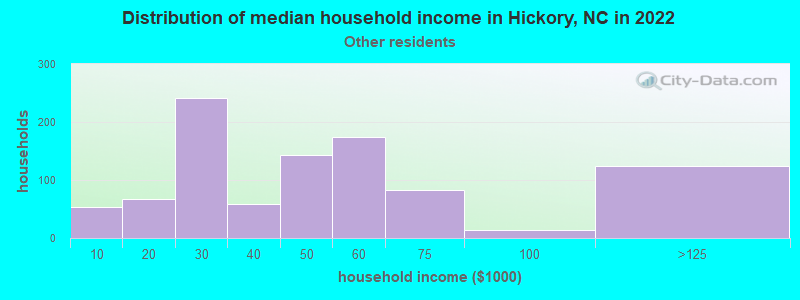
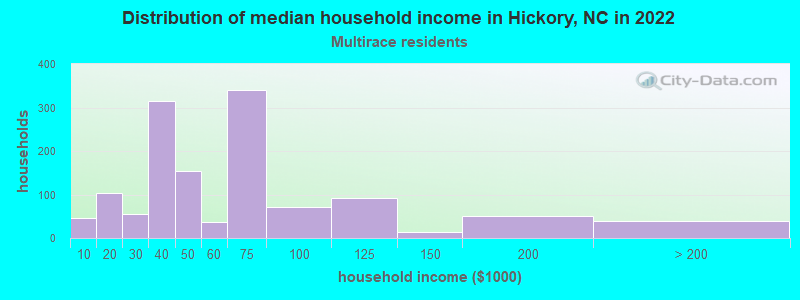
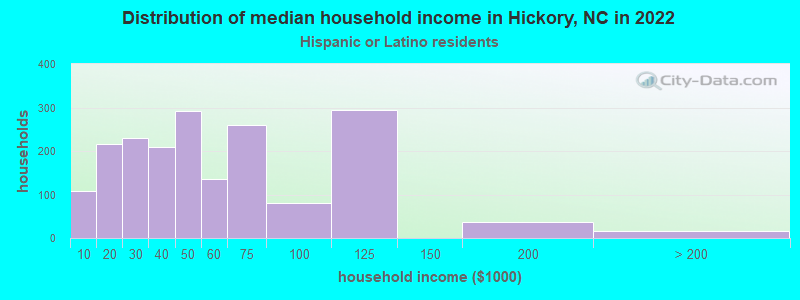
Income and house value in Hickory Median household income in 2022 $68,898 White non-Hispanic householders$29,524 Black householders$68,890 Asian householders$99,134 Some other race householders$27,969 Two or more races householders$46,704 Hispanic or Latino race householdersMedian 2022 house value $321,725 White Non-Hispanic householders$168,152 Black or African American householders$157,946 American Indian or Alaska Native householders $331,930 Asian householders$215,779 Two or more races householders$435,446 Hispanic or Latino householders
Median age by race in Hickory
44.5 Median age for White residents43.7 45.5 33.2 Median age for Black or African American residents31.4 38.5 12.0 Median age for American Indian / Alaska Native residents14.0 18.3 32.5 Median age for Asian residents28.0 35.6 -666,666,666.0 Median age for Native Hawaiian / Pacific Islander residents-666,666,666.0 -666,666,666.0 37.9 Median age for Other race residents33.7 40.7 19.9 Median age for Two or more races residents19.0 26.1 46.0 Median age for White alone residents44.3 47.2 26.7 Median age for Hispanic or Latino residents22.3 32.9
Owner/renter occupied households by race in Hickory
House owners and renters - White residents 8,508 64.2% Owner occupied4,737 35.8% Renter occupiedHouse owners and renters - Black or African American residents 627 28.1% Owner occupied1,602 71.9% Renter occupiedHouse owners and renters - American Indian / Alaska Native residents 29 100.0% Owner occupiedHouse owners and renters - Asian residents 218 49.5% Owner occupied223 50.5% Renter occupiedHouse owners and renters - Other race residents 395 63.3% Owner occupied229 36.7% Renter occupiedHouse owners and renters - Two or more races residents 460 28.5% Owner occupied1,155 71.5% Renter occupiedHouse owners and renters - White alone residents 8,226 65.0% Owner occupied4,425 35.0% Renter occupiedHouse owners and renters - Hispanic or Latino residents 862 48.1% Owner occupied930 51.9% Renter occupied
Language usage in Hickory
English speakers - Total 85.5% of residents of Hickory speak English at home.
9.3% of residents speak Spanish at home 2,490 63.1% Speak English very well1,453 36.9% Speak English less than very well5.0% of residents speak other language at home 1,485 71.0% Speak English very well606 29.0% Speak English less than very well
English speakers - Born in the United States 91.7% of residents of Hickory speak English at home.
2.0% of residents speak Spanish at home 259 93.5% Speak English very well18 6.5% Speak English less than very well5.8% of residents speak other language at home 660 80.4% Speak English very well161 19.6% Speak English less than very well
English speakers - Native, born elsewhere 42.1% of residents of Hickory speak English at home.
145.1% of residents speak Spanish at home 192 56.8% Speak English very well146 43.2% Speak English less than very well6.9% of residents speak other language at home 16 100.0% Speak English less than very well
English speakers - Foreign-born 20.7% of residents of Hickory speak English at home.
51.8% of residents speak Spanish at home 1,043 50.2% Speak English very well1,033 49.8% Speak English less than very well24.9% of residents speak other language at home 584 58.5% Speak English very well414 41.5% Speak English less than very well
White (Caucasian) - Speak only English Native:
97.5% (26,741)Foreign-born:
24.5% (333)
White (Caucasian) - Speak another language Native:
2.4% (671)Foreign-born:
71.9% (976)
Black or African American - Speak only English Native:
98.5% (5,189)Foreign-born:
19.3% (28)
Black or African American - Speak another language Native:
1.5% (80)Foreign-born:
80.3% (116)
American Indian / Alaska Native - Speak another language Native:
100.0% (67)Foreign-born:
100.0% (277)
Asian - Speak only English Native:
27.3% (267)Foreign-born:
4.9% (16)
Asian - Speak another language Native:
71.6% (699)Foreign-born:
90.9% (299)
Other race - Speak only English Native:
9.0% (79)Foreign-born:
22.8% (176)
Other race - Speak another language Native:
84.7% (745)Foreign-born:
89.7% (693)
Two or more races - Speak only English Native:
84.9% (3,655)Foreign-born:
10.4% (110)
Two or more races - Speak another language Native:
9.2% (396)Foreign-born:
76.3% (805)
White alone - Speak only English Native:
99.1% (26,263)Foreign-born:
49.4% (334)
White alone - Speak another language Native:
0.9% (250)Foreign-born:
41.1% (278)
Hispanic or Latino - Speak only English Native:
47.4% (1,586)Foreign-born:
14.2% (356)
Hispanic or Latino - Speak another language Native:
53.7% (1,797)Foreign-born:
88.1% (2,207)
Foreign-born residents in Hickory 4,083 residents are foreign born (6.0% Latin America , 1.6% Europe , 1.1% Asia ).
This city:
9.3%North Carolina:
8.3%
Marital status for residents in Hickory Marital status - White (Caucasian) population 15 years and over
Males 33.8% Never married52.1% Now married1.8% Separated2.7% Widowed9.6% DivorcedFemales 30.0% Never married44.9% Now married2.4% Separated8.5% Widowed14.1% DivorcedWomen who gave birth in the past 12 months Now married:
99.2% (118)Unmarried:
0.8% (1)
Women who did not give birth in the past 12 months Now married:
38.6% (2,714)Unmarried:
61.4% (4,316)
Marital status - Black or African American population 15 years and over
Males 57.9% Never married22.2% Now married3.7% Separated7.7% Widowed8.4% DivorcedFemales 50.6% Never married16.8% Now married0.7% Separated8.7% Widowed23.2% DivorcedWomen who gave birth in the past 12 months Now married:
0.0% (0)Unmarried:
100.0% (33)
Women who did not give birth in the past 12 months Now married:
20.5% (251)Unmarried:
79.5% (974)
Marital status - American Indian / Alaska Native population 15 years and over
Males 68.3% Never married31.7% Now married0.0% Separated0.0% Widowed0.0% DivorcedFemales 55.1% Never married44.9% Now married0.0% Separated0.0% Widowed0.0% DivorcedWomen who did not give birth in the past 12 months Now married:
0.0% (0)Unmarried:
100.0% (40)
Marital status - Asian population 15 years and over
Males 62.1% Never married25.3% Now married3.2% Separated0.0% Widowed9.5% DivorcedFemales 36.9% Never married43.9% Now married0.0% Separated6.3% Widowed12.9% DivorcedWomen who gave birth in the past 12 months Now married:
100.0% (6)Unmarried:
0.0% (0)
Women who did not give birth in the past 12 months Now married:
43.7% (244)Unmarried:
56.3% (315)
Marital status - Other race population 15 years and over
Males 55.4% Never married43.1% Now married1.5% Separated0.0% Widowed0.0% DivorcedFemales 47.9% Never married32.9% Now married2.7% Separated1.2% Widowed15.3% DivorcedWomen who gave birth in the past 12 months Now married:
100.0% (115)Unmarried:
0.0% (0)
Women who did not give birth in the past 12 months Now married:
25.2% (187)Unmarried:
74.8% (554)
Marital status - Two or more races population 15 years and over
Males 55.2% Never married39.3% Now married1.2% Separated1.7% Widowed2.6% DivorcedFemales 41.5% Never married38.0% Now married0.4% Separated3.2% Widowed16.9% DivorcedWomen who did not give birth in the past 12 months Now married:
36.5% (394)Unmarried:
63.5% (686)
Marital status - White alone, not Hispanic / Latino population 15 years and over
Males 33.7% Never married52.5% Now married1.9% Separated2.6% Widowed9.3% DivorcedFemales 28.5% Never married46.7% Now married1.5% Separated9.0% Widowed14.3% DivorcedWomen who gave birth in the past 12 months Now married:
99.2% (119)Unmarried:
0.8% (1)
Women who did not give birth in the past 12 months Now married:
39.1% (2,507)Unmarried:
60.9% (3,905)
Marital status - Hispanic or Latino population 15 years and over
Males 48.8% Never married41.9% Now married1.7% Separated2.1% Widowed5.5% DivorcedFemales 49.2% Never married28.4% Now married7.2% Separated2.8% Widowed12.5% DivorcedWomen who gave birth in the past 12 months Now married:
100.0% (87)Unmarried:
0.0% (0)
Women who did not give birth in the past 12 months Now married:
29.5% (484)Unmarried:
70.5% (1,159)
Ancestries in Hickory
4,113 15.7% American4,018 15.4% English2,306 8.8% German1,152 4.4% Irish998 3.8% European656 2.5% Scottish649 2.5% Italian468 1.8% Scotch-Irish368 1.4% Polish321 1.2% African149 0.6% French137 0.5% Dutch136 0.5% British110 0.4% Romanian93 0.4% Northern European86 0.3% Norwegian84 0.3% French Canadian62 0.2% Brazilian59 0.2% Swedish54 0.2% Jamaican52 0.2% Welsh43 0.2% Hungarian41 0.2% Albanian31 0.1% Danish30 0.1% Lebanese30 0.1% Ukrainian27 0.1% Iranian24 0.09% Greek20 0.08% Eastern European12 0.05% Scandinavian12 0.05% Slovene11 0.04% Austrian9 0.03% Portuguese9 0.03% Estonian7 0.03% Egyptian7 0.03% Finnish5 0.02% Czech
Geographical mobility in Hickory Same house 1 year ago 24,497 82.8% White (Caucasian)4,365 86.7% Black or African American141 52.5% American Indian / Alaska Native1,450 78.5% Asian2,644 91.6% Other race4,559 78.8% Two or more races22,919 82.1% White alone, not Hispanic / Latino5,176 86.8% Hispanic or LatinoMoved within same county 2,041 6.9% White / Caucasian437 8.7% Black or African American171 9.3% Asian21 0.7% Other race502 8.7% Two or more races2,058 7.4% White alone, not Hispanic / Latino324 5.4% Hispanic or LatinoMoved within same state 2,082 7.0% White / Caucasian427 8.5% Black or African American50 18.8% American Indian / Alaska Native27 1.5% Asian157 5.4% Other race65 1.1% Two or more races2,093 7.5% White alone, not Hispanic / Latino207 3.5% Hispanic or LatinoMoved from different state 979 3.3% White / Caucasian114 2.3% Black or African American56 20.9% American Indian / Alaska Native166 9.0% Asian72 2.5% Other race92 1.6% Two or more races960 3.4% White alone, not Hispanic / Latino129 2.2% Hispanic or LatinoMoved from abroad 114 0.4% White5 0.1% Black or African American17 0.6% Other race24 0.4% Two or more races156 0.6% White alone, not Hispanic / Latino71 1.2% Hispanic or Latino
Children Nativity (place of birth) in Hickory
Children under 6 years - Living with two parents Both parents native 1,074 100.0% NativeBoth parents foreign-born 343 100.0% NativeOne native, one foreign-born parent 58 100.0% NativeChildren under 6 years - Living with one parent Native parent 788 100.0% NativeForeign-born parent 234 100.0% NativeChildren 6 to 17 years - Living with two parents Both parents native 2,389 100.0% NativeBoth parents foreign-born 514 91.4% Native48 8.6% Foreign-bornOne native, one foreign-born parent 409 92.9% Native31 7.1% Foreign-bornChildren 6 to 17 years - Living with one parent Native parent 2,113 100.0% NativeForeign-born parent 698 54.0% Native595 46.0% Foreign-born
Grandparents responsible for own grandchildren in Hickory
Grandparents (30 to 59 years) White / Caucasian 42 100.0% Not responsible for grandchildrenBlack or African American 4 22.6% Responsible for grandchildren13 77.4% Not responsible for grandchildrenOther race 23 100.0% Not responsible for grandchildrenWhite alone, not Hispanic / Latino 42 100.0% Not responsible for grandchildrenHispanic or Latino 20 100.0% Not responsible for grandchildrenGrandparents (60 years and over) White / Caucasian 123 43.3% Responsible for grandchildren161 56.7% Not responsible for grandchildrenBlack or African American 50 24.4% Responsible for grandchildren155 75.6% Not responsible for grandchildrenWhite alone, not Hispanic / Latino 123 42.5% Responsible for grandchildren166 57.5% Not responsible for grandchildren