Hazelwood, MO (Missouri) Houses and Residents
| Hazelwood: | $158,962 |
| Missouri: | $221,200 |
Total population: 25,666 (Urban population: 25,113, Rural population: 1,061 (all nonfarm))
Houses: 12,578 (11,545 occupied: 6,682 owner occupied, 4,837 renter occupied)
| % of renters here: | 42% |
| State: | 32% |
Housing density: 792 houses/condos per square mile
Median price asked for vacant for-sale houses and condos in 2022: $120,273.
Median contract rent in 2022: $831 (lower quartile is $737, upper quartile is $986)
Median rent asked for vacant for-rent units in 2022: $988
Median gross rent in Hazelwood, MO in 2022: $1,012
Housing units in Hazelwood with a mortgage: 3,909 (229 second mortgage, 0 home equity loan, 218 both second mortgage and home equity loan)
Houses without a mortgage: 97
Median household income for houses/condos with a mortgage: $73,571
Median household income for apartments without a mortgage: $62,121
Median monthly housing costs: $974
Compare current foreclosures in Hazelwood, MO:
| Photo | Address | Area | Beds / Baths | Price | Details |
|---|---|---|---|---|---|

|
#1
Foxmont Dr
Hazelwood, MO 63042
|
1,053 sq. feet
|
1 baths 3 beds |
show details | |

|
#2
Naples Dr
Hazelwood, MO 63042
|
1,032 sq. feet
|
2 baths 3 beds |
show details | |

|
#3
Cartwheel Ln
Hazelwood, MO 63042
|
1,188 sq. feet
|
1 baths 3 beds |
show details | |

|
#4
Haventree Dr
Hazelwood, MO 63042
|
1,102 sq. feet
|
2 baths 3 beds |
show details | |

|
#5
Lynn Haven Ln
Hazelwood, MO 63042
|
912 sq. feet
|
1 baths 3 beds |
show details | |

|
#6
Kenwood Dr
Hazelwood, MO 63042
|
2,130 sq. feet
|
1 baths 2 beds |
show details | |

|
#7
Cherryvale Dr
Hazelwood, MO 63042
|
962 sq. feet
|
1 baths 3 beds |
show details | |

|
#8
Spring Forest Ln
Hazelwood, MO 63042
|
1,296 sq. feet
|
1 baths 3 beds |
show details | |

|
#9
Hazelcrest Dr
Hazelwood, MO 63042
|
1,254 sq. feet
|
1 baths 3 beds |
show details | |

|
#10
N Hanley Rd
Hazelwood, MO 63042
|
1,254 sq. feet
|
2 baths 3 beds |
show details |
| Photo | Address | Area | Beds / Baths | Price | Details |
|---|---|---|---|---|---|

|
#11
Hurstborough Manor Dr
Hazelwood, MO 63042
|
1,708 sq. feet
|
2 baths 3 beds |
show details | |

|
#12
Cherry Blossom Ct
Hazelwood, MO 63042
|
972 sq. feet
|
1 baths 3 beds |
show details | |

|
#13
Lamplight Ln
Hazelwood, MO 63042
|
1,550 sq. feet
|
2 baths 3 beds |
show details | |

|
#14
Berkridge Ct
Hazelwood, MO 63042
|
960 sq. feet
|
1 baths 3 beds |
show details | |

|
#15
Heritage Heights Cir
Hazelwood, MO 63042
|
1,114 sq. feet
|
1 baths 2 beds |
show details | |

|
#16
Christina Marie Ln
Hazelwood, MO 63042
|
1,472 sq. feet
|
2 baths 3 beds |
show details | |

|
#17
Rose Crest
Hazelwood, MO 63042
|
972 sq. feet
|
1 baths 3 beds |
show details | |

|
#18
Gladys Dr
Hazelwood, MO 63042
|
988 sq. feet
|
1 baths 3 beds |
show details | |

|
#19
Christina Marie Ct
Hazelwood, MO 63042
|
1,568 sq. feet
|
2 baths 3 beds |
show details | |

|
#20
Coach Light Ln
Hazelwood, MO 63042
|
1,568 sq. feet
|
2 baths 3 beds |
show details |
| Photo | Address | Area | Beds / Baths | Price | Details |
|---|---|---|---|---|---|

|
#21
Hazelvalley Dr
Hazelwood, MO 63042
|
912 sq. feet
|
1 baths 3 beds |
show details | |

|
#22
Teson Rd
Hazelwood, MO 63042
|
1,160 sq. feet
|
2 baths 3 beds |
show details | |

|
#23
Carey Ln
Hazelwood, MO 63042
|
888 sq. feet
|
1 baths 3 beds |
show details | |

|
#24
Hurstborough Manor Dr
Hazelwood, MO 63042
|
1,700 sq. feet
|
2 baths 3 beds |
show details | |

|
#25
Tulip Tree Ln
Hazelwood, MO 63042
|
839 sq. feet
|
1 baths 2 beds |
show details | |

|
#26
Sandy Hill Dr
Hazelwood, MO 63042
|
900 sq. feet
|
1 baths 3 beds |
show details | |

|
#27
Ville Angela Ln
Hazelwood, MO 63042
|
1,416 sq. feet
|
1 baths 4 beds |
show details | |

|
#28
Tulip Tree Ln
Hazelwood, MO 63042
|
1,602 sq. feet
|
2 baths 3 beds |
show details | |

|
#29
Elwyn Dr
Hazelwood, MO 63042
|
960 sq. feet
|
1 baths 3 beds |
show details | |

|
#30
Hazelcrest Dr
Hazelwood, MO 63042
|
1,254 sq. feet
|
1 baths 3 beds |
show details |
| Photo | Address | Area | Beds / Baths | Price | Details |
|---|---|---|---|---|---|

|
#31
Woodcrest Ln
Hazelwood, MO 63042
|
2,136 sq. feet
|
1 baths 3 beds |
show details | |

|
#32
Lamplight Ln
Hazelwood, MO 63042
|
1,053 sq. feet
|
2 baths 3 beds |
show details | |

|
#33
Buddie Dr
Hazelwood, MO 63042
|
988 sq. feet
|
1 baths 3 beds |
show details | |

|
#34
Midwood Ave
Hazelwood, MO 63042
|
1,008 sq. feet
|
1 baths 3 beds |
show details | |

|
#35
Nathaniel Ct
Hazelwood, MO 63042
|
2,352 sq. feet
|
2 baths 4 beds |
show details | |

|
#36
Rose Crest Dr
Hazelwood, MO 63042
|
1,080 sq. feet
|
1 baths 3 beds |
show details | |

|
#37
Foxtree Dr
Hazelwood, MO 63042
|
974 sq. feet
|
1 baths 3 beds |
show details | |

|
#38
Cherry Blossom Ln
Hazelwood, MO 63042
|
1,008 sq. feet
|
1 baths 3 beds |
show details | |

|
#39
Mary Jo Ln
Hazelwood, MO 63042
|
1,092 sq. feet
|
1 baths 3 beds |
show details | |

|
#40
Lynn Grove Ct
Hazelwood, MO 63042
|
1,113 sq. feet
|
2 baths 3 beds |
show details |
| Photo | Address | Area | Beds / Baths | Price | Details |
|---|---|---|---|---|---|

|
#41
Ville Rosa Ln
Hazelwood, MO 63042
|
888 sq. feet
|
1 baths 3 beds |
show details | |

|
#42
Chula Dr
Hazelwood, MO 63042
|
1,040 sq. feet
|
1 baths 3 beds |
show details | |

|
#43
Boellner Dr
Hazelwood, MO 63042
|
1,134 sq. feet
|
2 baths 3 beds |
show details | |

|
#44
Queen Ann Dr
Hazelwood, MO 63042
|
1,364 sq. feet
|
1 baths 2 beds |
show details | |

|
#45
Holiday Ave
Hazelwood, MO 63042
|
1,281 sq. feet
|
2 baths 4 beds |
show details | |

|
#46
Caposele Ln
Hazelwood, MO 63042
|
950 sq. feet
|
1 baths 3 beds |
show details | |

|
#47
Hazelcrest Dr
Hazelwood, MO 63042
|
1,254 sq. feet
|
1 baths 3 beds |
show details | |

|
#48
Caposele Ln
Hazelwood, MO 63042
|
1,032 sq. feet
|
2 baths 3 beds |
show details | |

|
#49
Chapel Ridge Dr
Hazelwood, MO 63042
|
- sq. feet
|
- baths - beds |
show details | |

|
Check over 1 million property listings on Foreclosure.com!
|
browse all offers | |||

Latest news about housing in Hazelwood, MO collected exclusively by city-data.com from local newspapers, TV, and radio stations

 | Mid 60's - Hazelwood Missouri (6 replies) |
| Overwhelmed House Shopper (12 replies) |
| What could really happen if I don't pay the HOA fees for my condo? (11 replies) |
| Where to get an apartment if working in Bridgeton? (16 replies) |
| Houses in Florissant seem cheap - is there a catch? (11 replies) |
| Definitions of Mid, South, North, and West St. Louis County? (42 replies) |

Median year apartment built: 1974
Household type by relationship:
Households: 25,109- Male householders: 4,426 (1,756 living alone), Female householders: 6,985 (3,068 living alone)
3,469 spouses (3,427 opposite-sex spouses), 789 unmarried partners, (772 opposite-sex unmarried partners), 7,238 children (7,056 natural, 51 adopted, 129 stepchildren), 883 grandchildren, 229 brothers or sisters, 307 parents, 102 foster children, 202 other relatives, 294 non-relatives
- In group quarters: 181
Size of family households: 2,938 2-persons, 1,813 3-persons, 877 4-persons, 455 5-persons, 153 6-persons, 88 7-or-more-persons.
Size of nonfamily households: 4,773 1-person, 317 2-persons, 66 3-persons.
2,448 married couples with children.
1,771 single-parent households (348 men, 1,423 women).
92.0% of residents of Hazelwood speak English at home.
2.2% of residents speak Spanish at home (69% speak English very well, 28% speak English well, 4% speak English not well).
0.2% of residents speak other Indo-European language at home (50% speak English very well, 50% speak English not well).
2.3% of residents speak Asian or Pacific Island language at home (44% speak English very well, 38% speak English well, 17% speak English not well).
3.4% of residents speak other language at home (86% speak English very well, 2% speak English well, 12% don't speak English at all).
Foreign born population: 1,690 (6.7%)
(66.9% of them are naturalized citizens)
| Here: | 6.3 |
| State: | 6.4 |
| Here: | 4.2 |
| State: | 4.4 |

- Bedrooms in owner-occupied houses and condos in Hazelwood, Missouri
- 22no bedroom
- 461 bedroom
- 9072 bedrooms
- 4,3023 bedrooms
- 1,2864 bedrooms
- 1195+ bedrooms

- Bedrooms in renter-occupied apartments in Hazelwood, Missouri
- 75no bedroom
- 1,5551 bedroom
- 2,3342 bedrooms
- 8013 bedrooms
- 724 bedrooms
- 05+ bedrooms

- Cars and other vehicles available in Hazelwood in owner-occupied houses/condos
- 144no vehicle
- 2,2071 vehicle
- 2,9092 vehicles
- 1,0133 vehicles
- 3004 vehicles
- 1095+ vehicles

- Cars and other vehicles available in Hazelwood in renter-occupied apartments
- 557no vehicle
- 3,0801 vehicle
- 1,1672 vehicles
- 333 vehicles
- 04 vehicles
- 05+ vehicles

- Rooms in owner-occupied houses in Hazelwood, Missouri
- 01 room
- 02 rooms
- 753 rooms
- 5534 rooms
- 1,3795 rooms
- 1,7176 rooms
- 1,5397 rooms
- 9218 rooms
- 4989+ rooms

- Rooms in renter-occupied apartments in Hazelwood, Missouri
- 751 room
- 5042 rooms
- 7883 rooms
- 1,5364 rooms
- 1,3295 rooms
- 3736 rooms
- 1607 rooms
- 728 rooms
- 09+ rooms


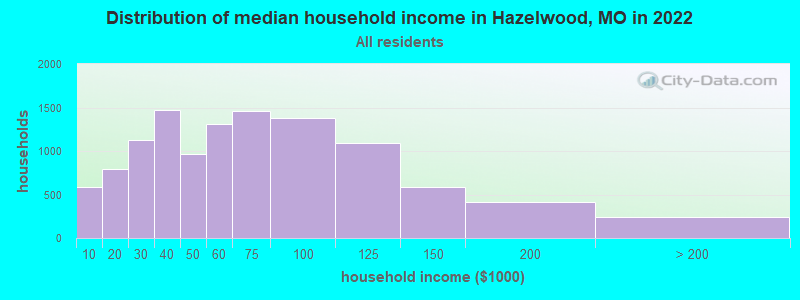
Hazelwood, MO household income distribution

- 591Less than $10,000
- 798$10,000 to $19,999
- 1,131$20,000 to $29,999
- 1,474$30,000 to $39,999
- 962$40,000 to $49,999
- 1,313$50,000 to $59,999
- 1,455$60,000 to $74,999
- 1,374$75,000 to $99,999
- 1,087$100,000 to $124,999
- 582$125,000 to $149,999
- 417$150,000 to $199,999
- 242$200,000 or more
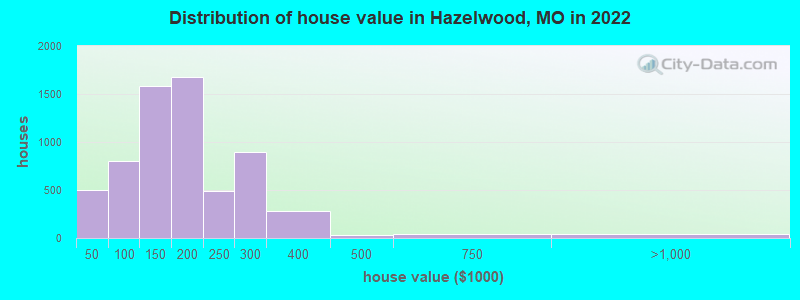
Home value of owner - occupied houses in 2022 in Hazelwood, MO
-
- 164Less than $10,000
- 56$10,000 to $14,999
- 112$15,000 to $19,999
- 22$20,000 to $24,999
- 42$25,000 to $29,999
- 22$30,000 to $34,999
- 24$35,000 to $39,999
- 51$40,000 to $49,999
- 65$50,000 to $59,999
- 65$60,000 to $69,999
- 103$70,000 to $79,999
- 282$80,000 to $89,999
- 236$90,000 to $99,999
- 768$100,000 to $124,999
- 811$125,000 to $149,999
- 1,163$150,000 to $174,999
- 512$175,000 to $199,999
- 490$200,000 to $249,999
- 896$250,000 to $299,999
- 280$300,000 to $399,999
- 27$400,000 to $499,999
- 43$500,000 to $749,999
- 44$750,000 to $999,999
Rent paid by renters in 2022 in Hazelwood, MO
-
- 10$100 to $149
- 38$200 to $249
- 47$250 to $299
- 82$300 to $349
- 39$450 to $499
- 64$500 to $549
- 108$550 to $599
- 177$600 to $649
- 185$650 to $699
- 597$700 to $749
- 804$750 to $799
- 690$800 to $899
- 340$900 to $999
- 872$1,000 to $1,249
- 121$1,250 to $1,499
- 15$1,500 to $1,999
- 43$2,000 to $2,499
- 25$3,000 to $3,499
- 71$3,500 or more
- 177No cash rent


Percentage of workers working in this county: 72.9%
Number of people working at home: 1,773 (14.2% of all workers)
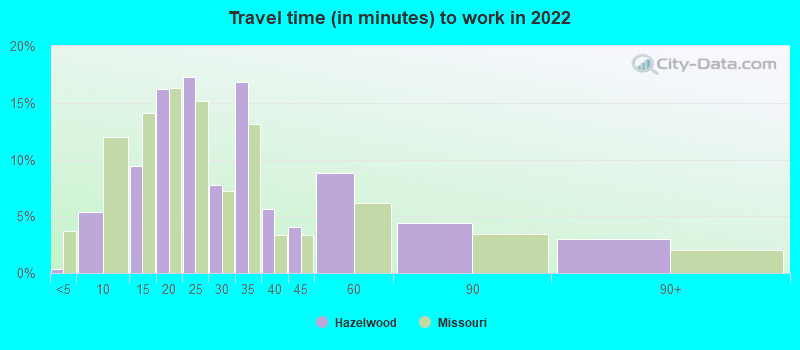
Travel time to work (commute)
- Less than 5 minutes: 163
- 5 to 9 minutes: 671
- 10 to 14 minutes: 1,204
- 15 to 19 minutes: 2,506
- 20 to 24 minutes: 2,127
- 25 to 29 minutes: 964
- 30 to 34 minutes: 1,733
- 35 to 39 minutes: 410
- 40 to 44 minutes: 327
- 45 to 59 minutes: 299
- 60 to 89 minutes: 42
- 90 or more minutes: 95
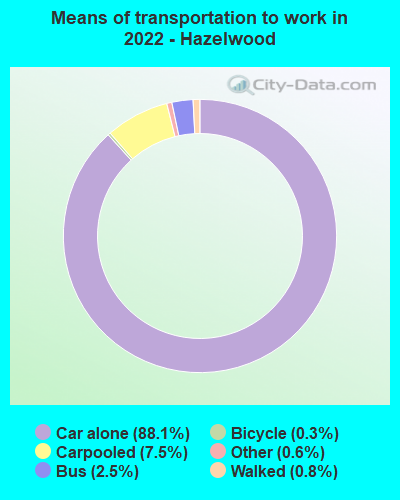
Means of transportation to work:
- Drove a car alone: 15,772 (78.7%)
- Carpooled: 1,279 (6.4%)
- Bus: 450 (2.2%)
- Subway or elevated rail: 12 (0.1%)
- Light rail, streetcar or trolley: 24 (0.1%)
- Taxi: 105 (0.5%)
- Bicycle: 62 (0.3%)
- Walked: 165 (0.8%)
- Worked at home: 1,773 (8.8%)

- Unemployment by race in 2022
- Unemployment rate for White non-Hispanic residents
- 6.9%Males
- 8.5%Females
- Unemployment rate for Black residents
- 7.6%Males
- 7.3%Females
- Unemployment rate for two or more race residents
- 26.1%Males

- Year of entry for the foreign-born population in Hazelwood, Missouri
- 8222010 or later
- 4662000 to 2009
- 3471990 to 1999
- 2071980 to 1989
- 1061970 to 1979
- 168Before 1970

First ancestries reported:
- German: 1,477 (11.6%)
- American: 718 (5.7%)
- Kenyan: 547 (4.3%)
- English: 505 (4.0%)
- Italian: 353 (2.8%)
- Irish: 227 (1.8%)
- African: 186 (1.5%)
- Polish: 184 (1.4%)
- Liberian: 173 (1.4%)
- European: 165 (1.3%)
- Jamaican: 128 (1.0%)
- French: 81 (0.6%)
- Nigerian: 69 (0.5%)
- Albanian: 67 (0.5%)
- Czech: 64 (0.5%)
- Swedish: 58 (0.5%)
- Scotch-Irish: 55 (0.4%)
- Northern European: 53 (0.4%)
- Hungarian: 47 (0.4%)
- Palestinian: 39 (0.3%)
- Norwegian: 34 (0.3%)
- Dutch: 32 (0.3%)
- Scottish: 30 (0.2%)
- Russian: 24 (0.2%)
- British: 23 (0.2%)
- Scandinavian: 14 (0.1%)
- Austrian: 13 (0.1%)
- Danish: 11 (0.09%)
- Icelander: 11 (0.09%)
Most common places of birth for foreign-born residents (%):
| Hazelwood: | 31.4% (523) |
| Missouri: | 1.7% (4,518) |
| Hazelwood: | 16.2% (270) |
| Missouri: | 0.4% (923) |
| Hazelwood: | 13.5% (225) |
| Missouri: | 14.9% (38,568) |
| Hazelwood: | 12.2% (204) |
| Missouri: | 4.1% (10,700) |
| Hazelwood: | 7.6% (126) |
| Missouri: | 0.9% (2,341) |
| Hazelwood: | 5.9% (98) |
| Missouri: | 4.2% (10,873) |
| Hazelwood: | 4.0% (67) |
| Missouri: | 2.1% (5,346) |
| Hazelwood: | 3.2% (54) |
| Missouri: | 0.5% (1,245) |
| Hazelwood: | 2.9% (48) |
| Missouri: | 1.4% (3,640) |
| Hazelwood: | 2.2% (37) |
| Missouri: | 0.1% (185) |
Place of birth for U.S.-born residents:
- This state: 18,492
- Other state: 4,858
- Northeast: 273
- Midwest: 2,383
- South: 1,473
- West: 680
87.7% of Hazelwood residents lived in the same house 1 years ago.
Out of people who lived in different houses, 43.1% lived in this county.
Out of people who lived in different counties, 59.9% lived in Missouri.
| Hazelwood: | 87.7% |
| State average: | 87.1% |
Education attainment for males 25 years and older:
- No schooling: 83
- Nursery to 4th grade: 0
- 5th and 6th grade: 0
- 7th and 8th grade: 11
- 9th grade: 88
- 10th grade: 174
- 11th grade: 223
- 12th grade, no diploma: 155
- High school graduate (or equivalency): 2,140
- Less than 1 year of college: 507
- Some college more than 1 year, no degree: 1,109
- Associate degree: 675
- Bachelor's degree: 1,505
- Master's degree: 536
- Professional school degree: 61
- Doctorate degree: 0

Education attainment for females 25 years and older:
- No schooling: 182
- Nursery to 4th grade: 0
- 5th and 6th grade: 0
- 7th and 8th grade: 33
- 9th grade: 0
- 10th grade: 48
- 11th grade: 134
- 12th grade, no diploma: 148
- High school graduate (or equivalency): 2,418
- Less than 1 year of college: 625
- Some college more than 1 year, no degree: 1,412
- Associate degree: 916
- Bachelor's degree: 2,079
- Master's degree: 976
- Professional school degree: 81
- Doctorate degree: 16


Housing units in structures:
- One, detached: 7,818
- One, attached: 1,126
- Two: 180
- 3 or 4: 264
- 5 to 9: 1,427
- 10 to 19: 1,104
- 20 to 49: 85
- 50 or more: 512
- Mobile homes: 59
Housing units lacking complete kitchen facilities in 2022: 1.1%
House/condo owner moved in on average 17 years ago
Renter moved in on average 4 years ago

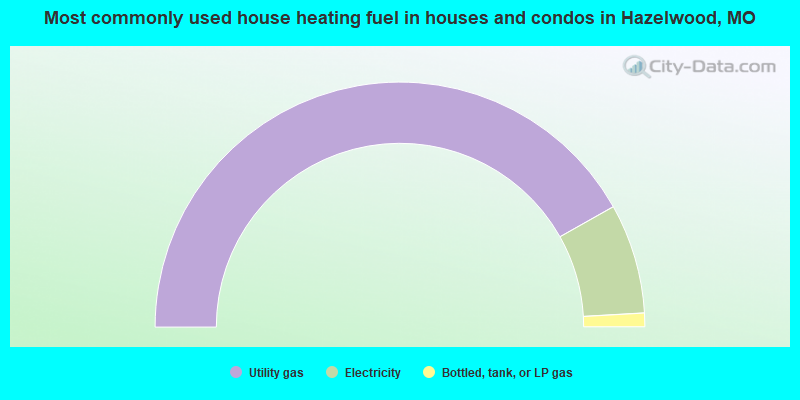
- 83.6%Utility gas
- 14.5%Electricity
- 1.8%Bottled, tank, or LP gas
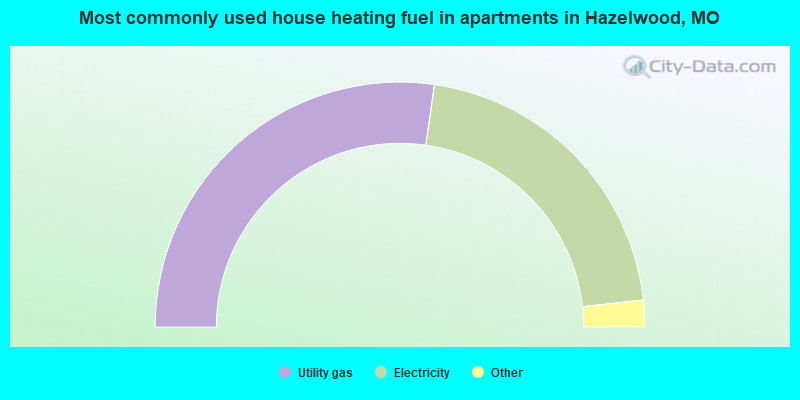
- 54.5%Utility gas
- 42.0%Electricity
- 1.5%No fuel used
- 1.2%Bottled, tank, or LP gas
- 0.8%Other fuel
Private vs. public school enrollment:
| Here: | 20.3% |
| Missouri: | 15.4% |
| Here: | 12.7% |
| Missouri: | 13.9% |
| Here: | 24.5% |
| Missouri: | 22.6% |


