Races in Hazelwood, Missouri (MO) Detailed Stats
Ancestries, Foreign-born residents, place of birth
Settings
X


Recent posts about races in Hazelwood, Missouri on our local forum with over 2,400,000 registered users:
 | Asians moving to STL (42 replies) |
| Overwhelmed House Shopper (12 replies) |
| Interesting Missouri facts. (1186 replies) |
| Affordable, safe, small-town-feel places to live with commutes to Bridgeton and Maplewood? (5 replies) |
| TV Antennas in St. Louis? (30 replies) |
| Evaluating possible relocation to St Louis (29 replies) |
Latest news about races in Hazelwood, MO collected exclusively by city-data.com from local newspapers, TV, and radio stations
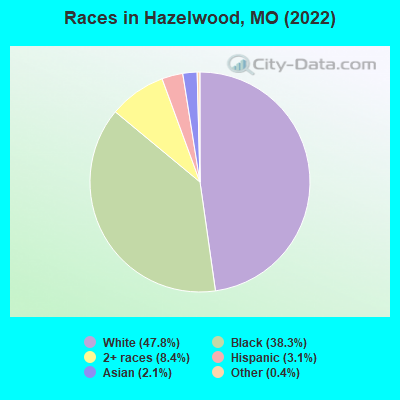
According to 2022 data, the most numerous races in Hazelwood, MO are White alone (11,993 residents), Black alone (9,611 residents), and Two or more races (2,115 residents). 92.2% of Hazelwood residents speak English at home. 6.6% of Hazelwood, MO residents are foreign-born (3.1% born in Africa, 1.8% born in Asia, 1.5% born in Latin America), which is 39.8% greater than the foreign-born rate of 4.0% across the entire state of Missouri.
Race distribution in Hazelwood
2000
2022

- 20,77879.3%White alone
- 4,18816.0%Black alone
- 4281.6%Two or more races
- 4191.6%Hispanic
- 3111.2%Asian alone
- 470.2%American Indian alone
- 200.08%Other race alone
- 150.06%Native Hawaiian and Other
Pacific Islander alone

-
- 11,99347.8%White alone
- 9,61138.3%Black alone
- 2,1158.4%Two or more races
- 7823.1%Hispanic
- 5392.1%Asian alone
- 1020.4%Other race alone
- 40.02%Native Hawaiian and Other
Pacific Islander alone
2000
2022
-
- 4,686,47483.8%White alone
- 625,66711.2%Black alone
- 118,5922.1%Hispanic
- 71,9051.3%Two or more races
- 61,0411.1%Asian alone
- 23,3020.4%American Indian alone
- 5,2910.09%Other race alone
- 2,9390.05%Native Hawaiian and Other
Pacific Islander alone

-
- 4,733,41176.6%White alone
- 656,73910.6%Black alone
- 316,3005.1%Two or more races
- 291,7634.7%Hispanic
- 132,4362.1%Asian alone
- 27,4670.4%Other race alone
- 12,3130.2%American Indian alone
- 7,5280.1%Native Hawaiian and Other
Pacific Islander alone

Income and house value in Hazelwood
- Median household income in 2022
- $60,222White non-Hispanic householders
- $51,533Black householders
- $32,171Two or more races householders
- Median 2022 house value
- $168,170White Non-Hispanic householders
- $148,751Black or African American householders
- $238,842Asian householders
- $58,058Native Hawaiian and other Pacific Islander householders
- $130,132Some other race householders
- $79,280Two or more races householders
- $172,174Hispanic or Latino householders
Household income for White non-Hispanic householders

Household income for Black householders

Household income for Asian householders

Household income for Some other race householders

Household income for Two or more races householders

Household income for Hispanic or Latino race householders

Median age by race in Hazelwood
- 49.0Median age for White residents
- 43.4Males
- 53.5Females
- 33.1Median age for Black or African American residents
- 30.2Males
- 41.1Females
- -520,187,792.9Median age for American Indian / Alaska Native residents
- -644,003,776.5Males
- -505,494,505.0Females
- 30.2Median age for Asian residents
- 65.7Males
- 25.1Females
- -710,303,029.6Median age for Native Hawaiian / Pacific Islander residents
- -1,449,781,657.9Males
- -752,136,751.4Females
- 29.2Median age for Other race residents
- 32.8Males
- 30.1Females
- 23.9Median age for Two or more races residents
- 29.4Males
- 8.2Females
- 49.1Median age for White alone residents
- 43.5Males
- 53.9Females
- 35.2Median age for Hispanic or Latino residents
- 34.9Males
- 30.6Females
Owner/renter occupied households by race in Hazelwood
- House owners and renters - White residents
- 4,30073.8%Owner occupied
- 1,52726.2%Renter occupied
- House owners and renters - Black or African American residents
- 1,97141.6%Owner occupied
- 2,76758.4%Renter occupied
- House owners and renters - Asian residents
- 15764.4%Owner occupied
- 8735.6%Renter occupied
- House owners and renters - Other race residents
- 7173.9%Owner occupied
- 2526.1%Renter occupied
- House owners and renters - Two or more races residents
- 16122.9%Owner occupied
- 54277.1%Renter occupied
- House owners and renters - White alone residents
- 4,29273.7%Owner occupied
- 1,52926.3%Renter occupied
- House owners and renters - Hispanic or Latino residents
- 21570.2%Owner occupied
- 9129.8%Renter occupied
Language usage in Hazelwood
- English speakers - Total
- 92.2% of residents of Hazelwood speak English at home.
- 2.2% of residents speak Spanish at home
- 35867.4%Speak English very well
- 17332.6%Speak English less than very well
- 5.5% of residents speak other language at home
- 94172.2%Speak English very well
- 36227.8%Speak English less than very well
- English speakers - Born in the United States
- 96.3% of residents of Hazelwood speak English at home.
- 2.9% of residents speak Spanish at home
- 12390.4%Speak English very well
- 139.6%Speak English less than very well
- 0.4% of residents speak other language at home
- 21100.0%Speak English very well
All residents speak only English at home
- English speakers - Foreign-born
- 20.5% of residents of Hazelwood speak English at home.
- 19.1% of residents speak Spanish at home
- 14444.9%Speak English very well
- 17755.1%Speak English less than very well
- 61.2% of residents speak other language at home
- 68166.2%Speak English very well
- 34733.8%Speak English less than very well
White (Caucasian) - Speak only English
| Native: | 99.2% (11,477) |
| Foreign-born: | 29.0% (43) |
White (Caucasian) - Speak another language
| Native: | 0.8% (96) |
| Foreign-born: | 69.6% (103) |
Black or African American - Speak only English
| Native: | 96.9% (8,119) |
| Foreign-born: | 36.8% (382) |
Black or African American - Speak another language
| Native: | 3.8% (315) |
| Foreign-born: | 64.0% (665) |
Asian - Speak another language
| Native: | 81.8% (96) |
| Foreign-born: | 95.4% (365) |
Two or more races - Speak another language
| Native: | 7.9% (141) |
| Foreign-born: | 100.0% (162) |
White alone - Speak only English
| Native: | 99.6% (11,502) |
| Foreign-born: | 43.0% (44) |
White alone - Speak another language
| Native: | 0.4% (41) |
| Foreign-born: | 52.6% (54) |
Hispanic or Latino - Speak another language
| Native: | 26.0% (88) |
| Foreign-born: | 100.0% (322) |
Foreign-born residents in Hazelwood
1,668 residents are foreign born (3.1% Africa, 1.8% Asia, 1.5% Latin America).
| This city: | 6.6% |
| Missouri: | 4.2% |


Marital status for residents in Hazelwood
Marital status - White (Caucasian) population 15 years and over
- Males
- 36.6%Never married
- 45.5%Now married
- 1.6%Separated
- 3.4%Widowed
- 12.8%Divorced
- Females
- 23.7%Never married
- 38.8%Now married
- 2.3%Separated
- 20.1%Widowed
- 15.1%Divorced
Women who gave birth in the past 12 months
| Now married: | 17.1% (46) |
| Unmarried: | 82.9% (224) |
Women who did not give birth in the past 12 months
| Now married: | 39.7% (794) |
| Unmarried: | 60.3% (1,207) |
Marital status - Black or African American population 15 years and over
- Males
- 46.5%Never married
- 36.7%Now married
- 3.7%Separated
- 1.3%Widowed
- 11.8%Divorced
- Females
- 48.6%Never married
- 19.8%Now married
- 2.3%Separated
- 7.3%Widowed
- 22.0%Divorced
Women who gave birth in the past 12 months
| Now married: | 13.5% (7) |
| Unmarried: | 86.5% (42) |
Women who did not give birth in the past 12 months
| Now married: | 19.4% (571) |
| Unmarried: | 80.6% (2,373) |
Marital status - Asian population 15 years and over
- Males
- 20.0%Never married
- 80.0%Now married
- 0.0%Separated
- 0.0%Widowed
- 0.0%Divorced
- Females
- 56.1%Never married
- 43.9%Now married
- 0.0%Separated
- 0.0%Widowed
- 0.0%Divorced
Women who did not give birth in the past 12 months
| Now married: | 35.5% (88) |
| Unmarried: | 64.5% (160) |
Marital status - Other race population 15 years and over
- Males
- 31.4%Never married
- 57.7%Now married
- 0.0%Separated
- 0.0%Widowed
- 10.9%Divorced
- Females
- 9.9%Never married
- 64.2%Now married
- 0.0%Separated
- 25.9%Widowed
- 0.0%Divorced
Women who did not give birth in the past 12 months
| Now married: | 86.7% (56) |
| Unmarried: | 13.3% (9) |
Marital status - Two or more races population 15 years and over
- Males
- 77.1%Never married
- 13.9%Now married
- 0.0%Separated
- 9.0%Widowed
- 0.0%Divorced
- Females
- 28.2%Never married
- 19.0%Now married
- 13.4%Separated
- 1.4%Widowed
- 38.0%Divorced
Women who did not give birth in the past 12 months
| Now married: | 36.3% (108) |
| Unmarried: | 63.7% (189) |
Marital status - White alone, not Hispanic / Latino population 15 years and over
- Males
- 37.0%Never married
- 45.7%Now married
- 1.7%Separated
- 2.9%Widowed
- 12.7%Divorced
- Females
- 23.8%Never married
- 38.5%Now married
- 2.3%Separated
- 20.1%Widowed
- 15.2%Divorced
Women who gave birth in the past 12 months
| Now married: | 17.1% (47) |
| Unmarried: | 82.9% (226) |
Women who did not give birth in the past 12 months
| Now married: | 39.0% (776) |
| Unmarried: | 61.0% (1,216) |
Marital status - Hispanic or Latino population 15 years and over
- Males
- 24.3%Never married
- 41.8%Now married
- 0.0%Separated
- 9.2%Widowed
- 24.6%Divorced
- Females
- 24.1%Never married
- 59.8%Now married
- 0.0%Separated
- 0.0%Widowed
- 16.1%Divorced
Women who did not give birth in the past 12 months
| Now married: | 71.3% (160) |
| Unmarried: | 28.7% (65) |
Ancestries in Hazelwood

- 1,47711.6%German
- 7185.7%American
- 5474.3%Kenyan
- 5054.0%English
- 3532.8%Italian
- 2271.8%Irish
- 1861.5%African
- 1841.4%Polish
- 1731.4%Liberian
- 1651.3%European
- 1281.0%Jamaican
- 810.6%French
- 690.5%Nigerian
- 670.5%Albanian
- 640.5%Czech
- 580.5%Swedish
- 550.4%Scotch-Irish
- 530.4%Northern European
- 470.4%Hungarian
- 390.3%Palestinian
- 340.3%Norwegian
- 320.3%Dutch
- 300.2%Scottish
- 240.2%Russian
- 230.2%British
- 140.1%Scandinavian
- 130.1%Austrian
- 110.09%Danish
- 110.09%Icelander

Geographical mobility in Hazelwood

- Same house 1 year ago
- 11,04791.7%White (Caucasian)
- 7,86180.9%Black or African American
- 35365.1%Asian
- 8100.0%Native Hawaiian / Pacific Islander
- 26791.7%Other race
- 2,319100.0%Two or more races
- 10,98491.9%White alone, not Hispanic / Latino
- 72692.9%Hispanic or Latino

-
- Moved within same county
- 6235.2%White / Caucasian
- 1,51715.6%Black or African American
- 22040.5%Asian
- 10.5%Other race
- 80.3%Two or more races
- 6175.2%White alone, not Hispanic / Latino

-
- Moved within same state
- 2852.4%White / Caucasian
- 1291.3%Black or African American
- 152.8%Asian
- 2822.4%White alone, not Hispanic / Latino

-
- Moved from different state
- 920.8%White / Caucasian
- 2342.4%Black or African American
- 81.5%Asian
- 50.2%Two or more races
- 730.6%White alone, not Hispanic / Latino
- 415.2%Hispanic or Latino

-
- Moved from abroad
- 330.3%Black or African American
- 61.9%Other race

Children Nativity (place of birth) in Hazelwood
Place of birth for residents in Hazelwood
![Place of birth for the foreign-born population - Regions]()
- 777Africa
- 446Asia
- 391Americas
- 389Eastern Africa
- 388Western Africa
- 383Latin America
- 350South Eastern Asia
- 285Central America
- 97Caribbean
- 46Europe
- 36Western Asia
- 29Eastern Asia
- 29China
- 17Northern Europe
- 16Eastern Europe
- 12Western Europe
- 7Northern America
- 6Oceania

![Place of birth for the foreign-born population - Countries]()
- 389Kenya
- 284Liberia
- 260Vietnam
- 235Mexico
- 97Jamaica
- 89Philippines
- 49Ghana
- 49Honduras
- 39Nigeria
- 36Azerbaijan
- 29China
- 16Russia
- 14Togo
- 13Ireland
- 11France
- 7Canada
- 3United Kingdom

Grandparents responsible for own grandchildren in Hazelwood
Zip codes: 63042.