Fullerton, PA (Pennsylvania) Houses and Residents
| Fullerton: | $247,563 |
| Pennsylvania: | $245,500 |
Total population: 14,925 (Urban population: 14,213, Rural population: 0)
Houses: 6,785 (6,535 occupied: 3,374 owner occupied, 3,137 renter occupied)
| % of renters here: | 48% |
| State: | 31% |
Housing density: 1,814 houses/condos per square mile
Median price asked for vacant for-sale houses and condos in 2022 in this county: $258,893.
Median contract rent in 2022: $1,202 (lower quartile is $1,033, upper quartile is $1,436)
Median rent asked for vacant for-rent units in 2022: $1,640
Median gross rent in Fullerton, PA in 2022: $1,328
Housing units in Fullerton with a mortgage: 1,985 (268 second mortgage, 0 home equity loan, 158 both second mortgage and home equity loan)
Houses without a mortgage: 15
Median household income for houses/condos with a mortgage: $88,963
Median household income for apartments without a mortgage: $70,769
Median monthly housing costs: $1,292
Compare current foreclosures near Fullerton, PA:
| Photo | Address | Area | Beds / Baths | Price | Details |
|---|---|---|---|---|---|

|
#1
Glen Ave
Phillipsburg, NJ 08865
|
1,542 sq. feet
|
1 baths 3 beds |
$139,900
|
show details |

|
#2
High St
Tatamy, PA 18085
|
- sq. feet
|
2 baths 3 beds |
show details | |

|
#3
10th St
Bethlehem, PA 18020
|
2,050 sq. feet
|
2 baths 4 beds |
show details | |

|
#4
Brobst Hill Rd
New Tripoli, PA 18066
|
1,890 sq. feet
|
2 baths 4 beds |
show details | |

|
#5
Forest Inn Rd
Palmerton, PA 18071
|
925 sq. feet
|
1 baths 2 beds |
show details | |

|
#6
Hickory St
Nazareth, PA 18064
|
850 sq. feet
|
1 baths 2 beds |
show details | |

|
#7
Wagner Ave
Hellertown, PA 18055
|
1,091 sq. feet
|
1 baths 3 beds |
show details | |

|
#8
W Union Blvd
Bethlehem, PA 18018
|
1,836 sq. feet
|
2 baths 4 beds |
show details | |

|
#9
Horseshoe Ln
Lehighton, PA 18235
|
1,307 sq. feet
|
1 baths 3 beds |
show details | |

|
#10
Pa Route 873
Slatington, PA 18080
|
1,758 sq. feet
|
2 baths 4 beds |
show details |
| Photo | Address | Area | Beds / Baths | Price | Details |
|---|---|---|---|---|---|

|
#11
Wrangler Ct
Quakertown, PA 18951
|
1,198 sq. feet
|
2 baths 2 beds |
show details | |

|
#12
Freemansburg Ave
Easton, PA 18045
|
1,298 sq. feet
|
1 baths 3 beds |
show details | |

|
#13
Faith Dr
Catasauqua, PA 18032
|
1,540 sq. feet
|
1 baths 3 beds |
show details | |

|
#14
Foxdale Dr
Whitehall, PA 18052
|
1,729 sq. feet
|
2 baths 3 beds |
show details | |

|
#15
Washington Ave
Northampton, PA 18067
|
1,552 sq. feet
|
1 baths 3 beds |
show details | |

|
#16
Oakland Square Dr
Bethlehem, PA 18020
|
1,479 sq. feet
|
1 baths 2 beds |
show details | |

|
#17
Depot Ln
Quakertown, PA 18951
|
1,144 sq. feet
|
1 baths 3 beds |
show details | |

|
#18
Aubrey Dr
Quakertown, PA 18951
|
2,050 sq. feet
|
2 baths 3 beds |
show details | |

|
#19
W Wilkes Barre St
Easton, PA 18042
|
1,522 sq. feet
|
1 baths 3 beds |
show details | |

|
#20
Flint Hill Rd
New Tripoli, PA 18066
|
2,704 sq. feet
|
2 baths 4 beds |
show details |
| Photo | Address | Area | Beds / Baths | Price | Details |
|---|---|---|---|---|---|

|
#21
Lafayette Ave
Bethlehem, PA 18017
|
864 sq. feet
|
1 baths 3 beds |
show details | |

|
#22
Spring Water Ct
Easton, PA 18042
|
3,444 sq. feet
|
3 baths 4 beds |
show details | |

|
#23
N Church St
Whitehall, PA 18052
|
3,202 sq. feet
|
2 baths 4 beds |
show details | |

|
#24
Ginkgo Rd
Palmerton, PA 18071
|
1,276 sq. feet
|
2 baths 3 beds |
show details | |

|
#25
N 26th St
Allentown, PA 18104
|
1,841 sq. feet
|
3 baths 3 beds |
show details | |

|
#26
Valley View Dr
Kunkletown, PA 18058
|
- sq. feet
|
1 baths 3 beds |
show details | |

|
#27
Fig Way
Palmerton, PA 18071
|
2,018 sq. feet
|
2 baths 2 beds |
show details | |

|
#28
Nazareth Pike
Nazareth, PA 18064
|
880 sq. feet
|
1 baths 2 beds |
show details | |

|
#29
Washington St
Walnutport, PA 18088
|
1,096 sq. feet
|
1 baths 3 beds |
show details | |

|
#30
Cedar Dr
Walnutport, PA 18088
|
1,652 sq. feet
|
1 baths 3 beds |
show details |
| Photo | Address | Area | Beds / Baths | Price | Details |
|---|---|---|---|---|---|

|
#31
Log Fence Rd
Palmerton, PA 18071
|
1,200 sq. feet
|
1 baths 3 beds |
show details | |

|
#32
Blair Rd
Bethlehem, PA 18017
|
2,647 sq. feet
|
2 baths 4 beds |
show details | |

|
#33
Abbe Ct
Bethlehem, PA 18017
|
1,360 sq. feet
|
2 baths 3 beds |
show details | |

|
#34
Line St
Easton, PA 18042
|
2,044 sq. feet
|
1 baths 3 beds |
show details | |

|
#35
Horseshoe Dr
Quakertown, PA 18951
|
1,326 sq. feet
|
2 baths 3 beds |
show details | |

|
#36
Pine St
Easton, PA 18042
|
2,309 sq. feet
|
2 baths 3 beds |
show details | |

|
#37
S 13th St
Easton, PA 18042
|
1,488 sq. feet
|
1 baths 4 beds |
show details | |

|
#38
Ann St
Phillipsburg, NJ 08865
|
1,280 sq. feet
|
1 baths 3 beds |
show details | |

|
#39
S 12th St
Allentown, PA 18102
|
1,820 sq. feet
|
1 baths 5 beds |
show details | |

|
#40
Pennsylvania St
Whitehall, PA 18052
|
1,220 sq. feet
|
1 baths 3 beds |
show details |
| Photo | Address | Area | Beds / Baths | Price | Details |
|---|---|---|---|---|---|

|
#41
Ferry St
Easton, PA 18042
|
1,854 sq. feet
|
2 baths 5 beds |
show details | |

|
#42
Ferry St
Easton, PA 18042
|
1,900 sq. feet
|
1 baths 3 beds |
show details | |

|
#43
Kuntz Ln
Kunkletown, PA 18058
|
1,472 sq. feet
|
2 baths 2 beds |
show details | |

|
#44
Richlandtown Pike
Quakertown, PA 18951
|
- sq. feet
|
3 baths 5 beds |
show details | |

|
#45
Park Pl
Bethlehem, PA 18017
|
1,272 sq. feet
|
2 baths 3 beds |
show details | |

|
#46
Whitewood Rd
Bethlehem, PA 18017
|
1,738 sq. feet
|
2 baths 4 beds |
show details | |

|
#47
Vera Cir
Bethlehem, PA 18017
|
1,452 sq. feet
|
1 baths 3 beds |
show details | |

|
#48
Donegal Dr
Bethlehem, PA 18020
|
3,024 sq. feet
|
2 baths 4 beds |
show details | |

|
#49
Whitehead Rd
Nazareth, PA 18064
|
1,671 sq. feet
|
2 baths 3 beds |
show details | |

|
Check over 1 million property listings on Foreclosure.com!
|
browse all offers | |||

Latest news about housing in Fullerton, PA collected exclusively by city-data.com from local newspapers, TV, and radio stations

 | My family is moving towards an area near Lehigh University (31 replies) |

Median year apartment built: 1966
Household type by relationship:
Households: 16,454- Male householders: 3,223 (710 living alone), Female householders: 3,288 (939 living alone)
2,930 spouses (2,901 opposite-sex spouses), 650 unmarried partners, (632 opposite-sex unmarried partners), 5,142 children (4,708 natural, 104 adopted, 328 stepchildren), 348 grandchildren, 187 brothers or sisters, 132 parents, 0 foster children, 251 other relatives, 277 non-relatives
- In group quarters: 22
Size of family households: 2,235 2-persons, 805 3-persons, 513 4-persons, 535 5-persons, 171 6-persons, 108 7-or-more-persons.
Size of nonfamily households: 1,730 1-person, 352 2-persons, 42 3-persons, 19 4-persons.
2,407 married couples with children.
917 single-parent households (398 men, 519 women).
68.8% of residents of Fullerton speak English at home.
17.7% of residents speak Spanish at home (53% speak English very well, 30% speak English well, 13% speak English not well, 5% don't speak English at all).
2.1% of residents speak other Indo-European language at home (58% speak English very well, 19% speak English well, 6% speak English not well, 17% don't speak English at all).
1.6% of residents speak Asian or Pacific Island language at home (43% speak English very well, 31% speak English well, 26% speak English not well).
8.2% of residents speak other language at home (63% speak English very well, 24% speak English well, 7% speak English not well, 6% don't speak English at all).
Foreign born population: 3,835 (23.3%)
(46.5% of them are naturalized citizens)
| Here: | 6.1 |
| State: | 6.8 |
| Here: | 3.9 |
| State: | 4.3 |

- Bedrooms in owner-occupied houses and condos in Fullerton, Pennsylvania
- 0no bedroom
- 291 bedroom
- 5132 bedrooms
- 2,2243 bedrooms
- 4944 bedrooms
- 1155+ bedrooms

- Bedrooms in renter-occupied apartments in Fullerton, Pennsylvania
- 106no bedroom
- 1,0481 bedroom
- 1,1922 bedrooms
- 6223 bedrooms
- 1704 bedrooms
- 05+ bedrooms

- Cars and other vehicles available in Fullerton in owner-occupied houses/condos
- 159no vehicle
- 1,0151 vehicle
- 1,5222 vehicles
- 3453 vehicles
- 2674 vehicles
- 675+ vehicles

- Cars and other vehicles available in Fullerton in renter-occupied apartments
- 281no vehicle
- 1,6041 vehicle
- 9992 vehicles
- 1833 vehicles
- 474 vehicles
- 235+ vehicles

- Rooms in owner-occupied houses in Fullerton, Pennsylvania
- 01 room
- 02 rooms
- 493 rooms
- 2484 rooms
- 7695 rooms
- 1,0736 rooms
- 5487 rooms
- 2568 rooms
- 4299+ rooms

- Rooms in renter-occupied apartments in Fullerton, Pennsylvania
- 1061 room
- 1522 rooms
- 7083 rooms
- 1,0664 rooms
- 5165 rooms
- 2666 rooms
- 1907 rooms
- 1078 rooms
- 279+ rooms


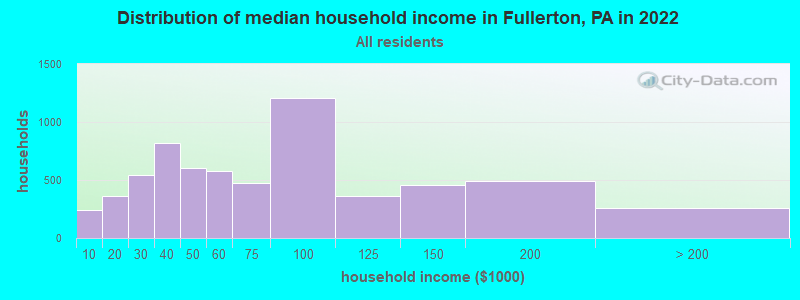
Fullerton, PA household income distribution

- 239Less than $10,000
- 365$10,000 to $19,999
- 545$20,000 to $29,999
- 816$30,000 to $39,999
- 600$40,000 to $49,999
- 574$50,000 to $59,999
- 478$60,000 to $74,999
- 1,205$75,000 to $99,999
- 363$100,000 to $124,999
- 458$125,000 to $149,999
- 493$150,000 to $199,999
- 258$200,000 or more
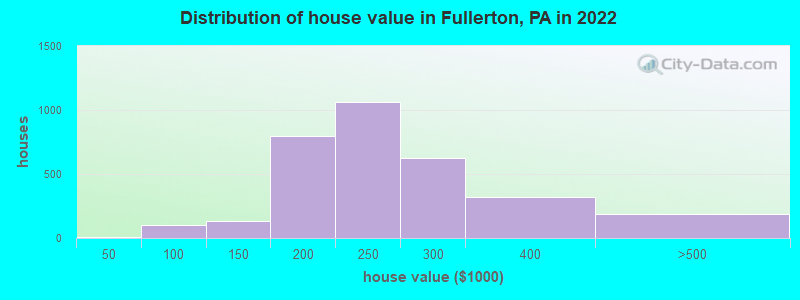
Home value of owner - occupied houses in 2022 in Fullerton, PA
-
- 3Less than $10,000
- 5$20,000 to $24,999
- 38$60,000 to $69,999
- 12$70,000 to $79,999
- 9$80,000 to $89,999
- 37$90,000 to $99,999
- 15$100,000 to $124,999
- 118$125,000 to $149,999
- 452$150,000 to $174,999
- 344$175,000 to $199,999
- 1,062$200,000 to $249,999
- 625$250,000 to $299,999
- 322$300,000 to $399,999
- 190$400,000 to $499,999
Rent paid by renters in 2022 in Fullerton, PA
-
- 25Less than $100
- 35$150 to $199
- 12$200 to $249
- 27$600 to $649
- 29$650 to $699
- 30$700 to $749
- 21$750 to $799
- 98$800 to $899
- 259$900 to $999
- 976$1,000 to $1,249
- 778$1,250 to $1,499
- 541$1,500 to $1,999
- 13$2,000 to $2,499
- 10$3,500 or more
- 173No cash rent


Percentage of workers working in this county: 71.5%
Number of people working at home: 610 (6.6% of all workers)
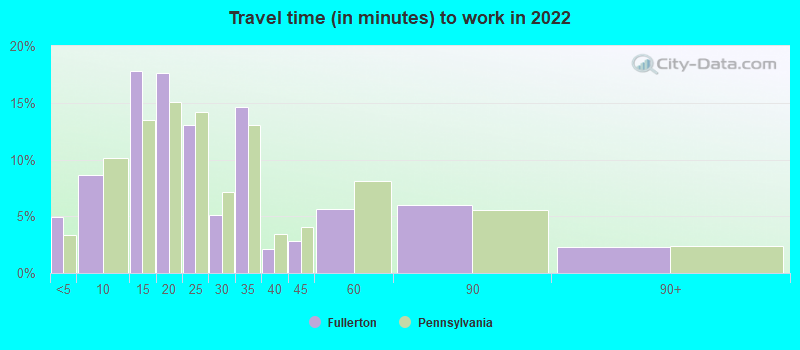
Travel time to work (commute)
- Less than 5 minutes: 215
- 5 to 9 minutes: 587
- 10 to 14 minutes: 1,174
- 15 to 19 minutes: 1,621
- 20 to 24 minutes: 1,934
- 25 to 29 minutes: 572
- 30 to 34 minutes: 915
- 35 to 39 minutes: 232
- 40 to 44 minutes: 92
- 45 to 59 minutes: 447
- 60 to 89 minutes: 330
- 90 or more minutes: 473
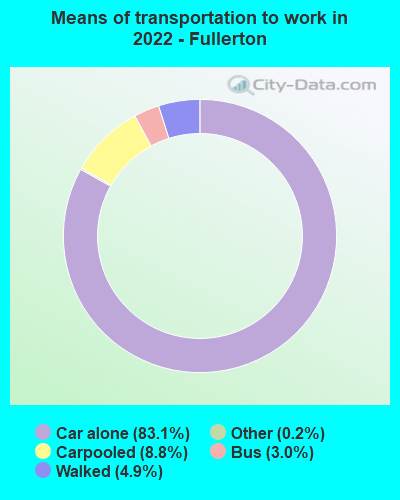
Means of transportation to work:
- Drove a car alone: 4,247 (72.1%)
- Carpooled: 541 (9.2%)
- Bus: 143 (2.4%)
- Taxi: 16 (0.3%)
- Walked: 237 (4.0%)
- Worked at home: 610 (10.4%)

- Unemployment by race in 2022
- Unemployment rate for White non-Hispanic residents
- 2.0%Males
- 3.1%Females
- Unemployment rate for Black residents
- 3.0%Males
- Unemployment rate for Asian residents
- 12.9%Females
- Unemployment rate for two or more race residents
- 15.2%Males
- 4.2%Females
- Unemployment rate for Hispanic or Latino residents
- 9.8%Males
- 2.4%Females

- Year of entry for the foreign-born population in Fullerton, Pennsylvania
- 1,9292010 or later
- 8972000 to 2009
- 5761990 to 1999
- 4981980 to 1989
- 2571970 to 1979
- 221Before 1970

First ancestries reported:
- Syrian: 1,293 (12.1%)
- German: 1,271 (11.9%)
- Irish: 400 (3.7%)
- Italian: 369 (3.4%)
- American: 367 (3.4%)
- Arab: 314 (2.9%)
- English: 267 (2.5%)
- Polish: 252 (2.4%)
- Pennsylvania German: 202 (1.9%)
- Kenyan: 127 (1.2%)
- Lebanese: 113 (1.1%)
- Austrian: 105 (1.0%)
- Jamaican: 101 (0.9%)
- Moroccan: 79 (0.7%)
- Ukrainian: 42 (0.4%)
- Slovak: 37 (0.3%)
- Dutch: 23 (0.2%)
- Swedish: 22 (0.2%)
- Liberian: 20 (0.2%)
- Hungarian: 17 (0.2%)
- Trinidadian and Tobagonian: 14 (0.1%)
- Scottish: 10 (0.09%)
- Scotch-Irish: 9 (0.08%)
- Brazilian: 8 (0.07%)
- African: 8 (0.07%)
- Czech: 7 (0.07%)
- British: 5 (0.05%)
- Eastern European: 5 (0.05%)
- Welsh: 5 (0.05%)
- French: 4 (0.04%)
Most common places of birth for foreign-born residents (%):
| Fullerton: | 31.3% (1,090) |
| Pennsylvania: | 9.2% (86,544) |
| Fullerton: | 27.0% (939) |
| Pennsylvania: | 0.5% (5,121) |
| Fullerton: | 8.1% (281) |
| Pennsylvania: | 10.7% (100,596) |
| Fullerton: | 5.6% (194) |
| Pennsylvania: | 5.8% (54,190) |
| Fullerton: | 5.4% (187) |
| Pennsylvania: | 0.3% (2,601) |
| Fullerton: | 3.8% (134) |
| Pennsylvania: | 0.5% (4,946) |
| Fullerton: | 3.0% (103) |
| Pennsylvania: | 1.1% (10,035) |
| Fullerton: | 2.1% (72) |
| Pennsylvania: | 0.2% (1,902) |
| Fullerton: | 1.8% (62) |
| Pennsylvania: | 0.5% (4,483) |
Place of birth for U.S.-born residents:
- This state: 8,657
- Other state: 3,694
- Northeast: 3,084
- Midwest: 287
- South: 232
- West: 51
87.7% of Fullerton residents lived in the same house 1 years ago.
Out of people who lived in different houses, 37.2% lived in this county.
Out of people who lived in different counties, 28.0% lived in Pennsylvania.
| Fullerton: | 87.7% |
| State average: | 89.3% |
Education attainment for males 25 years and older:
- No schooling: 100
- Nursery to 4th grade: 39
- 5th and 6th grade: 18
- 7th and 8th grade: 0
- 9th grade: 0
- 10th grade: 41
- 11th grade: 13
- 12th grade, no diploma: 223
- High school graduate (or equivalency): 2,429
- Less than 1 year of college: 375
- Some college more than 1 year, no degree: 708
- Associate degree: 530
- Bachelor's degree: 848
- Master's degree: 191
- Professional school degree: 47
- Doctorate degree: 19

Education attainment for females 25 years and older:
- No schooling: 168
- Nursery to 4th grade: 0
- 5th and 6th grade: 23
- 7th and 8th grade: 119
- 9th grade: 0
- 10th grade: 14
- 11th grade: 78
- 12th grade, no diploma: 57
- High school graduate (or equivalency): 2,136
- Less than 1 year of college: 281
- Some college more than 1 year, no degree: 613
- Associate degree: 749
- Bachelor's degree: 1,011
- Master's degree: 367
- Professional school degree: 46
- Doctorate degree: 7


Housing units in structures:
- One, detached: 2,676
- One, attached: 1,444
- Two: 265
- 3 or 4: 57
- 5 to 9: 598
- 10 to 19: 1,293
- 20 to 49: 79
- 50 or more: 370
Housing units lacking complete kitchen facilities in 2022: 0.8%
House/condo owner moved in on average 13 years ago
Renter moved in on average 2 years ago

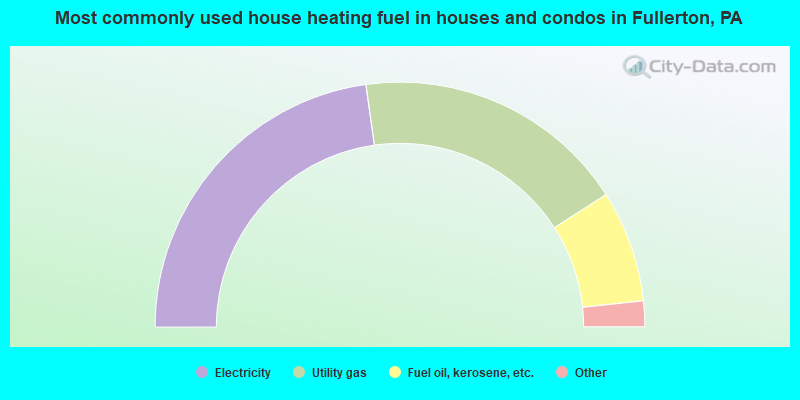
- 45.6%Electricity
- 36.3%Utility gas
- 14.8%Fuel oil, kerosene, etc.
- 1.3%No fuel used
- 1.0%Bottled, tank, or LP gas
- 0.5%Coal or coke
- 0.5%Other fuel
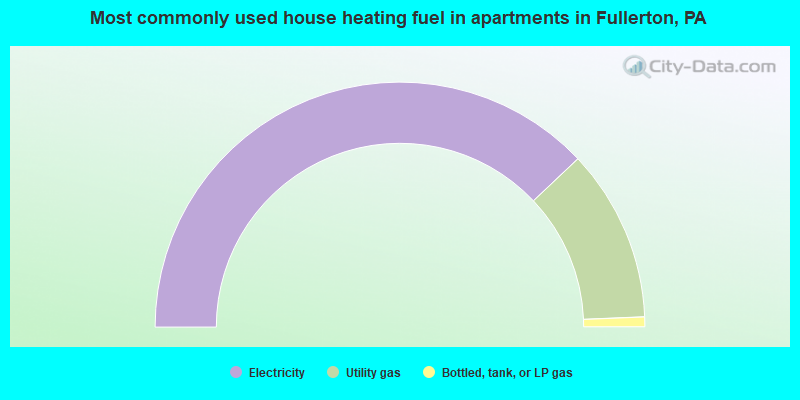
- 75.9%Electricity
- 22.8%Utility gas
- 1.3%Bottled, tank, or LP gas
Private vs. public school enrollment:
| Here: | 6.5% |
| Pennsylvania: | 15.7% |
| Here: | 2.8% |
| Pennsylvania: | 13.4% |
| Here: | 25.8% |
| Pennsylvania: | 39.8% |


