Races in Fullerton, Pennsylvania (PA) Detailed Stats
Data:
Races - White alone (%)
Races - White alone (% change since 2000)
Races - Black alone (%)
Races - Black alone (% change since 2000)
Races - American Indian alone (%)
Races - American Indian alone (% change since 2000)
Races - Asian alone (%)
Races - Asian alone (% change since 2000)
Races - Hispanic (%)
Races - Hispanic (% change since 2000)
Races - Native Hawaiian and Other Pacific Islander alone (%)
Races - Native Hawaiian and Other Pacific Islander alone (% change since 2000)
Races - Two or more races(%)
Races - Two or more races(% change since 2000)
Races - Other race alone (%)
Races - Other race alone (% change since 2000)
Racial diversity
Place of birth - Born in state of residence (%)
Place of birth - Born in state of residence (%) - White
Place of birth - Born in state of residence (%) - Black or African American
Place of birth - Born in state of residence (%) - Asian
Place of birth - Born in state of residence (%) - Hispanic or Latino
Place of birth - Born in state of residence (%) - American Indian and Alaska Native
Place of birth - Born in state of residence (%) - Multirace
Place of birth - Born in state of residence (%) - Other Race
Place of birth - Born in other state (%)
Place of birth - Born in other state (%) - White
Place of birth - Born in other state (%) - Black or African American
Place of birth - Born in other state (%) - Asian
Place of birth - Born in other state (%) - Hispanic or Latino
Place of birth - Born in other state (%) - American Indian and Alaska Native
Place of birth - Born in other state (%) - Multirace
Place of birth - Born in other state (%) - Other Race
Place of birth - Native, outside of US (%)
Place of birth - Native, outside of US (%) - White
Place of birth - Native, outside of US (%) - Black or African American
Place of birth - Native, outside of US (%) - Asian
Place of birth - Native, outside of US (%) - Hispanic or Latino
Place of birth - Native, outside of US (%) - American Indian and Alaska Native
Place of birth - Native, outside of US (%) - Multirace
Place of birth - Native, outside of US (%) - Other Race
Place of birth - Foreign born (%)
Place of birth - Foreign born (%) - White
Place of birth - Foreign born (%) - Black or African American
Place of birth - Foreign born (%) - Asian
Place of birth - Foreign born (%) - Hispanic or Latino
Place of birth - Foreign born (%) - American Indian and Alaska Native
Place of birth - Foreign born (%) - Multirace
Place of birth - Foreign born (%) - Other Race
Residents speaking English at home (%)
Residents speaking English at home - Born in the United States (%)
Residents speaking English at home - Native, born elsewhere (%)
Residents speaking English at home - Foreign born (%)
Residents speaking Spanish at home (%)
Residents speaking Spanish at home - Born in the United States (%)
Residents speaking Spanish at home - Native, born elsewhere (%)
Residents speaking Spanish at home - Foreign born (%)
Residents speaking other language at home (%)
Residents speaking other language at home - Born in the United States (%)
Residents speaking other language at home - Native, born elsewhere (%)
Residents speaking other language at home - Foreign born (%)
Marital status - Never married (%)
Marital status - Now married (%)
Marital status - Separated (%)
Marital status - Widowed (%)
Marital status - Divorced (%)
Ancestries Reported - Arab (%)
Ancestries Reported - Czech (%)
Ancestries Reported - Danish (%)
Ancestries Reported - Dutch (%)
Ancestries Reported - English (%)
Ancestries Reported - French (%)
Ancestries Reported - French Canadian (%)
Ancestries Reported - German (%)
Ancestries Reported - Greek (%)
Ancestries Reported - Hungarian (%)
Ancestries Reported - Irish (%)
Ancestries Reported - Italian (%)
Ancestries Reported - Lithuanian (%)
Ancestries Reported - Norwegian (%)
Ancestries Reported - Polish (%)
Ancestries Reported - Portuguese (%)
Ancestries Reported - Russian (%)
Ancestries Reported - Scotch-Irish (%)
Ancestries Reported - Scottish (%)
Ancestries Reported - Slovak (%)
Ancestries Reported - Subsaharan African (%)
Ancestries Reported - Swedish (%)
Ancestries Reported - Swiss (%)
Ancestries Reported - Ukrainian (%)
Ancestries Reported - United States (%)
Ancestries Reported - Welsh (%)
Ancestries Reported - West Indian (%)
Ancestries Reported - Other (%)
Geographical mobility - Same house 1 year ago (%)
Geographical mobility - Same house 1 year ago (%) - White
Geographical mobility - Same house 1 year ago (%) - Black or African American
Geographical mobility - Same house 1 year ago (%) - Asian
Geographical mobility - Same house 1 year ago (%) - Hispanic or Latino
Geographical mobility - Same house 1 year ago (%) - American Indian and Alaska Native
Geographical mobility - Same house 1 year ago (%) - Multirace
Geographical mobility - Same house 1 year ago (%) - Other Race
Geographical mobility - Moved within same county (%)
Geographical mobility - Moved within same county (%) - White
Geographical mobility - Moved within same county (%) - Black or African American
Geographical mobility - Moved within same county (%) - Asian
Geographical mobility - Moved within same county (%) - Hispanic or Latino
Geographical mobility - Moved within same county (%) - American Indian and Alaska Native
Geographical mobility - Moved within same county (%) - Multirace
Geographical mobility - Moved within same county (%) - Other Race
Geographical mobility - Moved from different county within same state (%)
Geographical mobility - Moved from different county within same state (%) - White
Geographical mobility - Moved from different county within same state (%) - Black or African American
Geographical mobility - Moved from different county within same state (%) - Asian
Geographical mobility - Moved from different county within same state (%) - Hispanic or Latino
Geographical mobility - Moved from different county within same state (%) - American Indian and Alaska Native
Geographical mobility - Moved from different county within same state (%) - Multirace
Geographical mobility - Moved from different county within same state (%) - Other Race
Geographical mobility - Moved from different state (%)
Geographical mobility - Moved from different state (%) - White
Geographical mobility - Moved from different state (%) - Black or African American
Geographical mobility - Moved from different state (%) - Asian
Geographical mobility - Moved from different state (%) - Hispanic or Latino
Geographical mobility - Moved from different state (%) - American Indian and Alaska Native
Geographical mobility - Moved from different state (%) - Multirace
Geographical mobility - Moved from different state (%) - Other Race
Geographical mobility - Moved from abroad (%)
Geographical mobility - Moved from abroad (%) - White
Geographical mobility - Moved from abroad (%) - Black or African American
Geographical mobility - Moved from abroad (%) - Asian
Geographical mobility - Moved from abroad (%) - Hispanic or Latino
Geographical mobility - Moved from abroad (%) - American Indian and Alaska Native
Geographical mobility - Moved from abroad (%) - Multirace
Geographical mobility - Moved from abroad (%) - Other Race
Place of birth for the foreign-born population - Ireland (%)
Place of birth for the foreign-born population - Denmark (%)
Place of birth for the foreign-born population - Norway (%)
Place of birth for the foreign-born population - Sweden (%)
Place of birth for the foreign-born population - United Kingdom (%)
Place of birth for the foreign-born population - England (%)
Place of birth for the foreign-born population - Scotland (%)
Place of birth for the foreign-born population - Other Northern Europe (%)
Place of birth for the foreign-born population - Austria (%)
Place of birth for the foreign-born population - Belgium (%)
Place of birth for the foreign-born population - France (%)
Place of birth for the foreign-born population - Germany (%)
Place of birth for the foreign-born population - Netherlands (%)
Place of birth for the foreign-born population - Switzerland (%)
Place of birth for the foreign-born population - Other Western Europe (%)
Place of birth for the foreign-born population - Greece (%)
Place of birth for the foreign-born population - Italy (%)
Place of birth for the foreign-born population - Portugal (%)
Place of birth for the foreign-born population - Spain (%)
Place of birth for the foreign-born population - Other Southern Europe (%)
Place of birth for the foreign-born population - Albania (%)
Place of birth for the foreign-born population - Belarus (%)
Place of birth for the foreign-born population - Bosnia and Herzegovina (%)
Place of birth for the foreign-born population - Bulgaria (%)
Place of birth for the foreign-born population - Croatia (%)
Place of birth for the foreign-born population - Czechoslovakia (%)
Place of birth for the foreign-born population - Hungary (%)
Place of birth for the foreign-born population - Latvia (%)
Place of birth for the foreign-born population - Lithuania (%)
Place of birth for the foreign-born population - North Macedonia (Macedonia) (%)
Place of birth for the foreign-born population - Moldova (%)
Place of birth for the foreign-born population - Poland (%)
Place of birth for the foreign-born population - Romania (%)
Place of birth for the foreign-born population - Russia (%)
Place of birth for the foreign-born population - Serbia (%)
Place of birth for the foreign-born population - Ukraine (%)
Place of birth for the foreign-born population - Other Eastern Europe (%)
Place of birth for the foreign-born population - China (%)
Place of birth for the foreign-born population - Hong Kong (%)
Place of birth for the foreign-born population - Taiwan (%)
Place of birth for the foreign-born population - Japan (%)
Place of birth for the foreign-born population - Korea (%)
Place of birth for the foreign-born population - Other Eastern Asia (%)
Place of birth for the foreign-born population - Afghanistan (%)
Place of birth for the foreign-born population - Bangladesh (%)
Place of birth for the foreign-born population - India (%)
Place of birth for the foreign-born population - Iran (%)
Place of birth for the foreign-born population - Kazakhstan (%)
Place of birth for the foreign-born population - Nepal (%)
Place of birth for the foreign-born population - Pakistan (%)
Place of birth for the foreign-born population - Sri Lanka (%)
Place of birth for the foreign-born population - Uzbekistan (%)
Place of birth for the foreign-born population - Other South Central Asia (%)
Place of birth for the foreign-born population - Burma (%)
Place of birth for the foreign-born population - Cambodia (%)
Place of birth for the foreign-born population - Indonesia (%)
Place of birth for the foreign-born population - Laos (%)
Place of birth for the foreign-born population - Malaysia (%)
Place of birth for the foreign-born population - Philippines (%)
Place of birth for the foreign-born population - Singapore (%)
Place of birth for the foreign-born population - Thailand (%)
Place of birth for the foreign-born population - Vietnam (%)
Place of birth for the foreign-born population - Other South Eastern Asia (%)
Place of birth for the foreign-born population - Armenia (%)
Place of birth for the foreign-born population - Iraq (%)
Place of birth for the foreign-born population - Israel (%)
Place of birth for the foreign-born population - Jordan (%)
Place of birth for the foreign-born population - Kuwait (%)
Place of birth for the foreign-born population - Lebanon (%)
Place of birth for the foreign-born population - Saudi Arabia (%)
Place of birth for the foreign-born population - Syria (%)
Place of birth for the foreign-born population - Turkey (%)
Place of birth for the foreign-born population - Yemen (%)
Place of birth for the foreign-born population - Other Western Asia (%)
Place of birth for the foreign-born population - Eritrea (%)
Place of birth for the foreign-born population - Ethiopia (%)
Place of birth for the foreign-born population - Kenya (%)
Place of birth for the foreign-born population - Somalia (%)
Place of birth for the foreign-born population - Uganda (%)
Place of birth for the foreign-born population - Zimbabwe (%)
Place of birth for the foreign-born population - Other Eastern Africa (%)
Place of birth for the foreign-born population - Cameroon (%)
Place of birth for the foreign-born population - Congo (%)
Place of birth for the foreign-born population - Democratic Republic of Congo (Zaire) (%)
Place of birth for the foreign-born population - Other Middle Africa (%)
Place of birth for the foreign-born population - Egypt (%)
Place of birth for the foreign-born population - Morocco (%)
Place of birth for the foreign-born population - Sudan (%)
Place of birth for the foreign-born population - Other Northern Africa (%)
Place of birth for the foreign-born population - South Africa (%)
Place of birth for the foreign-born population - Other Southern Africa (%)
Place of birth for the foreign-born population - Cabo Verde (%)
Place of birth for the foreign-born population - Ghana (%)
Place of birth for the foreign-born population - Liberia (%)
Place of birth for the foreign-born population - Nigeria (%)
Place of birth for the foreign-born population - Senegal (%)
Place of birth for the foreign-born population - Sierra Leone (%)
Place of birth for the foreign-born population - Other Western Africa (%)
Place of birth for the foreign-born population - Australia (%)
Place of birth for the foreign-born population - New Zealand (%)
Place of birth for the foreign-born population - Fiji (%)
Place of birth for the foreign-born population - Micronesia (%)
Place of birth for the foreign-born population - Bahamas (%)
Place of birth for the foreign-born population - Barbados (%)
Place of birth for the foreign-born population - Cuba (%)
Place of birth for the foreign-born population - Dominica (%)
Place of birth for the foreign-born population - Dominican Republic (%)
Place of birth for the foreign-born population - Grenada (%)
Place of birth for the foreign-born population - Haiti (%)
Place of birth for the foreign-born population - Jamaica (%)
Place of birth for the foreign-born population - St. Vincent and the Grenadines (%)
Place of birth for the foreign-born population - Trinidad and Tobago (%)
Place of birth for the foreign-born population - West Indies (%)
Place of birth for the foreign-born population - Other Caribbean (%)
Place of birth for the foreign-born population - Belize (%)
Place of birth for the foreign-born population - Costa Rica (%)
Place of birth for the foreign-born population - El Salvador (%)
Place of birth for the foreign-born population - Guatemala (%)
Place of birth for the foreign-born population - Honduras (%)
Place of birth for the foreign-born population - Mexico (%)
Place of birth for the foreign-born population - Nicaragua (%)
Place of birth for the foreign-born population - Panama (%)
Place of birth for the foreign-born population - Other Central America (%)
Place of birth for the foreign-born population - Argentina (%)
Place of birth for the foreign-born population - Bolivia (%)
Place of birth for the foreign-born population - Brazil (%)
Place of birth for the foreign-born population - Chile (%)
Place of birth for the foreign-born population - Colombia (%)
Place of birth for the foreign-born population - Ecuador (%)
Place of birth for the foreign-born population - Guyana (%)
Place of birth for the foreign-born population - Peru (%)
Place of birth for the foreign-born population - Uruguay (%)
Place of birth for the foreign-born population - Venezuela (%)
Place of birth for the foreign-born population - Other South America (%)
Place of birth for the foreign-born population - Canada (%)
Place of birth for the foreign-born population - Other Northern America (%)
Place of birth for the foreign-born population - Other (%)
Latest news about races in Fullerton, PA collected exclusively by city-data.com from local newspapers, TV, and radio stations
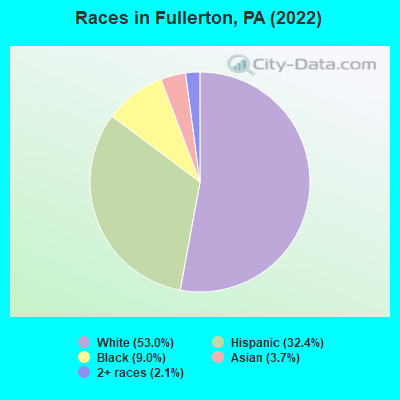
According to 2022 data, the most numerous races in Fullerton, PA are White alone (8,713 residents), Black alone (1,474 residents), and Hispanic (5,329 residents). 68.8% of Fullerton residents speak English at home. 21.2% of Fullerton, PA residents are foreign-born (10.2% born in Asia, 7.9% born in Latin America), which is 66.9% greater than the foreign-born rate of 7.0% across the entire state of Pennsylvania.
Race distribution in Fullerton
2000 2022
10,322,455 84.1% White alone 1,202,437 9.8% Black alone 394,088 3.2% Hispanic 218,296 1.8% Asian alone 113,097 0.9% Two or more races 13,086 0.1% Other race alone 14,904 0.1% American Indian alone 2,691 0.02% Native Hawaiian and Other
9,487,228 73.1% White alone 1,311,581 10.1% Black alone 1,115,997 8.6% Hispanic 493,942 3.8% Two or more races 487,124 3.8% Asian alone 63,582 0.5% Other race alone 10,130 0.08% American Indian alone 2,424 0.02% Native Hawaiian and Other
Income and house value in Fullerton Median household income in 2022 $62,667 White non-Hispanic householders$77,859 Black householders$110,696 Asian householders$91,063 Some other race householders$37,577 Two or more races householders$54,487 Hispanic or Latino race householdersMedian 2022 house value $246,486 White Non-Hispanic householders$198,223 Black or African American householders $285,699 Asian householders$248,209 Some other race householders$330,946 Two or more races householders$254,889 Hispanic or Latino householders
Median age by race in Fullerton
42.7 Median age for White residents39.3 44.3 31.5 Median age for Black or African American residents37.3 27.1 -700,389,104.4 Median age for American Indian / Alaska Native residents-611,303,344.3 -1,505,804,310.3 36.6 Median age for Asian residents37.7 36.1 -680,432,644.4 Median age for Native Hawaiian / Pacific Islander residents-649,523,808.9 -747,474,746.7 29.1 Median age for Other race residents29.4 25.6 22.1 Median age for Two or more races residents17.2 32.2 43.7 Median age for White alone residents42.1 47.5 28.7 Median age for Hispanic or Latino residents24.6 30.6
Owner/renter occupied households by race in Fullerton
House owners and renters - White residents 2,727 67.0% Owner occupied1,346 33.0% Renter occupiedHouse owners and renters - Black or African American residents 208 41.3% Owner occupied296 58.7% Renter occupiedHouse owners and renters - Asian residents 47 16.2% Owner occupied243 83.8% Renter occupiedHouse owners and renters - Other race residents 138 51.0% Owner occupied133 49.0% Renter occupiedHouse owners and renters - Two or more races residents 289 21.5% Owner occupied1,056 78.5% Renter occupiedHouse owners and renters - White alone residents 2,550 65.3% Owner occupied1,358 34.7% Renter occupiedHouse owners and renters - Hispanic or Latino residents 612 38.9% Owner occupied962 61.1% Renter occupied
Language usage in Fullerton
English speakers - Total 68.8% of residents of Fullerton speak English at home.
18.1% of residents speak Spanish at home 1,452 51.8% Speak English very well1,352 48.2% Speak English less than very well11.7% of residents speak other language at home 1,008 55.4% Speak English very well810 44.6% Speak English less than very well
English speakers - Born in the United States 72.4% of residents of Fullerton speak English at home.
27.6% of residents speak Spanish at home 815 82.9% Speak English very well168 17.1% Speak English less than very well2.5% of residents speak other language at home 87 97.8% Speak English very well2 2.2% Speak English less than very well
English speakers - Native, born elsewhere 19.0% of residents of Fullerton speak English at home.
65.5% of residents speak Spanish at home 136 41.6% Speak English very well191 58.4% Speak English less than very well16.6% of residents speak other language at home 20 24.1% Speak English very well63 75.9% Speak English less than very well
English speakers - Foreign-born 15.1% of residents of Fullerton speak English at home.
37.5% of residents speak Spanish at home 424 29.5% Speak English very well1,011 70.5% Speak English less than very well39.2% of residents speak other language at home 785 52.3% Speak English very well716 47.7% Speak English less than very well
White (Caucasian) - Speak only English Native:
92.3% (7,129)Foreign-born:
26.9% (333)
White (Caucasian) - Speak another language Native:
5.9% (456)Foreign-born:
67.7% (837)
Black or African American - Speak only English Native:
100.0% (1,189)Foreign-born:
37.8% (68)
Black or African American - Speak another language Native:
1.1% (13)Foreign-born:
62.3% (112)
Asian - Speak only English Native:
71.5% (51)Foreign-born:
9.1% (47)
Asian - Speak another language Native:
31.8% (23)Foreign-born:
88.9% (455)
Other race - Speak only English Native:
54.7% (361)Foreign-born:
2.8% (9)
Other race - Speak another language Native:
48.1% (317)Foreign-born:
91.6% (296)
Two or more races - Speak only English Native:
65.4% (1,556)Foreign-born:
20.5% (163)
Two or more races - Speak another language Native:
35.0% (834)Foreign-born:
81.9% (650)
White alone - Speak only English Native:
95.5% (6,860)Foreign-born:
25.7% (334)
White alone - Speak another language Native:
4.3% (308)Foreign-born:
66.4% (864)
Hispanic or Latino - Speak only English Native:
56.1% (1,717)Foreign-born:
6.9% (113)
Hispanic or Latino - Speak another language Native:
45.3% (1,388)Foreign-born:
88.2% (1,444)
Foreign-born residents in Fullerton 3,482 residents are foreign born (10.2% Asia , 7.9% Latin America ).
This city:
21.2%Pennsylvania:
7.3%
Marital status for residents in Fullerton Marital status - White (Caucasian) population 15 years and over
Males 35.3% Never married52.0% Now married1.1% Separated5.2% Widowed6.4% DivorcedFemales 28.5% Never married47.9% Now married0.3% Separated10.6% Widowed12.7% DivorcedWomen who gave birth in the past 12 months Now married:
55.7% (38)Unmarried:
44.3% (30)
Women who did not give birth in the past 12 months Now married:
48.6% (991)Unmarried:
51.4% (1,047)
Marital status - Black or African American population 15 years and over
Males 71.0% Never married18.9% Now married0.0% Separated1.8% Widowed8.3% DivorcedFemales 65.0% Never married12.1% Now married2.2% Separated0.0% Widowed20.7% DivorcedWomen who gave birth in the past 12 months Now married:
0.0% (0)Unmarried:
100.0% (35)
Women who did not give birth in the past 12 months Now married:
18.9% (58)Unmarried:
81.1% (248)
Marital status - Asian population 15 years and over
Males 18.7% Never married81.3% Now married0.0% Separated0.0% Widowed0.0% DivorcedFemales 0.0% Never married100.0% Now married0.0% Separated0.0% Widowed0.0% DivorcedWomen who did not give birth in the past 12 months Now married:
100.0% (112)Unmarried:
0.0% (0)
Marital status - Other race population 15 years and over
Males 61.0% Never married36.2% Now married0.0% Separated0.0% Widowed2.7% DivorcedFemales 59.2% Never married39.4% Now married0.0% Separated0.0% Widowed1.4% DivorcedWomen who gave birth in the past 12 months Now married:
100.0% (43)Unmarried:
0.0% (0)
Women who did not give birth in the past 12 months Now married:
21.4% (57)Unmarried:
78.6% (211)
Marital status - Two or more races population 15 years and over
Males 41.5% Never married46.9% Now married0.0% Separated0.0% Widowed11.6% DivorcedFemales 18.0% Never married59.0% Now married4.5% Separated1.0% Widowed17.5% DivorcedWomen who gave birth in the past 12 months Now married:
34.8% (20)Unmarried:
65.2% (37)
Women who did not give birth in the past 12 months Now married:
66.1% (521)Unmarried:
33.9% (267)
Marital status - White alone, not Hispanic / Latino population 15 years and over
Males 31.6% Never married53.7% Now married1.1% Separated6.2% Widowed7.4% DivorcedFemales 27.2% Never married47.6% Now married0.4% Separated12.1% Widowed12.7% DivorcedWomen who gave birth in the past 12 months Now married:
100.0% (42)Unmarried:
0.0% (0)
Women who did not give birth in the past 12 months Now married:
47.2% (829)Unmarried:
52.8% (927)
Marital status - Hispanic or Latino population 15 years and over
Males 47.5% Never married44.4% Now married0.5% Separated0.6% Widowed7.0% DivorcedFemales 29.2% Never married54.4% Now married0.9% Separated0.5% Widowed15.0% DivorcedWomen who gave birth in the past 12 months Now married:
29.3% (29)Unmarried:
70.7% (69)
Women who did not give birth in the past 12 months Now married:
57.9% (766)Unmarried:
42.1% (558)
Ancestries in Fullerton
1,293 12.1% Syrian1,271 11.9% German400 3.7% Irish369 3.4% Italian367 3.4% American314 2.9% Arab267 2.5% English252 2.4% Polish202 1.9% Pennsylvania German127 1.2% Kenyan113 1.1% Lebanese105 1.0% Austrian101 0.9% Jamaican79 0.7% Moroccan42 0.4% Ukrainian37 0.3% Slovak23 0.2% Dutch22 0.2% Swedish20 0.2% Liberian17 0.2% Hungarian14 0.1% Trinidadian and Tobagonian10 0.09% Scottish9 0.08% Scotch-Irish8 0.07% Brazilian8 0.07% African7 0.07% Czech5 0.05% British5 0.05% Eastern European5 0.05% Welsh4 0.04% French
Children Nativity (place of birth) in Fullerton
Children under 6 years - Living with two parents Both parents native 365 100.0% NativeBoth parents foreign-born 211 95.6% Native10 4.4% Foreign-bornOne native, one foreign-born parent 66 100.0% NativeChildren under 6 years - Living with one parent Native parent 471 100.0% NativeForeign-born parent 87 100.0% NativeChildren 6 to 17 years - Living with two parents Both parents native 1,300 100.0% NativeBoth parents foreign-born 355 68.4% Native164 31.6% Foreign-bornOne native, one foreign-born parent 85 93.7% Native6 6.3% Foreign-bornChildren 6 to 17 years - Living with one parent Native parent 324 100.0% NativeForeign-born parent 95 65.0% Native51 35.0% Foreign-born
Grandparents responsible for own grandchildren in Fullerton
Grandparents (30 to 59 years) White / Caucasian 11 46.3% Responsible for grandchildren13 53.7% Not responsible for grandchildrenBlack or African American 12 100.0% Responsible for grandchildrenOther race 126 100.0% Not responsible for grandchildrenTwo or more races 32 100.0% Not responsible for grandchildrenWhite alone, not Hispanic / Latino 18 53.9% Responsible for grandchildren16 46.1% Not responsible for grandchildrenHispanic or Latino 158 100.0% Not responsible for grandchildren
Grandparents (60 years and over) White / Caucasian 72 100.0% Not responsible for grandchildrenOther race 44 100.0% Not responsible for grandchildrenWhite alone, not Hispanic / Latino 87 100.0% Not responsible for grandchildrenHispanic or Latino 51 100.0% Not responsible for grandchildren