Fairmont, WV (West Virginia) Houses and Residents
| Fairmont: | $149,356 |
| West Virginia: | $155,100 |
Total population: 18,740 (All urban)
Houses: 8,998 (7,878 occupied: 5,001 owner occupied, 3,075 renter occupied)
| % of renters here: | 38% |
| State: | 26% |
Housing density: 1,149 houses/condos per square mile
Median price asked for vacant for-sale houses and condos in 2022: $113,380.
Median contract rent in 2022: $636 (lower quartile is $473, upper quartile is $819)
Median rent asked for vacant for-rent units in 2022: $2,109
Median gross rent in Fairmont, WV in 2022: $822
Housing units in Fairmont with a mortgage: 2,847 (362 second mortgage, 19 home equity loan, 344 both second mortgage and home equity loan)
Houses without a mortgage: 75
Median household income for houses/condos with a mortgage: $86,122
Median household income for apartments without a mortgage: $48,416
Median monthly housing costs: $808
Compare current foreclosures near Fairmont, WV:
| Photo | Address | Area | Beds / Baths | Price | Details |
|---|---|---|---|---|---|

|
#1
Lambert Ave
Fairmont, WV 26554
|
1,406 sq. feet
|
1 baths 2 beds |
$44,500
|
show details |

|
#2
Littlebrook Way
Fairmont, WV 26554
|
1,250 sq. feet
|
1 baths 3 beds |
show details | |

|
#3
Robin Ln
Fairmont, WV 26554
|
992 sq. feet
|
1 baths 2 beds |
show details | |

|
#4
Eastwood Dr
Fairmont, WV 26554
|
1,220 sq. feet
|
1 baths 2 beds |
show details | |

|
#5
Matthew Dr
Fairmont, WV 26554
|
1,862 sq. feet
|
2 baths 3 beds |
show details | |

|
#6
Whispering Pines Dr
Fairmont, WV 26554
|
1,388 sq. feet
|
1 baths 3 beds |
show details | |

|
#7
Peacock Ln
Fairmont, WV 26554
|
2,089 sq. feet
|
1 baths 4 beds |
show details | |

|
#8
Clifton Rd
Fairmont, WV 26554
|
1,000 sq. feet
|
2 baths 3 beds |
show details | |

|
#9
Spruce St
Fairmont, WV 26554
|
1,818 sq. feet
|
1 baths 3 beds |
show details | |

|
#10
Drexel Pl
Fairmont, WV 26554
|
1,650 sq. feet
|
2 baths 3 beds |
show details |
| Photo | Address | Area | Beds / Baths | Price | Details |
|---|---|---|---|---|---|

|
#11
Hampton Rd
Fairmont, WV 26554
|
1,344 sq. feet
|
1 baths 5 beds |
show details | |

|
#12
Tygart St
Fairmont, WV 26554
|
864 sq. feet
|
1 baths 3 beds |
show details | |

|
#13
Mayapple Ln
Fairmont, WV 26554
|
- sq. feet
|
- baths - beds |
show details | |

|
#14
Front St
Fairmont, WV 26554
|
- sq. feet
|
- baths - beds |
show details | |

|
#15
Old Monongah Rd
Fairmont, WV 26554
|
- sq. feet
|
- baths - beds |
show details | |

|
#16
Monumental Rd
Fairmont, WV 26554
|
- sq. feet
|
- baths - beds |
show details | |

|
#17
Main Ave, Apt 1
Fairmont, WV 26554
|
- sq. feet
|
- baths - beds |
show details | |

|
#18
Lehman Ave
Fairmont, WV 26554
|
- sq. feet
|
- baths - beds |
show details | |

|
#19
Otter Run Rd
Fairmont, WV 26554
|
- sq. feet
|
- baths - beds |
show details | |

|
#20
Gaston Ave Apt B
Fairmont, WV 26554
|
- sq. feet
|
- baths - beds |
show details |
| Photo | Address | Area | Beds / Baths | Price | Details |
|---|---|---|---|---|---|

|
#21
Hecks Run Rd
Fairmont, WV 26554
|
- sq. feet
|
- baths - beds |
show details | |

|
#22
Watercrest Ln
Fairmont, WV 26554
|
- sq. feet
|
- baths - beds |
show details | |

|
#23
Airport Rd # A
Fairmont, WV 26554
|
- sq. feet
|
- baths - beds |
show details | |

|
#24
W Main St
Grafton, WV 26354
|
960 sq. feet
|
1 baths 3 beds |
$49,900
|
show details |

|
#25
Circle Dr
Fairmont, WV 26554
|
- sq. feet
|
- baths - beds |
show details | |

|
#26
Hopewell Rd
Fairmont, WV 26554
|
- sq. feet
|
- baths - beds |
show details | |

|
#27
A-B Richmond St
Morgantown, WV 26501
|
1,433 sq. feet
|
2 baths 7 beds |
show details | |

|
#28
Fairview Rd
Independence, WV 26374
|
999 sq. feet
|
1 baths 2 beds |
show details | |

|
#29
Herman Ave
Morgantown, WV 26505
|
1,248 sq. feet
|
2 baths 4 beds |
show details | |

|
#30
Maple Ave
Grafton, WV 26354
|
1,199 sq. feet
|
1 baths 3 beds |
show details |
| Photo | Address | Area | Beds / Baths | Price | Details |
|---|---|---|---|---|---|

|
#31
Walnut St
Grafton, WV 26354
|
1,956 sq. feet
|
1 baths 3 beds |
show details | |

|
#32
Bolyard Rd
Grafton, WV 26354
|
- sq. feet
|
- baths - beds |
$27,900
|
show details |

|
#33
Anderson Hollow Rd
Mannington, WV 26582
|
1,832 sq. feet
|
1 baths 2 beds |
show details | |

|
#34
1/2 School St
Barrackville, WV 26559
|
1 sq. feet
|
3 baths 2 beds |
show details | |

|
#35
Festus Ridge Rd
Worthington, WV 26591
|
960 sq. feet
|
1 baths 2 beds |
show details | |

|
#36
Wadestown Road
Hundred, WV 26575
|
- sq. feet
|
2 baths 3 beds |
show details | |

|
#37
High St
Shinnston, WV 26431
|
1,165 sq. feet
|
1 baths 3 beds |
show details | |

|
#38
Wisconsin Ave
Morgantown, WV 26501
|
984 sq. feet
|
1 baths 3 beds |
show details | |

|
#39
Cadet Ct
Morgantown, WV 26508
|
2,147 sq. feet
|
2 baths 2 beds |
show details | |

|
#40
Cherry Ln
Morgantown, WV 26505
|
1,744 sq. feet
|
2 baths 4 beds |
show details |
| Photo | Address | Area | Beds / Baths | Price | Details |
|---|---|---|---|---|---|

|
#41
Bethel Rd
Morgantown, WV 26501
|
1,000 sq. feet
|
1 baths 3 beds |
show details | |

|
#42
W 1st St
Morgantown, WV 26501
|
828 sq. feet
|
1 baths 2 beds |
show details | |

|
#43
Summers School Rd
Morgantown, WV 26508
|
1,620 sq. feet
|
1 baths 3 beds |
show details | |

|
#44
Tyrone Rd
Morgantown, WV 26508
|
1,368 sq. feet
|
3 baths 4 beds |
show details | |

|
#45
Laurel St
Morgantown, WV 26505
|
908 sq. feet
|
1 baths 2 beds |
show details | |

|
#46
1 Box 41
Bridgeport, WV 26330
|
- sq. feet
|
- baths - beds |
show details | |

|
#47
Broadway St
Flemington, WV 26347
|
- sq. feet
|
- baths - beds |
show details | |

|
#48
Jones Run Rd
Lumberport, WV 26386
|
- sq. feet
|
- baths - beds |
show details | |

|
#49
Mccartney Ave Apt B
Morgantown, WV 26505
|
- sq. feet
|
- baths - beds |
show details | |

|
Check over 1 million property listings on Foreclosure.com!
|
browse all offers | |||

Latest news about housing in Fairmont, WV collected exclusively by city-data.com from local newspapers, TV, and radio stations

 | Bridgeport/Fairmont safe apartments (2 replies) |
| Fairmont people, is this a good place? (17 replies) |
| Looking for house to Rent in Fairmont, Clarksburg, Bridgeport, WV area (1 reply) |
| Need help finding a house to rent around Morgantown area, please :) (6 replies) |
| Fairmont WV, abandoned houses?? (3 replies) |
| Is WV really as depressing as portrayed? (74 replies) |

Median year apartment built: 1961
Household type by relationship:
Households: 18,219- Male householders: 3,704 (1,153 living alone), Female householders: 4,072 (1,491 living alone)
3,026 spouses (3,014 opposite-sex spouses), 724 unmarried partners, (666 opposite-sex unmarried partners), 4,180 children (3,818 natural, 216 adopted, 144 stepchildren), 335 grandchildren, 127 brothers or sisters, 80 parents, 11 foster children, 155 other relatives, 765 non-relatives
- In group quarters: 1,034
Size of family households: 2,084 2-persons, 1,216 3-persons, 637 4-persons, 332 5-persons, 99 6-persons, 12 7-or-more-persons.
Size of nonfamily households: 2,734 1-person, 944 2-persons, 43 3-persons, 4 4-persons.
1,722 married couples with children.
1,224 single-parent households (575 men, 649 women).
97.9% of residents of Fairmont speak English at home.
0.5% of residents speak Spanish at home (100% speak English very well).
0.8% of residents speak other Indo-European language at home (99% speak English very well, 1% speak English well).
0.3% of residents speak Asian or Pacific Island language at home (100% speak English very well).
0.2% of residents speak other language at home (54% speak English very well, 46% speak English well).
Foreign born population: 177 (1.0%)
(70.1% of them are naturalized citizens)
| Here: | 6.5 |
| State: | 6.5 |
| Here: | 4.3 |
| State: | 4.7 |

- Bedrooms in owner-occupied houses and condos in Fairmont, West Virginia
- 0no bedroom
- 1171 bedroom
- 1,2382 bedrooms
- 2,8293 bedrooms
- 7334 bedrooms
- 845+ bedrooms

- Bedrooms in renter-occupied apartments in Fairmont, West Virginia
- 69no bedroom
- 8731 bedroom
- 1,2812 bedrooms
- 5343 bedrooms
- 2874 bedrooms
- 325+ bedrooms

- Cars and other vehicles available in Fairmont in owner-occupied houses/condos
- 258no vehicle
- 1,7701 vehicle
- 1,9852 vehicles
- 5943 vehicles
- 3274 vehicles
- 685+ vehicles

- Cars and other vehicles available in Fairmont in renter-occupied apartments
- 743no vehicle
- 1,3351 vehicle
- 8492 vehicles
- 1293 vehicles
- 84 vehicles
- 115+ vehicles

- Rooms in owner-occupied houses in Fairmont, West Virginia
- 01 room
- 102 rooms
- 313 rooms
- 3334 rooms
- 1,0135 rooms
- 1,3006 rooms
- 9197 rooms
- 6148 rooms
- 7829+ rooms

- Rooms in renter-occupied apartments in Fairmont, West Virginia
- 621 room
- 1022 rooms
- 7753 rooms
- 7284 rooms
- 3995 rooms
- 4936 rooms
- 3267 rooms
- 1358 rooms
- 579+ rooms


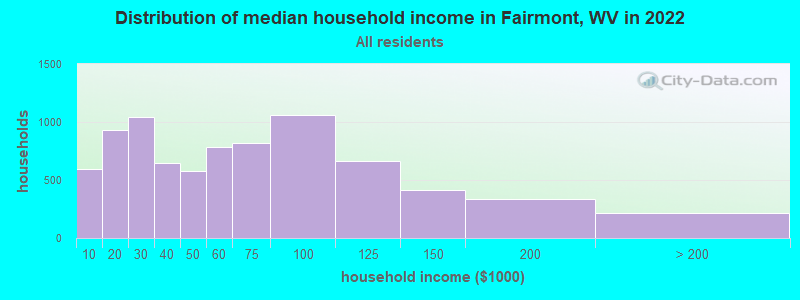
Fairmont, WV household income distribution

- 591Less than $10,000
- 928$10,000 to $19,999
- 1,039$20,000 to $29,999
- 645$30,000 to $39,999
- 574$40,000 to $49,999
- 781$50,000 to $59,999
- 823$60,000 to $74,999
- 1,058$75,000 to $99,999
- 665$100,000 to $124,999
- 416$125,000 to $149,999
- 333$150,000 to $199,999
- 215$200,000 or more
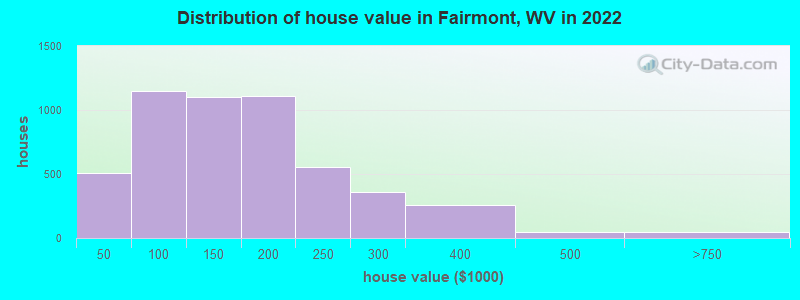
Home value of owner - occupied houses in 2022 in Fairmont, WV
-
- 77$10,000 to $14,999
- 73$15,000 to $19,999
- 54$20,000 to $24,999
- 3$25,000 to $29,999
- 83$30,000 to $34,999
- 20$35,000 to $39,999
- 195$40,000 to $49,999
- 145$50,000 to $59,999
- 111$60,000 to $69,999
- 375$70,000 to $79,999
- 178$80,000 to $89,999
- 137$90,000 to $99,999
- 578$100,000 to $124,999
- 524$125,000 to $149,999
- 818$150,000 to $174,999
- 293$175,000 to $199,999
- 556$200,000 to $249,999
- 362$250,000 to $299,999
- 254$300,000 to $399,999
- 48$400,000 to $499,999
- 43$500,000 to $749,999
Rent paid by renters in 2022 in Fairmont, WV
-
- 51Less than $100
- 6$100 to $149
- 80$150 to $199
- 140$200 to $249
- 76$250 to $299
- 62$300 to $349
- 135$350 to $399
- 80$400 to $449
- 131$450 to $499
- 320$500 to $549
- 153$550 to $599
- 342$600 to $649
- 283$650 to $699
- 140$700 to $749
- 87$750 to $799
- 437$800 to $899
- 178$900 to $999
- 155$1,000 to $1,249
- 97$1,250 to $1,499
- 146No cash rent


Percentage of workers working in this county: 63.7%
Number of people working at home: 1,021 (11.8% of all workers)
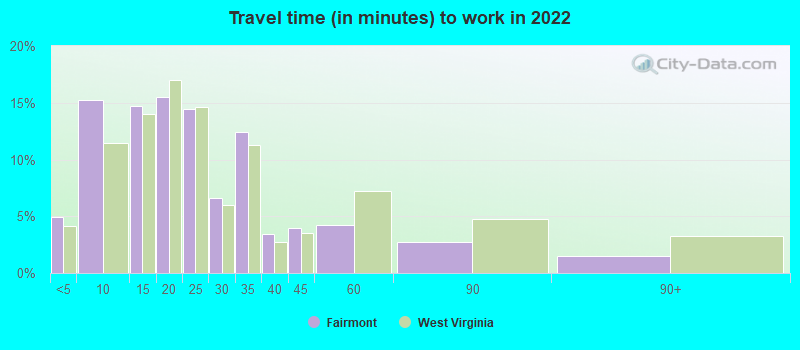
Travel time to work (commute)
- Less than 5 minutes: 393
- 5 to 9 minutes: 1,193
- 10 to 14 minutes: 829
- 15 to 19 minutes: 1,423
- 20 to 24 minutes: 757
- 25 to 29 minutes: 697
- 30 to 34 minutes: 1,397
- 35 to 39 minutes: 224
- 40 to 44 minutes: 190
- 45 to 59 minutes: 307
- 60 to 89 minutes: 119
- 90 or more minutes: 139
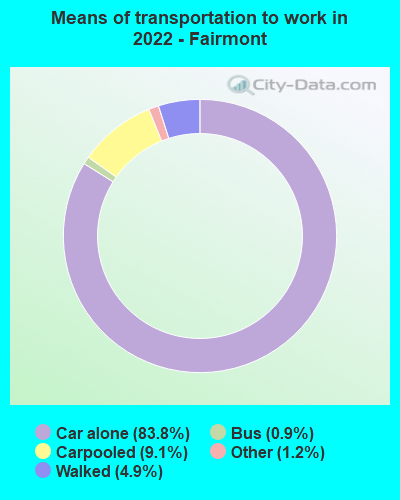
Means of transportation to work:
- Drove a car alone: 8,335 (76.1%)
- Carpooled: 906 (8.3%)
- Bus: 87 (0.8%)
- Subway or elevated rail: 6 (0.1%)
- Taxi: 135 (1.2%)
- Walked: 452 (4.1%)
- Worked at home: 1,021 (9.3%)

- Unemployment by race in 2022
- Unemployment rate for White non-Hispanic residents
- 5.1%Males
- 7.2%Females
- Unemployment rate for Black residents
- 13.4%Males
- 5.4%Females
- Unemployment rate for two or more race residents
- 13.3%Males
- 3.9%Females
- Unemployment rate for Hispanic or Latino residents
- 13.2%Females

- Year of entry for the foreign-born population in Fairmont, West Virginia
- 272010 or later
- 22000 to 2009
- 631990 to 1999
- 211980 to 1989
- 431970 to 1979
- 70Before 1970

First ancestries reported:
- English: 1,118 (14.8%)
- American: 1,107 (14.6%)
- German: 998 (13.2%)
- Italian: 866 (11.4%)
- Irish: 788 (10.4%)
- Scotch-Irish: 122 (1.6%)
- European: 113 (1.5%)
- Scottish: 76 (1.0%)
- West Indian: 64 (0.8%)
- Polish: 54 (0.7%)
- Canadian: 53 (0.7%)
- French: 49 (0.6%)
- French Canadian: 37 (0.5%)
- Ukrainian: 35 (0.5%)
- Haitian: 26 (0.3%)
- Russian: 22 (0.3%)
- Hungarian: 15 (0.2%)
- Croatian: 11 (0.1%)
- Greek: 11 (0.1%)
- Swedish: 7 (0.09%)
- Jamaican: 7 (0.09%)
- British: 6 (0.08%)
- Czech: 6 (0.08%)
- Dutch: 6 (0.08%)
- Estonian: 6 (0.08%)
- African: 6 (0.08%)
- Danish: 5 (0.07%)
Most common places of birth for foreign-born residents (%):
| Fairmont: | 25.3% (41) |
| West Virginia: | 0.5% (147) |
| Fairmont: | 15.4% (25) |
| West Virginia: | 5.8% (1,673) |
| Fairmont: | 14.2% (23) |
| West Virginia: | 1.5% (442) |
| Fairmont: | 11.7% (19) |
| West Virginia: | 4.3% (1,233) |
| Fairmont: | 6.8% (11) |
| West Virginia: | 0.8% (229) |
| Fairmont: | 6.2% (10) |
| West Virginia: | 2.4% (705) |
| Fairmont: | 5.6% (9) |
| West Virginia: | 0.2% (45) |
| Fairmont: | 4.9% (8) |
| West Virginia: | 0.6% (183) |
| Fairmont: | 2.5% (4) |
| West Virginia: | 2.2% (642) |
| Fairmont: | 1.9% (3) |
| West Virginia: | 0.2% (50) |
Place of birth for U.S.-born residents:
- This state: 13,483
- Other state: 4,452
- Northeast: 1,274
- Midwest: 828
- South: 2,166
- West: 159
82.3% of Fairmont residents lived in the same house 1 years ago.
Out of people who lived in different houses, 30.1% lived in this county.
Out of people who lived in different counties, 65.5% lived in West Virginia.
| Fairmont: | 82.3% |
| State average: | 89.6% |
Education attainment for males 25 years and older:
- No schooling: 56
- Nursery to 4th grade: 0
- 5th and 6th grade: 0
- 7th and 8th grade: 42
- 9th grade: 111
- 10th grade: 48
- 11th grade: 35
- 12th grade, no diploma: 107
- High school graduate (or equivalency): 2,024
- Less than 1 year of college: 280
- Some college more than 1 year, no degree: 888
- Associate degree: 370
- Bachelor's degree: 1,167
- Master's degree: 492
- Professional school degree: 81
- Doctorate degree: 67

Education attainment for females 25 years and older:
- No schooling: 210
- Nursery to 4th grade: 0
- 5th and 6th grade: 8
- 7th and 8th grade: 38
- 9th grade: 145
- 10th grade: 71
- 11th grade: 42
- 12th grade, no diploma: 56
- High school graduate (or equivalency): 1,968
- Less than 1 year of college: 385
- Some college more than 1 year, no degree: 648
- Associate degree: 667
- Bachelor's degree: 1,447
- Master's degree: 659
- Professional school degree: 28
- Doctorate degree: 78


Housing units in structures:
- One, detached: 6,497
- One, attached: 123
- Two: 700
- 3 or 4: 429
- 5 to 9: 551
- 10 to 19: 83
- 20 to 49: 130
- 50 or more: 296
- Mobile homes: 186
Median worth of mobile homes: $41,566
Housing units lacking complete kitchen facilities in 2022: 3.3%
House/condo owner moved in on average 14 years ago
Renter moved in on average 1 years ago

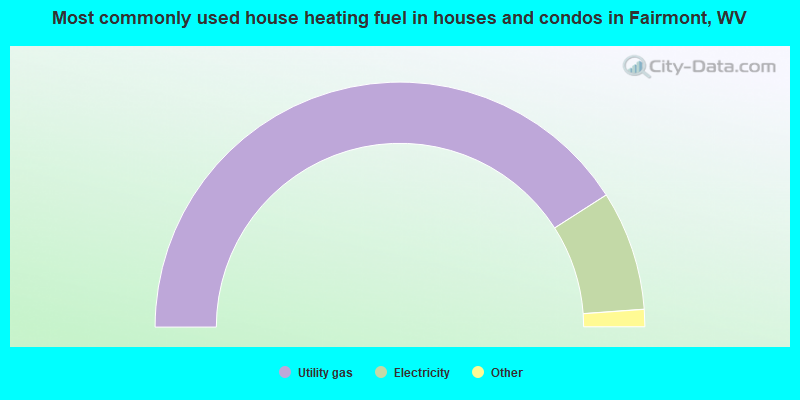
- 81.9%Utility gas
- 15.8%Electricity
- 1.3%Wood
- 0.5%Fuel oil, kerosene, etc.
- 0.2%No fuel used
- 0.2%Bottled, tank, or LP gas
- 0.2%Coal or coke
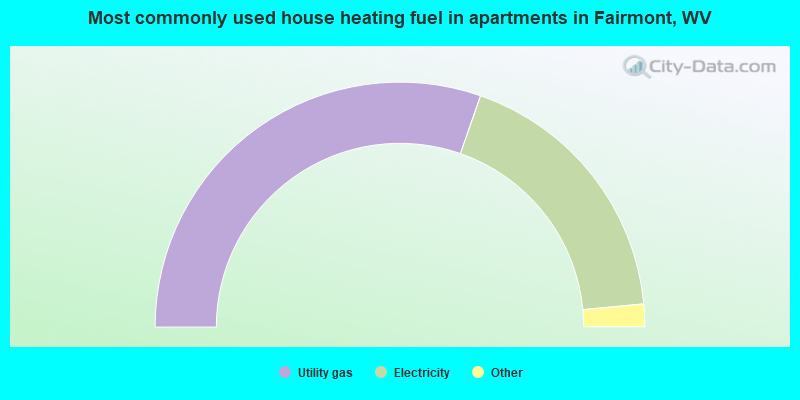
- 60.7%Utility gas
- 36.3%Electricity
- 1.6%No fuel used
- 1.3%Bottled, tank, or LP gas
Private vs. public school enrollment:
| Here: | 6.7% |
| West Virginia: | 12.2% |
| Here: | 11.8% |
| West Virginia: | 8.8% |
| Here: | 6.9% |
| West Virginia: | 17.3% |


